Ratio TP SL MT5
- ユーティリティ
- Pavel Verveyko
- バージョン: 1.2
- アップデート済み: 11 12月 2020
- アクティベーション: 5
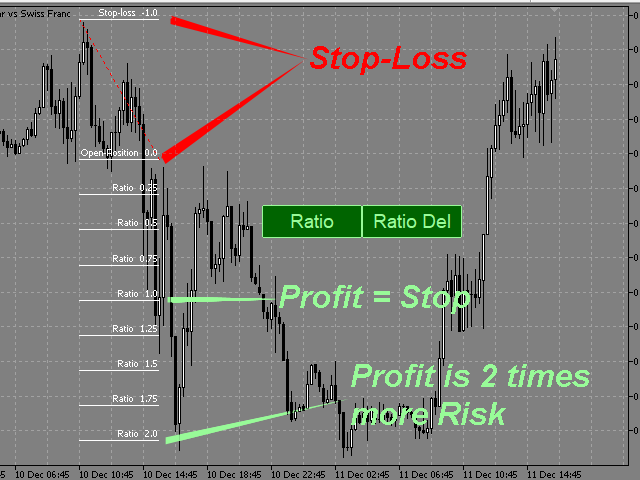
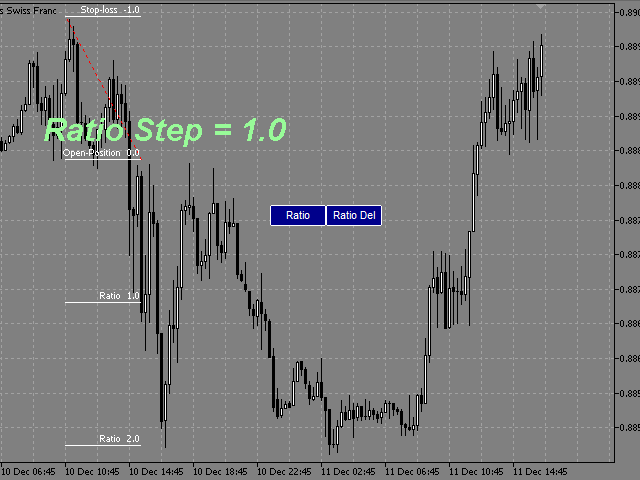
This indicator allows you to measure the profitability of each specific transaction (the ratio of Stop and Profit).
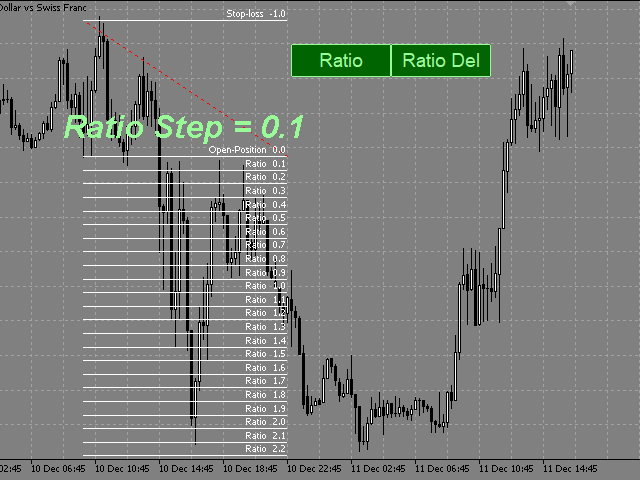
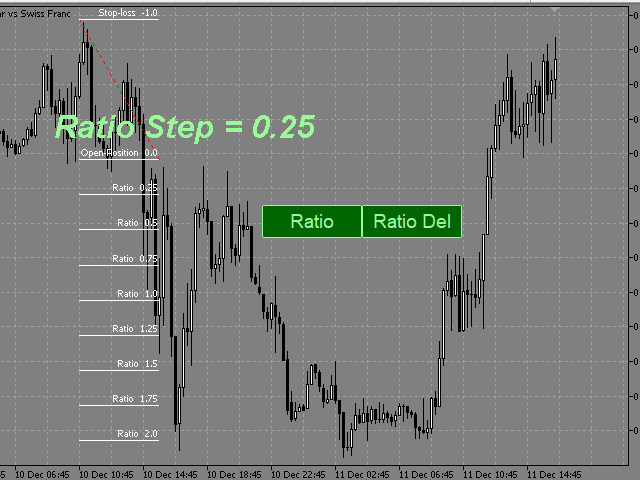
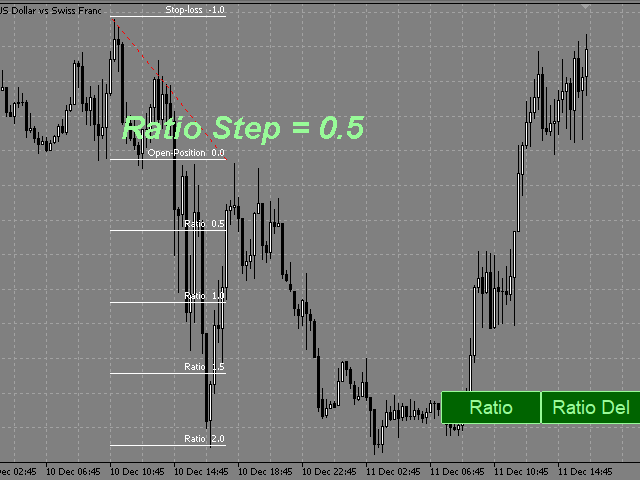
The indicator allows you to adjust the ratio by step size and number of steps.
You can build an unlimited number of ratios to compare the risks from different movements.
Note: the MT5 tester is not designed for full-fledged work with graphic objects, so drawing in the tester is slower than in the real situation.
The ratio selection is performed with 1 mouse click.
Building a line: click the "Ratio" button and draw a line (mouse click - the first point of the line, where the mouse is released - the second point of the line).
Changing the Ratio: select a line and drag it with the mouse.
Delete all ratios: click "Ratio_Del". During the number of seconds selected in the "Ratio_Del_Cancel" setting, the "Ratio_Del" button can be clicked to cancel, and the "Ratio_Del" command will be canceled.
The size of the buttons depends on the font in the Button_Font setting and its size in the Button_FontSize setting.
On-screen buttons can be dragged with the mouse.
You can assign keyboard shortcuts to on-screen buttons (a-Z, 0-9).
Настройки
- Ratio_Step - ratio step.
- Ratio_Maximum - the maximum value of the ratios.
- Ratio_key -hotkey for drawing the ratio (you can assign (a-Z, 0-9)).
- Ratio_Del_key - hotkey for deleting all ratios (you can assign (a-Z, 0-9))
- (ratios are deleted after the pause selected in the Ratio_Del_Cancel setting).
- Ratio_Del_Cancel - time to cancel the Ratio_Del_key command (in seconds).
- Button_Color - color of text and button borders.
- Button_Background_Color - buttons background color (if Button_Background_Color=clrNONE, the buttons background is the same as the graph background color).
- Button_Pressed_Color - color of the text and border of the buttons when pressed.
- Button FontSize - button font size.
- Button_Font - the font of the buttons.
- Line_Color - color of the ratio control line.
- Line_Style - style of the ratio control line.
- Line_Width - the thickness of the ratio control line.
- Ratio_Lines_Color - the color of the lines ratio.
- Ratio_Lines_Style - the style lines of the ratio.
- Ratio_Lines_Width - the thickness of the lines ratio.
This is a wonderful product for measuring Risk Reward..a welcome addition to Chartist's Toolkit.It supports many configuration options too.