Trading Sessions MT4 Indicator by PipTick
- ユーティリティ
- Michal Jurnik
- バージョン: 1.0
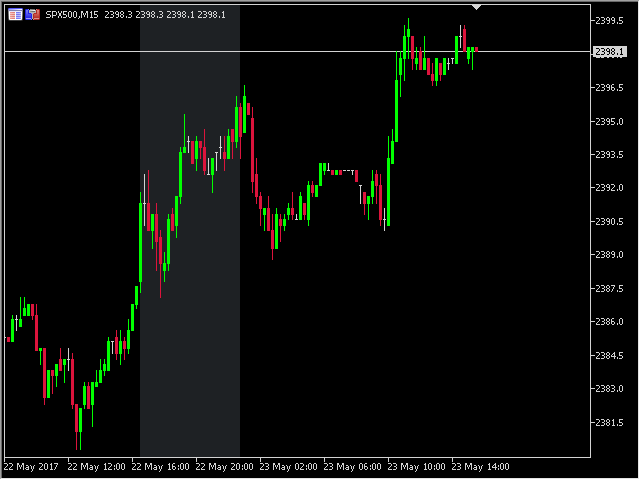
The Trading Sessions indicator is a simple tool that helps to highlight a specific trading session. For example, it can be used to differentiate the European, American or Asian sessions.
Main features
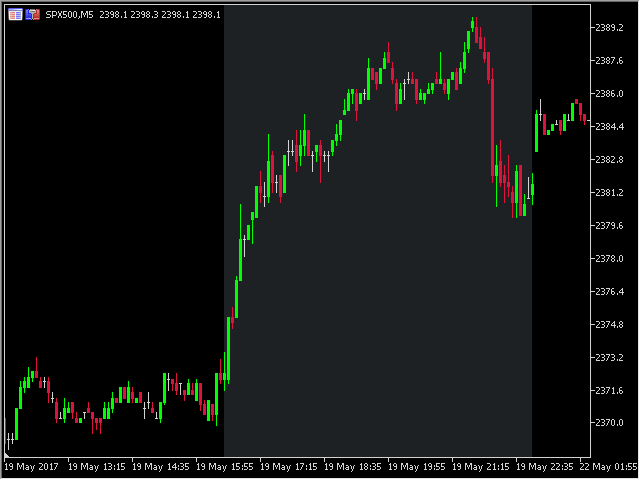
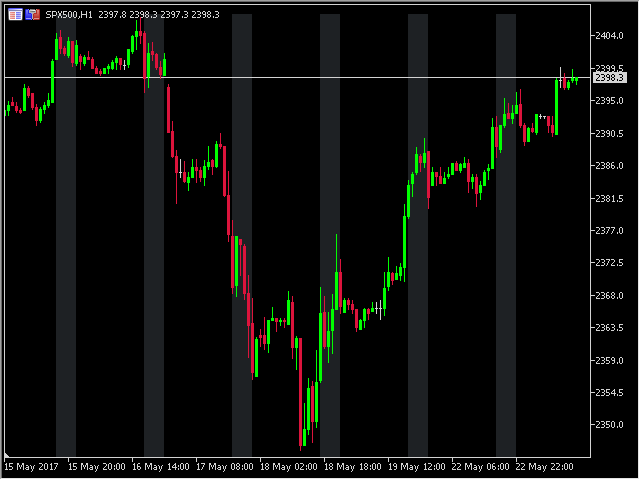
- The indicator shows a user-defined trading session.
- Alert notifications for the start and end of the session.
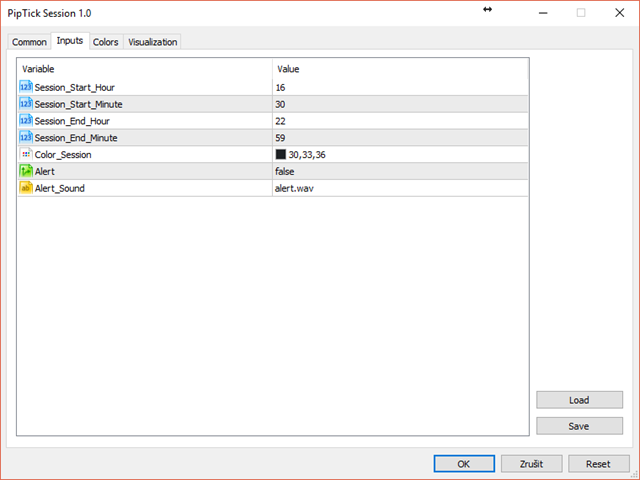
- Custom session time.
- Works on every timeframe (M1, M5, M15, M30, H1, H4, D1, W1, MN).
- Customizable parameters (Colors, alerts...).
- It can be used for creating EA.
- Available for MT4 and MT5.
Please visit the Trading Sessions indicator product page for the input and output parameters settings.


great work