Short term extremum
- インディケータ
- Gennadiy Stanilevych
- バージョン: 7.9
- アップデート済み: 16 9月 2024
- アクティベーション: 13
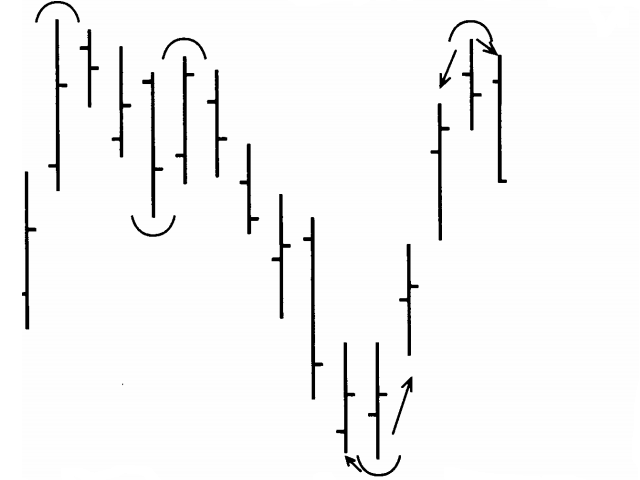
The indicator determines and marks the short-term lows and highs of the market on the chart according to Larry Williams` book "Long-term secrets to short-term trading".
"Any time there is a daily low with higher lows on both sides of it, that low will be a short-term low. We know this because a study of market action will show that prices descended in the low day, then failed to make a new low, and thus turned up, marking that ultimate low as a short-term point. A short-term market high is just the opposite. Here we will see a high with lower highs on both sides of it. What this says is that prices rallied up to the zenith of that middle day, then began to move back down, and in the process formed a short-term high. For our purposes in identifying short-term swing points, we will simply ignore inside days and the possible short-term points they produce."
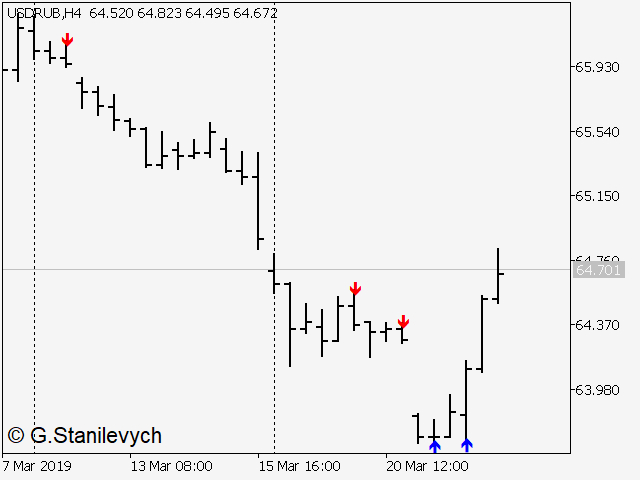
In case of appearance of the short-term high, the indicator displays the red "down" arrow above the level of central bar which creates a pivot point. The green "up" arrow appears below the pivot point level. The signal is considered to be formed after close of the last bar on the chart.
Larry Williams recommends to buy or sell an asset at the opening price of the next bar after signal formation. The stop-loss should be placed above (below) the local high (low).
Swing points signals are good filters and amplifiers for other trading strategies.
Parameters
- Draw uncompleted signals - true - enable drawing arrows on the chart, indicating the preliminary trade signals on incomplete bars. false - the preliminary trade signals are disabled on incomplete bars.
- MA period - period of the moving average for forming trade signals on local extremums
- MA Method - selection of the moving average type


good indicator