Range Bands
- インディケータ
- Cristian Eriksson
- バージョン: 1.3
- アップデート済み: 24 7月 2018
- アクティベーション: 10
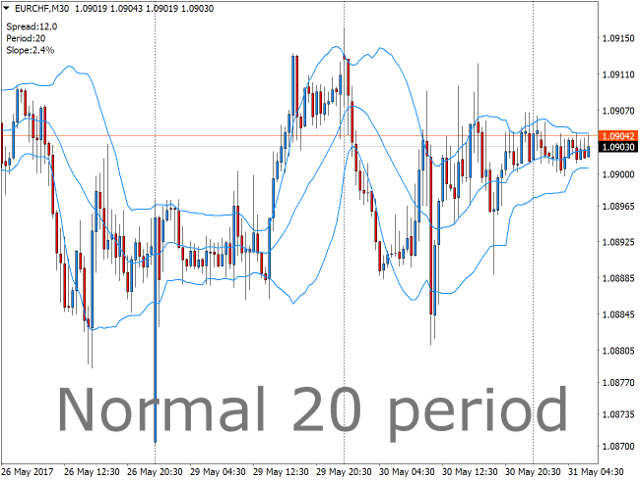
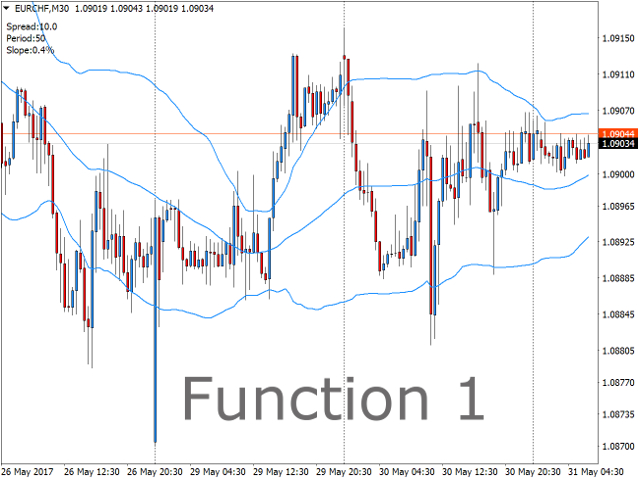
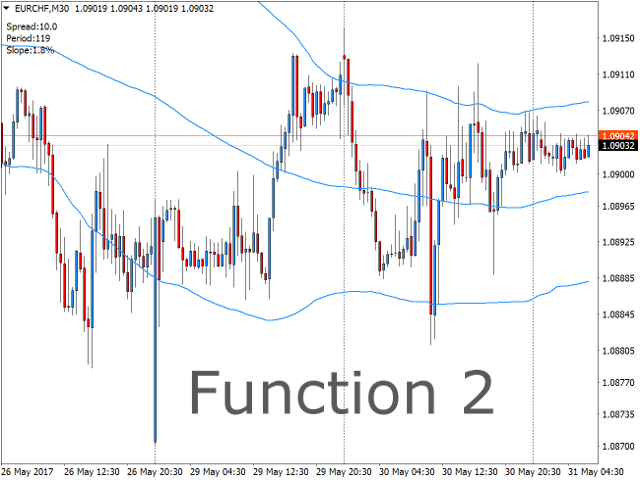
Range bands works the same way as Bollinger bands except that they are self adapting, with range trading in mind.
Unless you are familiar with Bollinger bands, it is a standard deviation indicator that is based around the concept that when price deviates to quickly from the average, it's going to encounter resistance. This is true for all period settings, since standard deviation 2 or 3 is an extreme on any data. This indicator automatically chooses the period that is currently most suitable for range trading or scalping (on smaller time frames).
If you use "Bollinger Bands" for trend trading, this is not the indicator for you, then it is better to stick with 20, 36 or 50.
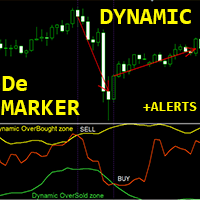
- The indicator comes with an alarm that sends a push notification on either close outside, close inside or both to the user.
In the notification comes information about what period is running and the slope of the mid band, so that the user can beforehand make a decision to open the trade or wait for the next signal.
- The indicator also comes with two different formulas for band optimization, both give very good calculations and most of the time they will agree, you can see which one you like best.
Remember that if you get an optimization that is higher than 100 periods on for example the 1-minute time frame, it means that 1 minute is not suitable for standard deviation range trading right now, but is in a trend, switch over to 5 minutes. If you look on 100 periods on the 1-minute time frame it is the same as 20 periods on the 5-minute time frame. It is therefore recommended to go over to the next time frame for better overview of what´s happening in the market.
Also remember that the band period is changing all the time, and therefore looking back on the history of the indicator will not give any information about it's performance. That can only be achieved by forward real or demo trading. And also performance will always be subject to traders decision.
Inputs
- Chose an algorithm for optimization - Choose what algorithm to adjust the band period with. 1-3 uses the same way of optimizing deviation, the deviation is therefore usually better set by the user on these.
- Bands period(0 for auto) - Define your own period or let the indicator do it for you.
- Bands standard deviation - Choose the standard deviation for the bands or put "0" to let it be optimized.
- Bands shift - Change the shift of the bands.
- Bands maximum period - Pick the max period that can be chosen by the optimizer.
- Bands minimum period - Pick the min period that can be chosen by the optimizer.
- Send a push notification on close outside - The first close outside after leaving inside will give a notification.
- Send a push notification on close inside - The first close inside after a close outside will give a notification.
- Wait for candle to close - No notification is sent before candle closes. If false, push is sent before candle closes.
- Filter by slope - Only send push-notification if slope is lower than a certain value.
- Max slope value - Set a slope value.
- Filter by bandwidth - Only send push if bandwidth is wider than this times ATR (period 100).
- Acceptable slope on band optimization - On function one, put a threshold for the optimizer to be satisfied. If slope is lower than this, it stops looking for new settings.
- Band cycles to check for touches - On function four. Lets you set how many band-period-cycles back to verify settings. One cycle is the length of the band-period currently being tested.
- Maximum % of closes to allow outside of bands - Maximum percentage of closes allowed outside bands to satisfy optimizer.
- Min total touches to accept new settings - Pick a minimum of times price needs to touch the bands in all cycles to satisfy optimizer. Every visit on each side is only counted once.
- Show comment - Show the comment field on the left hand side of the screen.

