Pennants and triangles scanner
- インディケータ
- Jan Flodin
- バージョン: 2.3
- アップデート済み: 13 1月 2025
- アクティベーション: 10
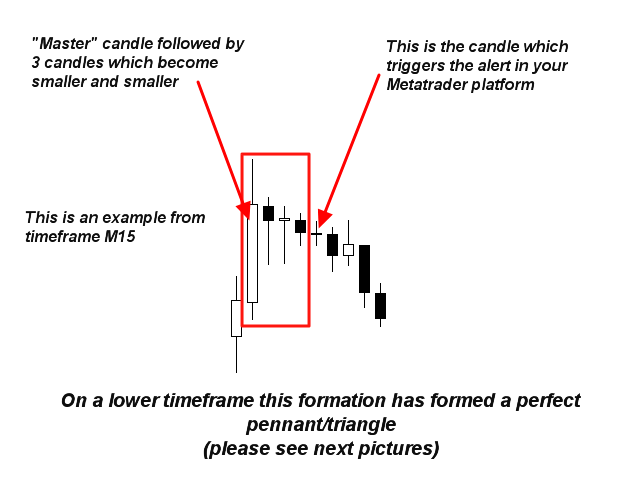
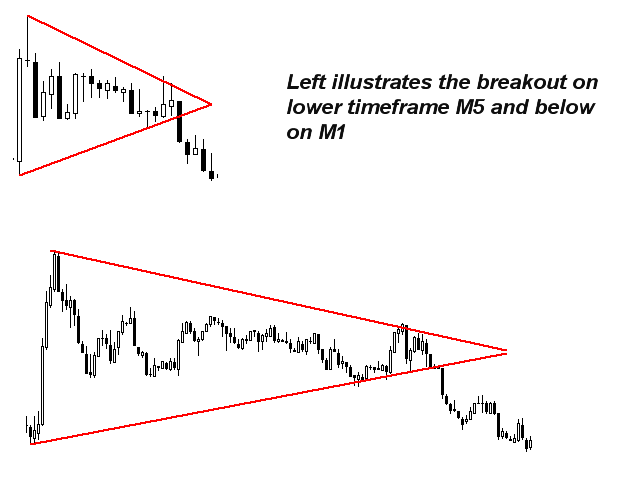
This multi time frame and multi symbol indicator identifies high-probability breakout patterns. It does this by identifying strong, symmetrical pennants and triangles. This pattern DOES NOT appear very often on higher time frames. But when it does, it is a very high-probability setup. The indicator also includes an Inside bars scanner. It can for example be used to detect a special type of Inside bars formation which is formed by a Master candle (MC) followed by 4 inside candles (please see the strategy explanation below). A separate indicator for this strategy can be found here. Combined with your own rules and techniques, this indicator will allow you to create (or enhance) your own powerful system.
Features
- Can monitor all symbols visible in your Market Watch window at the same time. Apply the indicator to just one chart and instantly monitor the entire market.
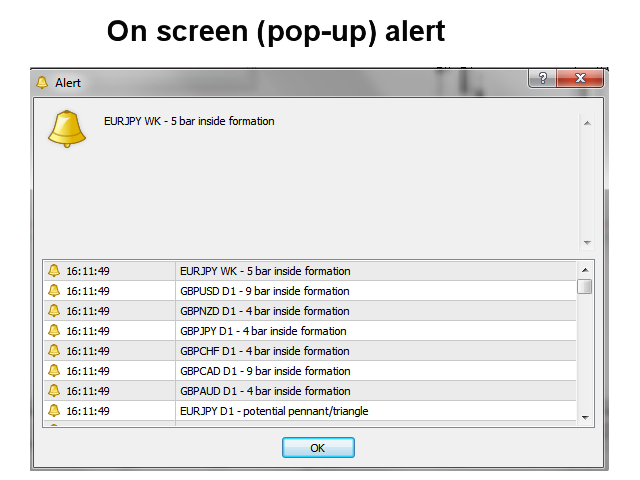
- Can monitor every time frame, from M1 to MN, and sends you a real-time alert when a pennant, triangle or inside bar formation is identified, or when a breakout from the formation has occured. All Metatrader native alert types are supported.
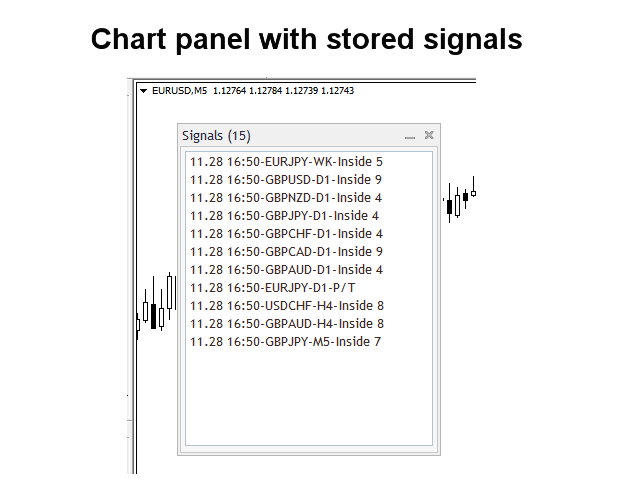
- The indicator includes an interactive panel. Please see screenshot #4 below.
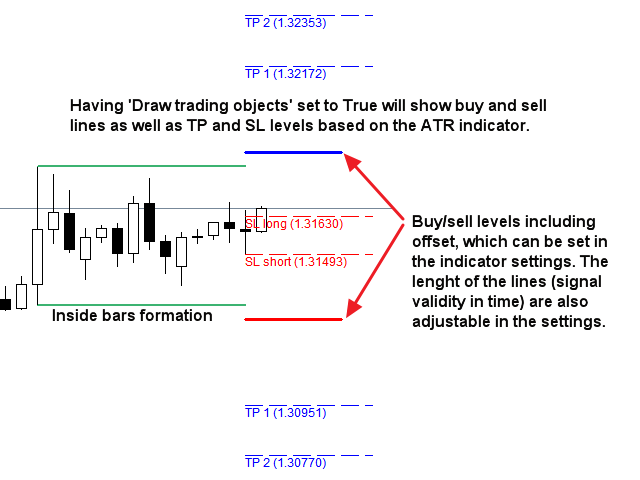
- Can be configured to show buy/sell lines and TP/SL lines (based on ATR multiplier). The lines will be shown on the chart which you open by clicking on a signal in the panel. Please see screenshot #5 below.
- The indicator can write the signals to a file or to global variables which can be used by an Expert Advisor for auto trading.
Input parameters
Please find the description and explanation of the input parameters here.
Important
Please note that due to the multifunctionality neither buy/sell advice nor lines and arrows will be drawn on the chart where the indicator is installed. They can be drawn on the chart which will be opened when clicking on a signal in the panel. It is highly advisable to put the indicator on a clean chart without any other indicators or Expert Advisors on it which could interfere with the scanner.
Master candle strategy
Master Candle (MC) is a trading strategy based on a candle formation where the first (master) candle is followed by 4 smaller candles which are inside the first candle. The whole formation is built of 5 candles, independent of if bearish or bullish.
Timeframes: H1 and H4 charts. Even if the MC strategy works best on H1 it can be traded on all timeframe and currency pairs. Mainly on H4, H1 and M30 charts.
Currency pairs: Trades best on volatile pairs such as GBPUSD and GBPJPY.
After breaking MC high/low a position will be taken in the direction of the break. It is recommended that the MC has a size of 40 to 100 pips (but it depends on the volatility of the currency pair in question). It is also recommended to put stop orders for instance 5 pips above and below the MC high/low.
Some traders also use the rule that a break in any direction should occur during the next 3 candles after the MC creation (5 th candle). Anyway, it is highly recommended to cancel any stop order if there is no break after 24 hours.
Finally it is for better results recommended to trade in the direction of the trend as well as to avoid trading at strong and important price levels - resistances and supports. It is also advisable not to trade MC which appears inside another MC.

















Wonderful scanner. Helps a lot