Harvester for creating own strategies
- インディケータ
- Ivan Frolov
- バージョン: 1.1
- アップデート済み: 6 6月 2017
- アクティベーション: 20
This is a complex indicator for developing custom trading strategies.
It can also sort out already existing strategies.
The initial objective of the indicator was to combine a couple of indicators. After combining 12 indicators, I realized I need to implement the ability to separate them as well as arrange the signals from the built-in indicators and systems.
The indicator provides signals as buffer arrows: 0 - buy, 1 - sell.
The contents of the complex indicator:
Indicators
Let me know if you want some other indicators.
- Force Index
- Parabolic SAR
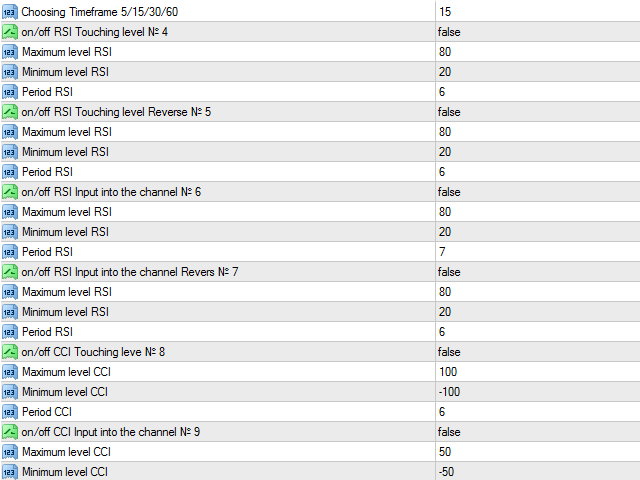
- Relative Strength Index (RSI)
- Commodity Channel Index (CCI)
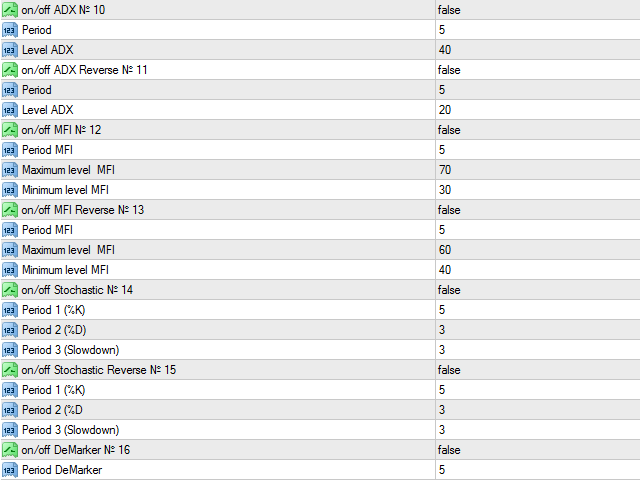
- Average Directional Index (ADX)
- Money Flow Index (MFI)
- Stochastic Oscillator
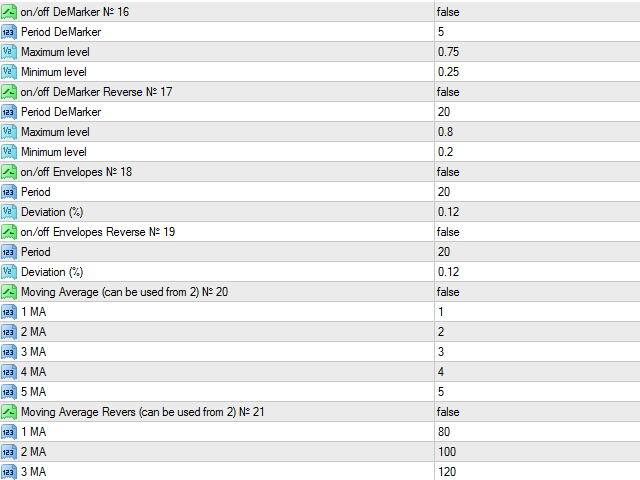
- DeMarker
- Envelopes
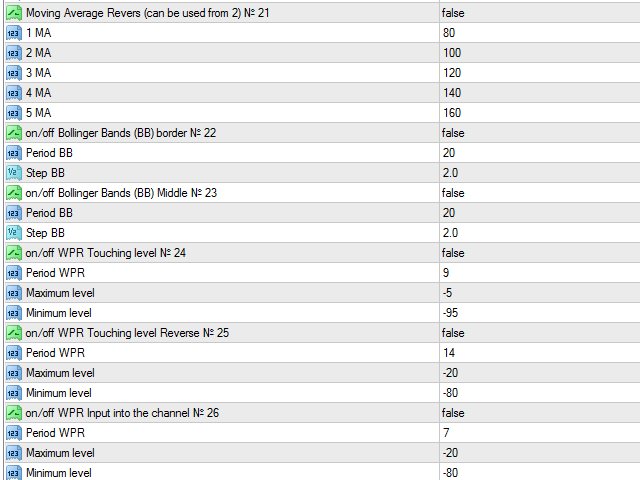
- Moving Average (MA)
- Bollinger Bands
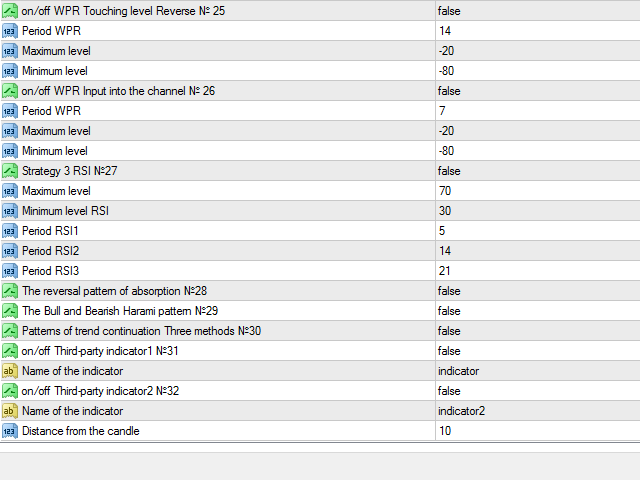
- Williams’ Percent Range (WPR)
Ready-made strategies and patterns
Let me know if you want some other ones.
- 3 RSI strategy
- Arrow down when all three RSI indicators are in an overbought area (maximum level)
- Arrow up when all RSIs are in an oversold area (minimum level)
- Engulfing reversal pattern
- Bullish and bearish harami
- "Three methods" trend continuation
Function for using up to two indicators simultaneously.
Key features
- You can use separate indicators or different combinations of them
- Levels of all indicators are configured separately
- Never repaints
- Accessible buffers for EA developers
- Works on every symbol and timeframe
- The distance between the arrow and the bar can be specified (distance to the candle)
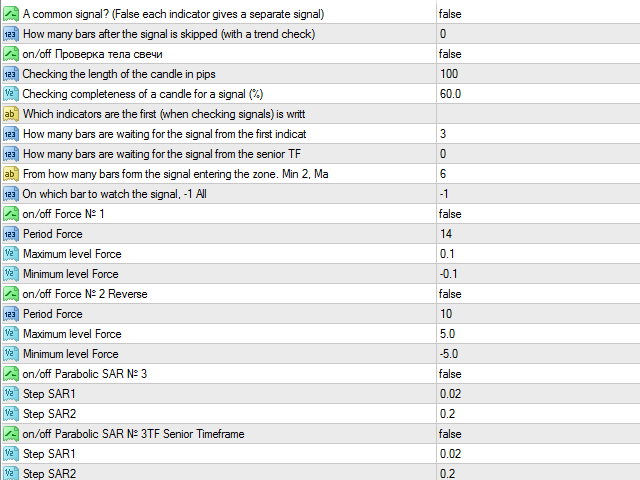
Main options
- A common signal? (False each indicator gives a separate signal) - if enabled, the signal tracks all selected indicators simultaneously. If disabled, each indicator provides its own signal.
- How many bars after the signal is skipped (with a trend check) - number of bars skipped after a signal (with a trend check). The option allows skipping bars after a signal, the indicator checks if subsequent bars have been closed in one direction.
- on/off Checking the body of a candle on/off - check the candle body. The option allows checking the candle body in pips and how completely the candle was closed from the maximum distance from Low to High.
- Which indicators are the first (when checking signals) is written No - use expectations of some indicators in relation to others. The index of the primary indicator is set in the settings at the end of each indicator.
- How many bars are waiting for the signal from the first indicators - how many bars should we wait for a signal from the first indicators (when checking signals).
- How many bars are waiting for the signal from the senior TF - how many bars should we wait for a signal from higher timeframes. The options works for on/off Parabolic SAR № 3TF Senior Timeframe for now.
- From how many bars form the signal entering the zone. Min 2, Max 6 - how many bars are needed to form an area entry zone (2-6).
- On which bar to watch the signal, -1 All - on which bar should we watch a signal (-1 - all).
The indicator is suitable both for binary options and Forex trading.
Leave your suggestions, and I will try to implement them in my indicators.