• 概要
  • レビュー
  • コメント

TradeLeader B3 Bovespa Scanner

You can change all assets to your Market or Forex. Just replace the assets in the groups above! No asset limits!

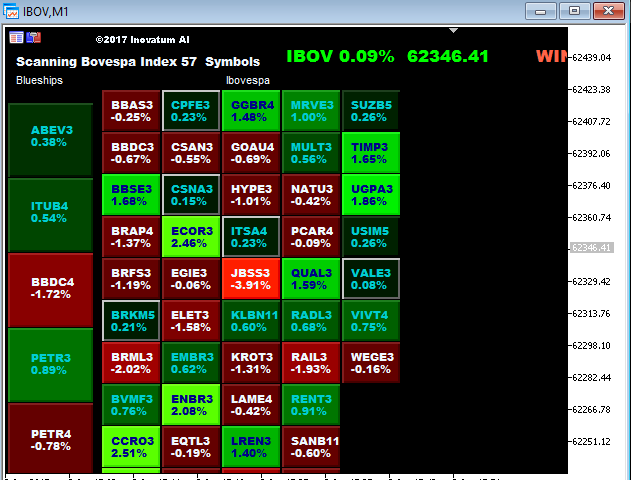
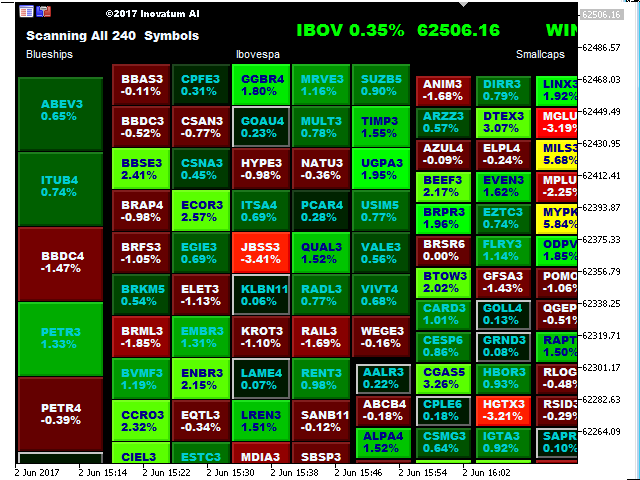
TradeLeader B3/Bovespa Scanner is an indicator that allows you to observe the entire market heat map in a single chart.

More images in high definition in https://www.mql5.com/pt/users/ougaske/blog

  • Track all the assets of the stock market separated by liquidity groups.
  • Customize the alert level for opportunities.
  • Display in real time the Ibovespa, minicontracts of Index and Dollar or any other instrument that you wish to highlight.
  • Click on the desired asset and a chart will open for better analysis and commercialization.

We use this panel daily, which allows us to observe trends and opportunities that the native Market Watch does not show.

It is very simple to use and automatically loads the necessary assets into your MetaTrader (of course, your broker must provide these quotes).

You can even customize the groups that will appear on the panel, even include Forex and international assets, indexes, etc that you wish.

As a convenience, the indicator already comes with all assets reported by B3/Bovespa this month (May/2017) in alphabetical order and in groups for liquidity.

However, you can modify them at will, and in the future change any portfolio/asset to your liking.

For example, compare the Ibovespa, S & P, DownJones, Dollar, etc. in the panel. Just have your brokerage give you quotes.
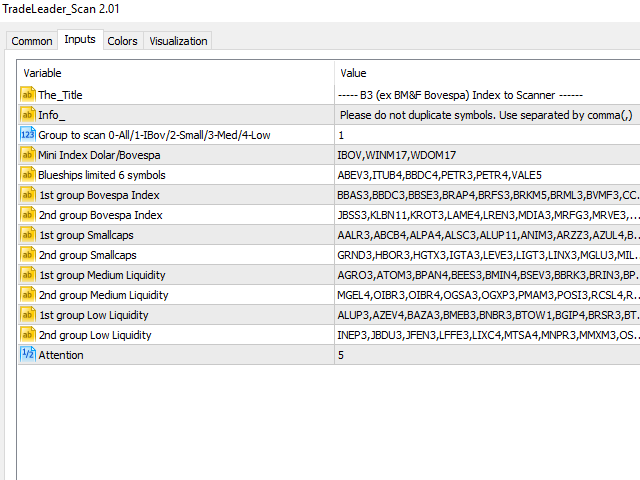

Main Parameters

  • Groups for scan: 0 - all assets / 1 - only the assets of the index Ibovespa / 2 - smallcaps / 3 - medium liquidity assets / 4 - assets with low liquidity.
  • Mini Index / Index: Choose up to three assets to highlight in the panel.
  • BlueShips (6 assets): Assets that move the Ibovespa index, but you can change them if you wish.
  • 1st Group assets Ibovespa: Assets that participate in the Ibovespa.
  • 2nd Group assets Ibovespa: Assets that participate in the Ibovespa.
  • 1st Group SmallCaps assets: Good liquid assets, but not participating in Ibovespa. They provide good deals.
  • 2nd group SmallCaps assets: Good liquid assets, but not participating in Ibovespa. They provide good deals.
  • 1st Group assets Average Liquidity: Medium liquidity assets, but not participating in Ibovespa. They provide good business.
  • 2nd Group assets Average Liquidity: Medium liquid assets, but not participating in Ibovespa. They provide good deals.
  • 1st Group assets Liquidity Low: Low liquidity assets. Provide good deals if analyzed in a judicious way, of course, with more risk.
  • 2nd Group assets Liquidity Low: Assets with low liquidity. Provide good deals if analyzed in a judicious way, of course, with more risk.
  • Attention: Percentage value you want to be alerted, in highlighted yellow, on the heat map.

Note:

  • If you want to include any assets, separate them by commas.
  • Do not duplicate assets. This will cause a black icon to appear on the screen as a doubling warning. Just access the product properties and remove the duplicate item.
  • By choosing to show all the assets, you understand that you must have RAM available for this. In our tests, the indicator consumed 200 MB (comparative, MetaTrader consumes 100 MB on average).
  • The first time the indicator will take a few minutes to load the history. It will depend on the time of how many assets you chose and your Internet.

Thank you for your interest! I am available for suggestions.

おすすめのプロダクト
Value Chart Candlesticks
Flavio Javier Jarabeck
4.7 (10)
The idea of a Value Chart indicator was presented in the very good book I read back in 2020 , " Dynamic Trading Indicators: Winning with Value Charts and Price Action Profile ", from the authors Mark Helweg and David Stendahl. The idea is simple and the result is pure genius: Present candlestick Price analysis in a detrended way! HOW TO READ THIS INDICATOR Look for Overbought and Oversold levels. Of course, you will need to test the settings a lot to find the "correct" one for your approach.
FREE
FRB Trader - Our mission is to provide the best support to customers through conted and tools so that they can achieve the expected results FRB Support and Resistance - Indicator places lines on the chart to show Support and Resistance regions. - You can choose the timeframe you want to calculate, as well as the colors of the lines. - Algorithm calculates the points where the strengths of the asset are considered and are extremely important for decision making.
FREE
This is a demo version of a non-trading expert , which utilizes so called the custom symbols feature ( available in MQL as well ) to build renko charts based on historical quotes of selected standard symbol and to refresh renko in real-time according to new ticks. Also it translates real ticks to the renko charts, which allows other EAs and indicators to trade and analyze renko. Place the EA on a chart of a working instrument. The lesser timeframe of the source chart is, the more precise resulti
FREE
Free automatic Fibonacci is an indicator that automatically plots a Fibonacci retracement based on the number of bars you select on the BarsToScan setting in the indicator. The Fibonacci is automatically updated in real time as new highest and lowest values appears amongst the selected bars. You can select which level values to be displayed in the indicator settings. You can also select the color of the levels thus enabling the trader to be able to attach the indicator several times with differe
FREE
Donchian Pro
Paulo Henrique Faquineli Garcia
5 (2)
The Donchian Channel Channels are among the most popular tools of technical analysis, as they visually convey to the analyst the limits within which most price movement tends to occur. Channel users know that valuable information can be obtained at any time, whether prices are in the central region of a band or close to one of the border lines. One of the best known techniques to explore these concepts is Bollinger Bands. However, John Bollinger was not the only one to research the applicatio
FREE
Weis Waves
Flavio Javier Jarabeck
3.15 (26)
The original author is David Weis, an expert in the Wyckoff Method. The Weis Wave is a modern adaptation of the 1930's Wyckoff Method, another expert in Tape Reading techniques and Chart Analysis. Weis Waves takes market volume and stacks it into waves according to price conditions giving the trader valuable insights about the market conditions. If you want to learn more about this subject you can find tons of videos in YouTube. Just look for "The Wickoff Method", "Weis Wave" and "Volume Spread
FREE
QuantumAlert RSI Navigator is a free indicator available for MT4/MT5 platforms, its work is to provide "alerts" when the market is inside "overbought and oversold" regions in the form of "buy or sell" signals. This indicator comes with many customization options mentioned in the parameter section below, user can customise these parameters as needful. Join our MQL5 group , where we share important news and updates. You are also welcome to join our private channel as well, contact me for the priva
FREE
Introduction This indicator detects volume spread patterns for buy and sell opportunity. The patterns include demand and supply patterns. You might use each pattern for trading. However, these patterns are best used to detect the demand zone (=accumulation area) and supply zone (=distribution area). Demand pattern indicates generally potential buying opportunity. Supply pattern indicates generally potential selling opportunity. These are the underlying patterns rather than direct price action. T
FREE
Combining the best of Price Action , Directional Movement , and Divergence/Convergence analysis, Candle Color Trend is a easy and reliable way to identify trend direction. The indicator automatically paints the candles according to the assumption that an uptrend is defined by prices that form a series of higher highs and higher lows. In contrast, a downtrend is defined by prices that form a series of lower highs and lower lows. Additionally, ADX Wilder indicator is used to measure trend weakness
FREE
Follow The Line MT5
Oliver Gideon Amofa Appiah
4.42 (31)
This indicator obeys the popular maxim that: "THE TREND IS YOUR FRIEND" It paints a GREEN line for BUY and also paints a RED line for SELL. (you can change the colors). It gives alarms and alerts of all kinds. IT DOES NOT REPAINT and can be used for all currency pairs and timeframes. Yes, as easy and simple as that. Even a newbie can use it to make great and reliable trades. NB: For best results, get my other premium indicators for more powerful and reliable signals. Get them here: https://www.m
FREE
Waves Sizer
Flavio Javier Jarabeck
3.67 (6)
Wyckoff fans, enjoy! Ideally to be used with the Weis Waves indicator, but it can be easily used alone, the Waves Sizer puts the range (in resulting Price movement) done by the Price on its market swings. You can control how accurate or loose will be the swings. This tool is very helpful for visually know how much the Price has traveled in your Timeframe. This way you can confront this level of effort with the resulting Volume, etc... Weis Waves indicator: https://www.mql5.com/en/market/pro
FREE
Market Profile 3 ForexArby com
Hussien Abdeltwab Hussien Ryad
3.92 (13)
Market Profile 3 MetaTrader 5 indicator  version 4.70— is a classic Market Profile implementation that can show the price density over time, outlining the most important price levels, value area, and control value of a given trading session. This indicator can be attached to timeframes between M1 and D1 and will show the Market Profile for daily, weekly, monthly, or even intraday sessions. Lower timeframes offer higher precision. Higher timeframes are recommended for better visibility. It is als
FREE
Spike Catch Pro 22:03 release updates Advanced engine for searching trade entries in all Boom and Crash pairs (300,500 and 1000) Programmed strategies improvements Mx_Spikes (to combine Mxd,Mxc and Mxe), Tx_Spikes,   RegularSpikes,   Litho_System,   Dx_System,   Md_System,   MaCross,   Omx_Entry(OP),  Atx1_Spikes(OP),   Oxc_Retracement (AT),M_PullBack(AT) we have added an arrow on strategy identification, this will help also in the visual manual backtesting of the included strategies and see h
FREE
Are you tired of drawing trendlines every time you're analyzing charts? Or perhaps you would like more consistency in your technical analysis. Then this is for you. This indicator will draw trend lines automatically when dropped on a chart. How it works Works similar to standard deviation channel found on mt4 and mt5. It has 2 parameters: 1. Starting Bar 2. Number of bars for calculation The   starting bar   is the bar which drawing of the trend lines will begin, while the   number of bars for c
FREE
トレンドキャッチャー: アラートインジケーター付きのトレンドキャッチャーストラテジーは、市場トレンドやポテンシャルなエントリーポイントやエグジットポイントを特定するのに役立つ多目的な技術分析ツールです。動的なトレンドキャッチャーストラテジーを備えており、市場状況に適応してトレンドの方向を明確に視覚化します。トレーダーは、自身の好みやリスク許容度に合わせてパラメーターをカスタマイズできます。このインジケーターはトレンドの識別を支援し、ポテンシャルなリバーサルをシグナルし、トレイリングストップのメカニズムとして機能し、市場への迅速な対応のためのリアルタイムアラートを提供します。 特徴: - トレンドの識別:上昇トレンドと下降トレンドをシグナルします。 - トレンドのリバーサル:ローソク足の色が上昇から下降に変わった場合やその逆の場合に、ポテンシャルなリバーサルを警告します。 - リアルタイムアラート:新しいトレンドの識別に対するアラートを生成します。 推奨事項: - 通貨ペア:EURUSD、AUDUSD、XAUUSDなど... - タイムフレーム:H1。 - アカウン
FREE
Was: $69  Now: $34   Blahtech VWAP - Volume Weighted Average Price (VWAP) is the ratio of price to total volume. It provides an average price over a specified time interval.  Links [  Install  |  Update  |  Documentation   ] Feature Highlights Configurable VWAP Line Sessions, intervals, anchored or continuous Previous day settlement line Standard Deviation bands Alerts at bar close or real time Automatic Broker or Tick volumes Significantly reduced CPU usage Input Parameters Expert Advisor
インディケータは現在のクオートを作成し、これを過去のものと比較して、これに基づいて価格変動予測を行います。インジケータには、目的の日付にすばやく移動するためのテキスト フィールドがあります。 オプション: シンボル - インジケーターが表示するシンボルの選択; SymbolPeriod - 指標がデータを取る期間の選択; IndicatorColor - インジケータの色; HorisontalShift - 指定されたバー数だけインディケータによって描画されたクオートのシフト; Inverse - true は引用符を逆にします。false - 元のビュー。 ChartVerticalShiftStep - チャートを垂直方向にシフトします (キーボードの上下矢印)。 次は日付を入力できるテキストフィールドの設定で、「Enter」を押すとすぐにジャンプできます。
WAPV Box Effort x Result
Eduardo Da Costa Custodio Santos
MT5のWA_PV_BOX_EFFORTXRESULT WAPV Box Effort x Result Indicatorは、Package Indicatorsグループ(Wyckoff Academy Wave Market)の一部です。 MT5のWAPVボックスエフォートx結果インジケーターは、価格とボリュームを読み取るのに役立ちます。その読みは、努力×結果の特定を支援することで構成されています グラフによって作成された波で。 ボックスが緑色の場合のMT5のWAPVボックスの労力x結果インジケーターは、ボリュームが需要に有利であり、ボックスが赤色の場合を意味します ボリュームは供給に有利です。 ボックスが大きいほど、価格に対するボリュームの変位が大きくなります。価格の上昇波がボックスのサイズに比例しない場合、 努力×結果。 非常に視覚的な方法で、ボリュームと価格の間のこの相違を識別できます。 MT5のWAPVBoxEffort x Result Indicatorを使用すると、インジケーターをゼロ軸の下に配置することで、視覚化を向上させることもできます。 ティックボリュームとリア
This is Gekko's Cutomized Cutomized Average Directional Index (ADX), a customized version of the famous ADX indicator. Use the regular ADX and take advantage two entry signals calculations and different ways of being alerted whenever there is potential entry or exit point. Inputs Period: Period for the ADX calculation; PlotSignalType: How will the indicator calculate entry (swing) signals: 1- ShowSwingsOnTrendLevel : Show Signals for Trend Confirmation Swings; 2- ShowSwingsOnTrendLevelDirectio
HLC bar MT5 Wyckoff
Eduardo Da Costa Custodio Santos
MT5のインジケーター「HLC_bar_MT5Wyckoff」は、取引時の分析を容易にするために作成されました。 HLCバーはRichardWyckoffによって使用され、現在「VSA」操作で広く使用されています。 Wyckoffは、High、Low、およびCloseを使用すると、グラフがはるかにクリーンになり、分析が容易になることを発見しました。 区分 "HLC_bar_MT5 Wyckoff"により、以下が可能になります。 #バーの幅を変更します。 #バーを同じ色のままにします。 #そして、同じ価格で開閉したバーを強調表示します。 色と幅は設定で簡単に変更できます インジケーターを使用するには、インジケーターをチャートにドラッグするだけです。
OrderBook Utilities is a script, which performs several service operations on order book hob-files, created by OrderBook Recorder . The script processes a file for work symbol of the current chart. The file date is selected by means of the input parameter CustomDate (if it's filled in) or by the point where the script is dropped on the chart. Depending from the operation, useful information is written into the log, and optionally new file is created. The operation is selected by the input parame
FREE
Volume Waves
Paulo Henrique Faquineli Garcia
One of the best tools for analyzing volume, Weis Wave was devised by David Weis to facilitate reading the directional flow. For the disciples of the Wyckoff method, this means an evolution, facilitating a predictive reading of the market, always looking for Accumulation and Distribution zones for traded assets. For better understanding, in this indicator we try to cover every reading of EFFORT (traded volume) versus RESULT (price change). Thus, you can apply the indicator on the chart twice
Hello friends. I wrote this utility specifically for use in my profile with a large number of Expert Advisors and sets ("Joint_profiles_from_grid_sets"   https://www.mql5.com/en/blogs/post/747929 ). Now, in order to limit losses on the account, there is no need to change the "Close_positions_at_percentage_of_loss" parameter on each chart. Just open   one   additional chart, attach this utility and set the desired percentage for closing all trades on the account. The utility has the following fu
FREE
The Penta-O is a 6-point retracement harmonacci pattern which usually precedes big market movements. Penta-O patterns can expand and repaint quite a bit. To make things easier this indicator implements a twist: it waits for a donchian breakout in the right direction before signaling the trade. The end result is an otherwise repainting indicator with a very reliable trading signal. The donchian breakout period is entered as an input. [ Installation Guide | Update Guide | Troubleshooting | FAQ | A
Order Book, known also as Market Book, market depth, Level 2, - is a dynamically updated table with current volumes of orders to buy and to sell specific financial instument at price levels near Bid and Ask. MetaTrader 5 provides the means for receiving market book from your broker, but in real time only, without access to its history. The indicator OrderBook Cumulative Indicator accumulates market book data online and visualizes them on the chart. In addition, the indicator can show the market
This indicator calculates the volume profile and places labels that correspond to the VAH, VAL and POC levels, for each candle individually. Indicator operation features The indicator works on the timeframes from M3 to MN, but it uses the history data of smaller periods: M1 - for periods from M3 to H1, M5 - for periods from H2 to H12, M30 - for the D1 period, H4 - for the W1 period, D1 - for the MN period. The color and location of the VAL, VAH and POC labels on the current candle are consider
FREE
COSMOS4U Volume MT5
COSMOS4U - D. Vezeris & Co, L.P.
1 (1)
COSMOS4U Volume indicator facilitates your trade decisions. It gives confirmation of the running movement and market trends. It highlights current and past accumulation and distribution volumes, comparing them to moving average volume and the highest volume. In addition, it identifies and marks nuances as well as convergence and divergence patterns of bears and bulls in order to provide the market trend and price ranges. The supported features are as follows: Fast Volume Moving Average Slow Volu
FREE
A countdown timer for the  Volume bar chart generator  and  Tick chart generator  products, which are available for download from the MQL5 Market: Tick chart generator: https://www.mql5.com/en/market/product/29215 Volume bar chart generator: https://www.mql5.com/en/market/product/47197 The counter conveniently displays the number of ticks or transactions (depending on the chart) that need to pass for a new bar to start printing. The user can set the following indicator inputs. Volume type
FREE
The indicator analyzes the volume scale and splits it into two components - seller volumes and buyer volumes, and also calculates the delta and cumulative delta. The indicator does not flicker or redraw, its calculation and plotting are performed fairly quickly, while using the data from the smaller (relative to the current) periods. The indicator operation modes can be switched using the Mode input variable: Buy - display only the buyer volumes. Sell - display only the seller volumes. BuySell -
FREE
Donchian Channel DC is the indicator of Donchian Channels, that plots maximum and minimum values of a specific period, besides mean value line. It´s possible to configure simple period for analysis and the indicator will plot all three values. You can trade with this indicator as trend or reversal, according to each strategy. Do not let to test others indicators as soon as others expert advisors.
このプロダクトを購入した人は以下も購入しています
Trade Assistant MT5
Evgeniy Kravchenko
4.39 (174)
取引 ごとのリスクの 計算、新規注文 の 簡単 な 設置、部分的 な 決済機能 を 持 つ 注文管理、 7 種類 のトレーリングストップなど 、便利 な 機能 を 備 えています 。 注意、アプリケーションはストラテジーテスターでは機能しません。 説明ページからデモ版をダウンロードできます  Manual, Description, Download demo ライン機能 チャート上にオープニングライン、ストップロス、テイクプロフィットを表示します。この機能により、新規注文を簡単に設定することができ、注文を出す前にその特徴を確認することができます。   リスク計算 リスク計算機能は、設定されたリスクとストップロス注文のサイズを考慮して、新規注文のボリュームを計算します。ストップロスの大きさを自由に設定できると同時に、設定したリスクを守ることができます。 Lot calc ボタン - リスク 計算 を 有効 / 無効 にします 。 Risk フィールドでは 、必要 なリスクの 値 を 0 から 100 までのパーセンテージまたは 預金通貨 で 設定 します 。 設定」 タブで 、
価格が一瞬で変わる可能性のある市場では、注文はできるだけ簡単にすべきだと思いますか? Metatraderでは、注文を開くたびに、開始価格を入力し、損失を止めて利益を得るウィンドウと、取引サイズを開く必要があります。金融市場の取引では、初期預金を維持し、それを増やすために資本管理が不可欠です。それで、あなたが注文をしたいとき、あなたはおそらくあなたがどれくらいの大きさの取引を開くべきか疑問に思いますか?この単一の取引であなたの預金の何パーセントを危険にさらすべきですか?この取引からどれだけの利益を得ることができますか?また、リスクに対する利益の比率はどのくらいですか?トレードサイズを設定する前に、トレードサイズがどうあるべきかという質問に対する答えを得るために必要な計算を行います。 これらすべてを自動的に行うツールがあると想像してみてください。チャートを開き、市場分析を行い、エントリーポイント、ディフェンスポイント(ストップロス)、ターゲット(テイクプロフィット)を水平線でマークし、最後にリスクのレベルを定義します。利用可能な資本の%として、このトランザクションで負担することができ、こ
TradePanel MT5
Alfiya Fazylova
4.86 (120)
Trade Panel は、多機能の取引アシスタントです。 このアプリケーションには手動取引用の 50 以上の機能が含まれており、ほとんどの取引アクションを自動化できます。 購入する前に、デモ アカウントでデモ バージョンをテストできます。 デモは こちら から。 詳しい手順は こちら をご覧ください。 取引。 ワンクリックで基本的な取引操作を実行できます。 未決の注文とポジションをオープンする 注文のグリッドを開く 未決の注文とポジションを決済する ポジションの反転(買いを閉じて売りをオープンする、または売りを閉じて買いをオープンする) ポジションをロックする(反対のポジションをオープンすることで、売りポジションと買いポジションの量を等しくします) すべてのポジションを部分的に決済します。 すべてのポジションのテイクプロフィットやストップロスを共通のレベルに設定します。 すべてのポジションのストップロスを損益分岐点レベルに設定します。 注文とポジションをオープンする際に、次のことが可能になります。 確立されたリスクに応じて取引量の自動計算を使用します。 ワンクリックで複数の注文を開き
Local Trade Copier EA MT5
Juvenille Emperor Limited
4.99 (68)
Local Trade Copier EA MT5 による、驚くほど高速な取引コピーを体験してください。1分で簡単にセットアップできるこの取引コピー機は、同じWindowsコンピュータまたはWindows VPS上の複数のMetaTrader端末間で取引をコピーすることができ、0.5秒未満の高速コピースピードを実現します。 初心者であろうとプロのトレーダーであろうと、 Local Trade Copier EA MT5 には、あなたの特定のニーズに合わせてカスタマイズするための幅広いオプションが用意されています。これは、利益の可能性を高めたい人にとって究極のソリューションです。 今すぐ試してみて、これが市場で最も速くて簡単なトレードコピー機である理由を理解してください。 ヒント: デモアカウントで Local Trade Copier EA MT5 デモバージョンをダウンロードして試すことができます: ここ ダウンロードした無料のデモ ファイルを MT5 >> ファイル >> データ フォルダを開く >> MQL5 >> Experts フォルダに貼り付けて、ターミナルを再起動し
The product will copy all telegram signal to MT5 ( which you are member) , also it can work as remote copier.  Easy to set up, copy order instant, can work with almost signal formats, image signal,  s upport to translate other language to English Work with all type of channel or group, even channel have "Restrict Saving Content", work with  multi channel, multi MT5 Work as remote copier: with signal have ticket number, it will copy exactly via ticket number. Support to backtest signal. How to s
Tired of complex order placement and manual calculations? Trade Dashboard is your solution. With its user-friendly interface, placing orders becomes effortless, by a single click, you can open trades, set stop loss and take profit levels, manage trade lot size, and calculate risk to reward ratios, allowing you to only focus on your strategy. Say goodbye to manual calculations and streamline your trading experience with Trade Dashboard. Download  Demo Version  right now. You can find  Details
MT5 to Telegram Signal Provider は、Telegramのチャット、チャンネル、またはグループに 指定された シグナルを送信することができる、完全にカスタマイズ可能な簡単なユーティリティです。これにより、あなたのアカウントは シグナルプロバイダー になります。 競合する製品とは異なり、DLLのインポートは使用していません。 [ デモ ] [ マニュアル ] [ MT4版 ] [ Discord版 ] [ Telegramチャンネル ] セットアップ ステップバイステップの ユーザーガイド が利用可能です。 Telegram APIの知識は必要ありません。必要な全ては開発者から提供されます。 主な特長 購読者に送信する注文の詳細をカスタマイズする機能 例えば、Bronze、Silver、Goldといった階層型のサブスクリプションモデルを作成できます。Goldサブスクリプションでは、すべてのシグナルが提供されます。 id、シンボル、またはコメントによって注文をフィルターできます 注文が実行されたチャートのスクリーンショットが含まれます 追加の
Trade Manager は、リスクを自動的に計算しながら、取引を迅速に開始および終了するのに役立ちます。 過剰取引、復讐取引、感情的な取引を防止する機能が含まれています。 取引は自動的に管理され、アカウントのパフォーマンス指標はグラフで視覚化できます。 これらの機能により、このパネルはすべてのマニュアル トレーダーにとって理想的なものとなり、MetaTrader 5 プラットフォームの強化に役立ちます。多言語サポート。 MT4バージョン  |  ユーザーガイド + デモ Trade Manager はストラテジー テスターでは機能しません。 デモについてはユーザーガイドをご覧ください。 危機管理 % または $ に基づくリスクの自動調整 固定ロットサイズを使用するか、ボリュームとピップに基づいた自動ロットサイズ計算を使用するオプション RR、Pips、または価格を使用した損益分岐点ストップロス設定トレーリングストップロス設定 目標に達したときにすべての取引を自動的に終了するための 1 日あたりの最大損失 (%)。 過度のドローダウンからアカウントを保護し、オーバートレードを防ぎます
Exp COPYLOT CLIENT for MT5
Vladislav Andruschenko
4.04 (23)
MT5のトレードコピー機は、МetaТrader5プラットフォームのトレードコピー機です 。 それは間の 外国為替取引をコピーします   任意のは 、MT5 - MT5、MT4 - MT5   COPYLOT MT5版の アカウント (またはを MT4 - MT4   MT5 - MT4   COPYLOT MT4版用) 信頼できるコピー機! MT4のバージョン 完全な説明   +DEMO +PDF 購入する方法 インストールする方法     ログファイルの取得方法     テストと最適化の方法     Expforex のすべての製品 МТ4ターミナルでトレードをコピーすることもできます(   МТ4   -   МТ4、МТ5   -   МТ4   ):   MT4のCOPYLOT CLIENT このバージョンには、端末間 МТ5   -   МТ5、МТ4   -   МТ5が含まれ ます。 ディールコピー機は、2/3/10端末間でディール/ポジションをコピーするために作成されます。 デモ口座と投資口座からのコピーがサポートされています。 プログラムは、複数の端末
-25% discount ($149 -> $111) Everything for chart Technical Analysis indicator mt5 in one tool Draw your supply demand zone with rectangle and support resistance with trendline and get alerts to mobile phone or email alert -  Risk reward indicator mt5 Video tutorials, manuals, DEMO download   here .   Find contacts on my   profile . 1.   Extended rectangles and trendlines Object will be extended to the right edge of the chart when price will draw new candles on chart. This is rectangle extend
Set price targets, and leave everything else to HINN Lazy Trader! This tool is designed for automatic position sizing from specified levels to designated targets. Using a VPS is recommended (*). The demo version   limited in functionality, be sure to watch this video before using -->  https://youtu.be/2NE8COr9-Bk  and this -->  https://youtu.be/Yv9gid3bMxE A community for users, product discussion, update news, and first line of support are organized in a free Discord: https://discord.gg/zFhEZc
あなたがメンバーである任意のチャネルから(プライベートおよび制限されたものを含む)シグナルを直接あなたのMT5にコピーします。  このツールは、トレードを管理し監視するために必要な多くの機能を提供しながら、ユーザーを考慮して設計されています。 この製品は使いやすく、視覚的に魅力的なグラフィカルインターフェースで提供されています。設定をカスタマイズして、数分で製品を使用を開始できます! ユーザーガイド + デモ  | MT4版 | Discord版 デモを試してみたい場合は、ユーザーガイドにアクセスしてください。 Telegram To MT5 受信機は、ストラテジーテスターで動作しません! Telegram To MT5の特徴 複数のチャネルから一度にシグナルをコピー プライベートおよび制限されたチャネルからシグナルをコピー BotトークンまたはChat IDは必要ありません   (必要に応じて使用することができます) リスク%または固定ロットを使用して取引 特定のシンボルを除外 すべてのシグナルをコピーするか、コピーするシグナルをカスタマイズするかを選択 すべてのシグナ
ワンクリックで取引できるトレーディングパネル。ポジションと注文の操作!チャートまたはキーボードから取引。 当社の取引パネルを使用すると、チャートから直接シングルクリックで取引を実行でき、標準の MetaTrader コントロールよりも 30 倍高速に取引操作を実行できます。 パラメータと関数の自動計算により、トレーダーにとって取引がより速く、より便利になります。 グラフィックのヒント、情報ラベル、取引取引に関する完全な情報はチャート MetaTrader にあります。 MT4のバージョン 完全な説明   +DEMO +PDF 購入する方法 インストールする方法     ログファイルの取得方法     テストと最適化の方法     Expforex のすべての製品 手動取引用の取引パネル。チャート(チャートウィンドウ)またはキーボードから取引できます。  開閉、リバース、ロックポジションと注文を処理する МetaТrader5 のメインオーダーのトレーディングコントロールパネル:売買、売却、売却、売却、売却、閉じる、削除、修正、トレーリングストップ、ストップロス、takep
Trade copier MT5
Alfiya Fazylova
4.3 (30)
Trade Copierは、取引口座間の取引をコピーして同期するように設計された専門的なユーティリティです。 コピーは、同じコンピューターまたはvps にインストールされている、サプライヤーのアカウント/端末から受信者のアカウント/端末に行われます。 購入する前に、デモ アカウントでデモ バージョンをテストできます。 デモ版 こちら 。 詳細な説明は こちら 。 主な機能と利点: MT5ネッティングアカウントを含む、MT5> MT5、MT4> MT5、MT5> MT4のコピーをサポートします。 高いコピー速度(0.5秒未満)。 ベンダーモードと受信者モードは同じ製品内に実装されています。 チャートから直接リアルタイムでコピーを制御できる、簡単で直感的なインターフェイス。 接続が切断されたり、端末が再起動されたりしても、設定と位置が失われることはありません。 コピーするシンボルを選択できます。また、受信者のシンボルを置き換えることもできます(例:EURUSD> USDJPY)。 バックコピーをサポートします。 特定の注文のみのコピーを有効にする機能。 取引開始価格の最大差と最大遅延時間を
DrawDown Limiter
Haidar, Lionel Haj Ali
5 (18)
Drawdown Limiter EA You are in the right place if you were searching for Drawdown control, Drawdown limiter, Balance protection, Equity Protection or Daily Drawdown Limit related to Prop Firm, FTMO, or Funded account trading, or if you want to protect your trading account. Have you suffered from controlling your drawdown when trading funded accounts? This EA is meant for you. Prop firms usually set a rule called “Trader Daily Drawdown”, and if it is not respected, you are disqualified.  I am an
The product will copy all  Discord  signal   to MT5   ( which you are member  ) , also it can work as remote copier.  Easy to set up. Work with almost signal formats, support to translate other language to English Work with multi channel, multi MT5. Work with Image signal. Copy order instant, auto detect symbol. Work as remote copier: with signal have ticket number, it will copy exactly via ticket number. How to setup and guide: Let read all details about setup and download Discord To MetaTrade
Trade Assistant 38 in 1
Makarii Gubaydullin
4.88 (17)
多機能ツール 搭載機能: ロット計算機、プライスアクション、リスク/リワードレシオ、トレードマネージャー、需要供給ゾーンなどをはじめ65以上の機能。 バージョ:デモ版   |   ユーザーマニュアル   |    MT5版 このユーティリティはストラテジー テスターでは機能しません。 ここからデモ   バージョンをダウンロードして製品をテストできます。 ご不明な点や改善提案、バグの発見などございましたら、 連絡してください 。 取引プロセスを簡素化、高速化、自動化します。このダッシュボードで標準端末機能を拡張します 1. 新しい取引を開始します : ロット / リスク / RR の計算 1. Lot計算機(リスクサイズに基づく取引量計算 2. リスク計算機(ロットサイズに基づくリスク量) 3. リスク/リワードレシオ (R/R) 4. 注文のアクティベーション トリガー + Buy StopLimit / Sell StopLimit 5. 仮想 SL / TP レベル (隠しSL、TP: ブローカーには見えない) 6.  Smart SL / エントリー レベル: バ
The most advanced news filter and drawdown limiter on MQL market NEW: Take a Break can be backtested against your account history! Check the " What's new " tab for details. Take a Break has evolved from a once simple news filter to a full-fledged account protection tool. It pauses any other EA during potentially unfavorable market conditions and will continue trading when the noise is over. Typical use cases: Stop trading during news/high volatility (+ close my trades before). Stop trading when
-25% discount ($199 -> $149) Advanced trading tool: One click smart orders that execute under your conditions Developed by trader for trading community:  position size calculator (lot size), open position after price action, strategy builder, set and forget trading, mobile notifications... Risk Management -  Risk percentage position size calculator, gain percentage, target risk reward ratio, spread and commissions are included in calculations 7 Advanced order types  - Set and forget trading w
UTM Manager は、迅速かつ効率的な取引執行を提供する直感的で使いやすいツールです。際立った機能の 1 つは、「スプレッドを無視」モードです。これにより、スプレッドを完全に無視して、ローソク足の価格で取引できるようになります (たとえば、LTF でより高いスプレッドのペアを取引でき、スプレッドによって取引から除外されるのを回避できます)。 UTM Manager のもう 1 つの重要な側面は、独自のローカル取引コピー機であり、各ブローカーで異なる取引戦略と設定 (たとえば、さまざまな TP、BE、およびリスク ルール) を柔軟に実行できます。 取引執行: 迅速かつ効率的な取引執行: チャート上のエントリー価格とストップロス価格をクリックして簡単に取引を入力するか、ワンクリックの固定ストップロスサイズ機能を使用します。 自動ロットサイズ計算: ロットは事前定義されたリスク設定に基づいて計算され、ドラッグによってポジションが変更されると再計算されます。 1 つまたは複数のポジションを同時に処理できる能力。 利益確定と損益分岐点: 柔軟なテイクプロフィット設定: 特定のリスク対報
The top-selling EAs on the market cost a lot and one day they are suddenly gone. This is because one strategy will not work in the forex market all the time. Our product is unique from all others in the MQL Marketplace because our EA comes with 34+ built-in indicators that allow develop strategies every time.  You build your strategy and keep updating it. If one strategy does not work, simply build another all using only one EA. This is All-In-One EA   in this market place. You can use as trade
Comprehensive on chart trade panel with the unique ability to be controllable from mobile as well. Plus has a library of downloadable configuration, e.g. exit rules, extra panel buttons, pending order setup and more. Please see our product video. Works with all symbols not just currency pairs. Features On chart panel plus controllable from free app for Windows, iPhone and Android Built-in script engine with library of downloadable configuration, e.g. add 'Close All Trades in Profit' button, exit
Cerberus Equity Watcher
Samuel Bandi Roccatello
5 (2)
Cerberus the Equity Watcher はリスク管理ツールであり、アカウントの資産を常に監視し、不完全な EA や裁量的なトレーダーの場合は感情的な行動によって引き起こされる大きなドローダウンを回避します。これは、バグを含む可能性のある EA や、予想外の市況でうまく機能しない可能性のある EA に依存するシステマティック トレーダーにとって非常に役立ちます。 Cerberus では、最小エクイティ値と (オプションで) 最大値を設定できます。これらのいずれかに達すると、すべてのポジションがフラットになり、すべての未決注文がクローズされ、すべての EA が「強制終了」されます。すべての位置を平坦化すると、ユーザーの携帯電話に通知が送信され、画面に明確なメッセージが表示されます。 「平坦化」の後、Cerberus は株式価値を監視し続け、再初期化されるまでそれ以上の取引の試みを停止し続けます。 Cerberus によって実行されるすべての操作は、画面に明確に表示され、Expert advisor タブに報告され、通知がユーザーに送信されます。ユーザーのミスを避けるために、
Mentfx Mmanage mt5
Anton Jere Calmes
4.25 (8)
The added video will showcase all functionality, effectiveness, and uses of the trade manager. Drag and Drop Trade Manager. Draw your entry and have the tool calculate the rest. Advanced targeting and close portions of a trade directly available in tool (manage trades while you sleep). Market order or limit order on either side with factored spread. Just draw the entry, the tool does the rest. Hotkey setup to make it simple. Draw where you want to enter, and the stop loss, the tool calculates al
YuClusters
Yury Kulikov
4.93 (43)
Attention: You can view the program operation in the free version  YuClusters DEMO .  YuClusters is a professional market analysis system. The trader has unique opportunities to analyze the flow of orders, trade volumes, price movements using various charts, profiles, indicators, and graphical objects. YuClusters operates on data based on Time&Sales or ticks information, depending on what is available in the quotes of a financial instrument. YuClusters allows you to build graphs by combining da
MT5からTelegramに完全にカスタマイズ可能なシグナルを送信して、シグナルプロバイダーになりましょう!この製品は、使いやすく視覚的に魅力的なグラフィカルインターフェースで提供されています。設定をカスタマイズして、数分で製品を使用開始できます! ユーザーガイド + デモ  | MT4バージョン  | Discordバージョン デモを試したい場合は、ユーザーガイドをご覧ください。 MT5からTelegramへの送信者は、ストラテジーテスターでは動作しません。 MT5からTelegramへの機能 多数のオプションを使用して、シグナルを完全にカスタマイズします シグナルの前後に独自のカスタムメッセージを追加します。これには、タグ、リンク、チャンネルなどが含まれます シグナル内の絵文字を追加、削除、カスタマイズします。また、すべて削除することもできます。 シンボルまたはマジックナンバーで送信する取引をフィルタリングします 特定のシンボルの送信を除外します 特定のマジックナンバーの送信を除外します シグナルと一緒に送信する取引の詳細をカスタマイズします シグナルと一緒にスクリーンショ
取引パネルは注文の管理に限定されています - ボタンを使用して開かれたものと、ユーザーによって開かれたものの両方です。 シンプルで便利なコレクション。 バイヤーを補完します。 Gold Stuff インジケーターと併用することをお勧めします。 単一注文として取引を設定し、距離のあるグリッドを構築します。 標準グリッドを作成するには、10000 などの大きな距離を設定するだけです。 リアルタイム結果はこちらからご覧いただけます。 設定と個人的なボーナスを得るために、購入後すぐに私に連絡してください!   設定 新しいシリーズを開く - 注文の新しいシリーズのオン/オフの開始。 Lot miltiplier - 次の注文のロット乗数。 TP - ピップで利益を得る。 SL - 最初の注文からのピップ単位のストップロス。 トレイル スタート - トレーリング ストップの有効化。 トレイル ステップ - トレーリング ストップを有効にしたときの価格からの距離。 DD 削減アルゴリズム - 利益のある最後の注文が損失のある最初の注文シリーズでクローズされる場合のドローダウン削減
OrderManager をご紹介:MT5用の革新的なユーティリティ 新しく設計されたOrder Managerユーティリティを使用して、MetaTrader 5での取引をプロフェッショナルなものにしましょう。シンプルさと使いやすさに焦点を当てたこのユーティリティは、各取引に関連するリスクを簡単に定義し、視覚化できます。これにより、情報に基づいた意思決定が可能になり、取引戦略を最適化できます。OrderManagerに関する詳細は、マニュアルをご参照ください。 [ マニュアル ] [ MT4 バージョン ] [ Telegram チャンネル ] 主な特長: リスク管理:取引のリスクを素早く簡単に定義し、より良い意思決定を行い、取引パフォーマンスを向上させます。 視覚表現:オープンなポジションとそれに関連するリスクをグラフィカルに表示し、明瞭かつ簡潔な理解が可能です。 注文変更:数回のクリックで注文を簡単に変更またはクローズし、取引プロセスを効率化し、貴重な時間を節約します。 手のひらの上の最新ニュース:ボタン一つで最新の市場ニュースに常にアクセスできます。 MT5トレーダーにと
This EA Utility allows you to manage (with advanced filtering) unlimited open orders (manual or EA) with 16 trailing stop methods: fixed, percent, ATR Exit, Chandelier Exit, Moving Average, Candle High Low Exit, Bollinger Bands, Parabolic, Envelope, Fractal, Ichimoku Kijun-Sen, Alligator, Exit After X Minutes or Bars, RSI and Stochastic. The trailing stop can be either real or virtual, and you can exit fully or with a partial close percent on touch or bar close.  Moreover, you can add (overri
ATTENTION the expert does not work in strategy tester, for a trial version visit my profile. " Launch offer : until the end of August 2024, purchase our product for only 100 USD instead of 150 USD!" Manual RiskGuard Management   RiskGuard management was born with the idea of ​​helping traders from their initial journey to becoming expert and aware traders. Compatible with any operating system whether Mac or Windows. The operations panel is integrated into the graph giving the possibility to
作者のその他のプロダクト
The on-balance volume indicator (OBV) is a momentum indicator and was developed in 1963 by Joseph E. Granville. The OBV shows the importance of a volume and its relationship with the price. It compares the positive and negative volume flows against its price over a time period. To provide further confirmation that a trend may be weakening, Granville recommended using a 20-period moving average in conjunction with the OBV. As a result, OBV users could then observe such events more easily by notin
TradeLeader PD - Pontos Decisivos O indicador TradeLeader PD completa seu trade system com as informações realmente relevantes. No painel você verá diversas informações consolidadas e sua relação com o preço. Compare os fluxos de compras e vendas(agressão), delta e muito mais. Veja abaixo o que somente o TradeLeader PD pode oferecer em um só indicador, elevando o Metatrader a outras plataformas profissionais especializadas. Painel Variação em porcentagem e ícone. Livro de ofertas: Resist
フィルタ:
レビューなし
レビューに返信