Percentage Levels
- インディケータ
- Alexandre Borela
- バージョン: 1.3
- アップデート済み: 24 1月 2022
このプロジェクトが好きなら、5つ星レビューを残してください。
インスタグラムでフォロー:borelatech
機関が大きなボリュームを取引するので、それらが試してみることは珍しくありません
特定のパーセンテージレベルでポジションを守る
これらのレベルは、あなたが使用できる自然なサポートと抵抗として役立ちます
取引を入力するか、ポジションに対する危険性を認識する。
一般的に使用されるパーセンテージの例は、EURUSDの0.25%と0.50%です。
毎週、スクリーンショットでこの例を見ることができます。
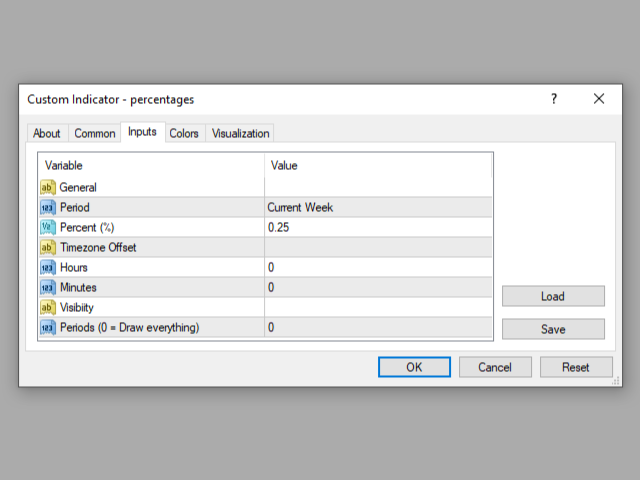
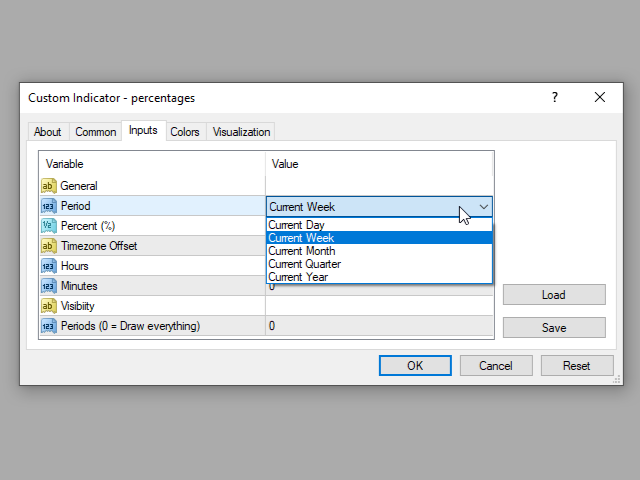
このインジケータを使用すると、以下の割合の変動を描画することができます。
- 日。
- 週。
- 月 日
- クォーター。
- 生年月日


Excelente indicador. Muito fácil de entender e de usar. Parabéns pela iniciativa de deixá-lo gratuito!