Simple Trend Info
- インディケータ
- Richard Waweru
- バージョン: 1.1
- アップデート済み: 27 11月 2021
- アクティベーション: 5
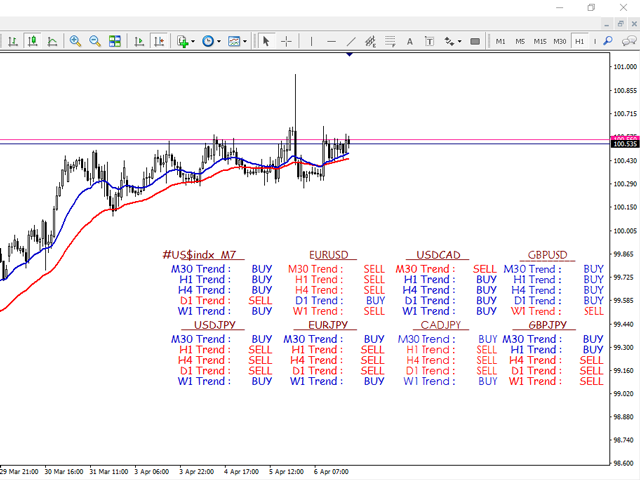
According to experts, trading against the trend is said to be hazardous, and perhaps sometimes it is a mistake that we easily make. Simple Trend Info is designed to display the trend of an asset class on different time frames and assists in minimizing trading against the trend. It uses the conventional moving averages to determine whether the trend is bullish or bearish and displays the trend on the screen. The time frames are limited to 5 options and you can adjust them as per your needs. The default time frames are:
- Weekly
- Daily
- H4
- H1 and
- 30 Mins
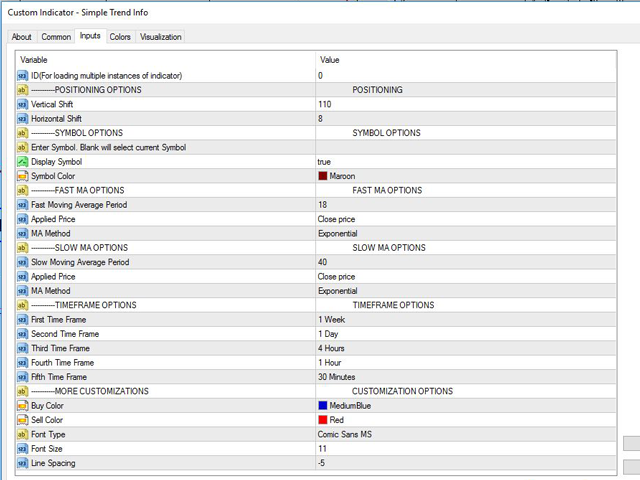
Input Parameters
- ID (For loading multiple instances of the indicator)
- Vertical Shift
- Horizontal Shift
- Enter Symbol
- Display Symbol. Leave blank to select current symbol.
- Fast Moving Average Period
- Applied Price
- MA Method
- Slow Moving Average Period
- Applied Price
- MA Method
- First Time Frame
- Second Time Frame
- Third Time Frame
- Fourth Time Frame
- Fifth Time Frame
- Buy Color
- Sell Color
- Font Type
- Font Size
- Line Spacing
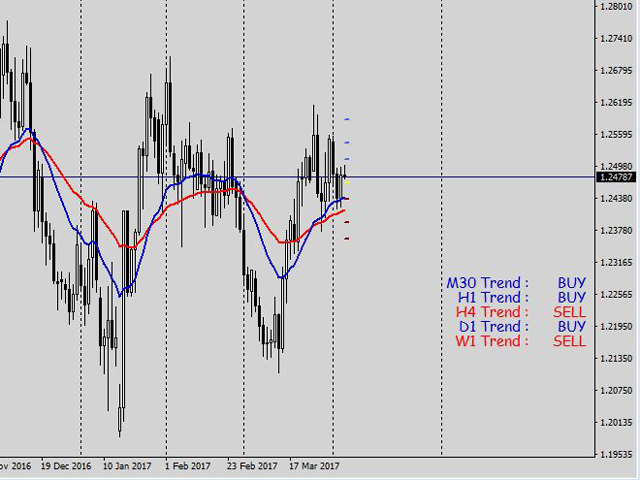
How it works
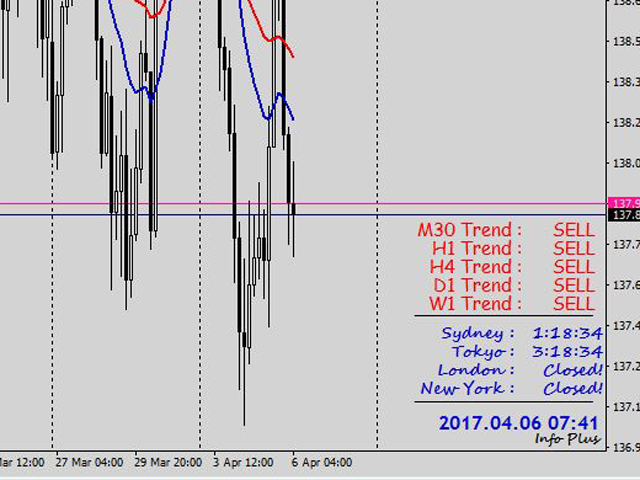
When the fast MA is above the slow MA, the trend is bullish. And when the fast MA is below the slow MA, the trend is bearish. Set the moving averages to the desired parameters (Period, applied price and MA method) and let the indicator determine if the trend is bullish or bearish. It will then display the trend of the asset class based on five time frames, which can be customized as one finds suit.
When loading the indicator on the chart, leave the ID to 0. If you would like to load multiple indicators on the chart you will have to set a unique ID for each indicator. Otherwise, it will overwrite a previous one that has the same ID.
The vertical shift is set to default 110 and the horizontal shift is set to default 8. If you would like to add an extra indicator that displays a different symbol, the difference in the vertical distance should be 100 by default and the horizontal should be 160 by default. Thus, the second indicator should have a vertical shift of 210 and a horizontal distance of 8. Or a vertical shift of 110 and a horizontal distance of 168.
The display of the indicator can be customized based on color (bullish color and bearish color), font type, font size and line spacing.

I can't live without it.