Higher High Higher Close Lower Low Lower Close
- インディケータ
- Mark Flint
- バージョン: 1.34
- アップデート済み: 8 12月 2020
- アクティベーション: 12
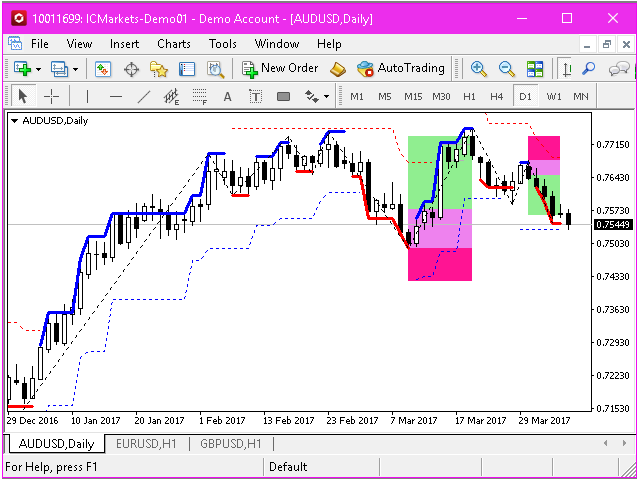
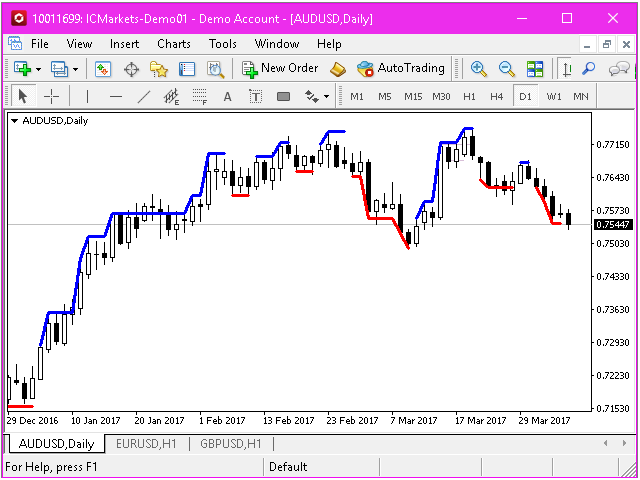
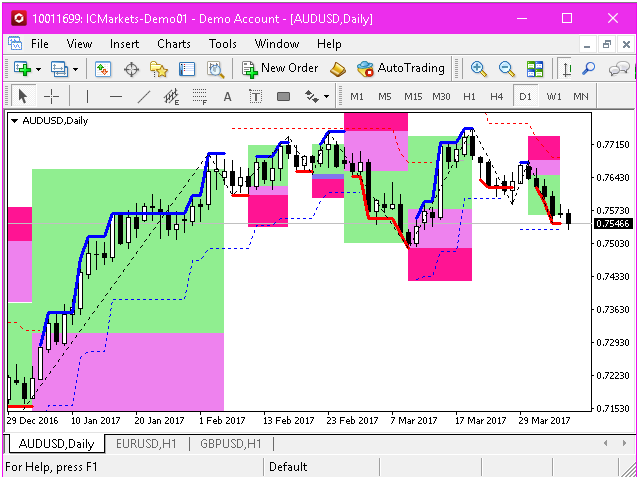
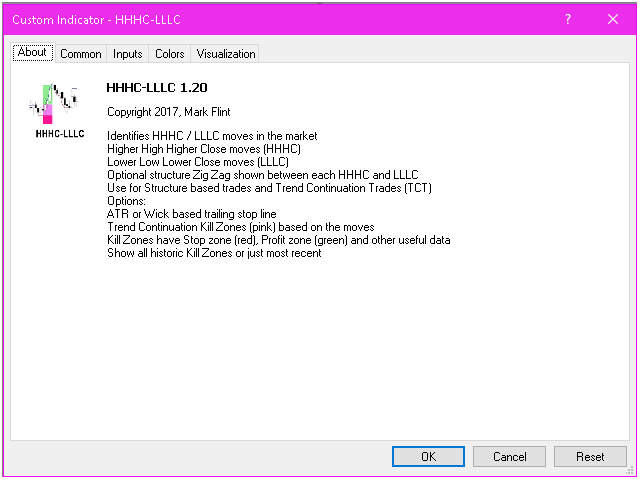
The HHHC-LLLC indicator uses candle by candle analysis, based on the principle of trend confirmation from Higher High, Higher Close candles (bullish) and Lower Low, Lower Close candles (bearish). There is no lag, no re-painting, and averaging is not used.
HHHC-LLLC helps confirm:
- market structure and levels - look left to see them line up
- trends, pullbacks & reversals
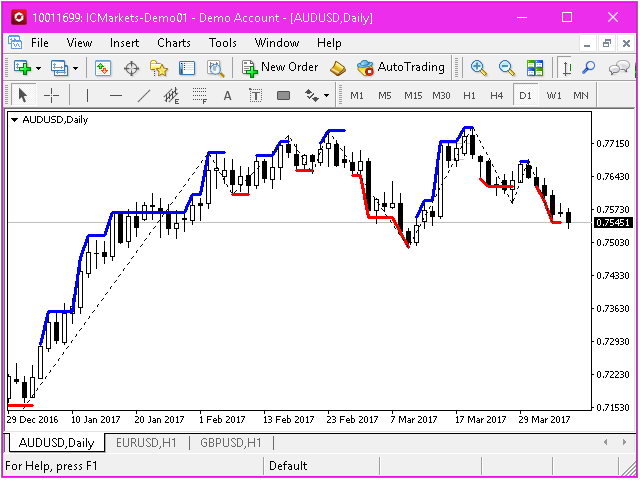
- Bull moves (blue), Bear moves (red)
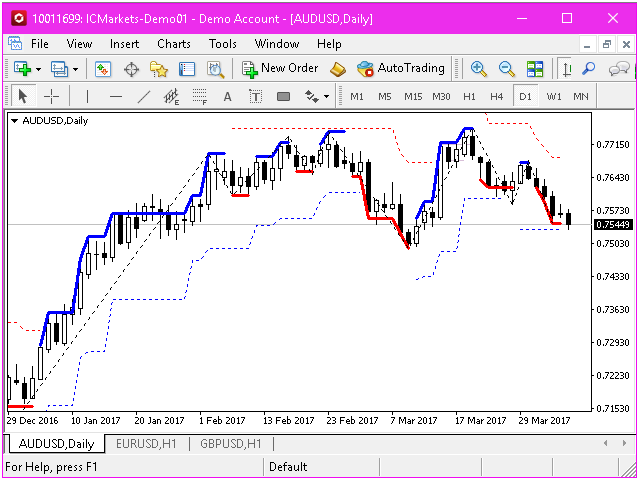
- Structure Zig Zags (black dotted lines), for summarizing market moves
- exhaustion and stalling (the lines go flat) - for anticipating reversals and continuations
- continuation
- breakout levels
- consolidation
- trend continuation Kill Zones.
- trailing stop levels - choice of types
Works on any market and timeframe. Moves alternate from bullish to bearish. Even a short pullback and continuation is shown precisely. View other timeframes to see trends, consolidations and structure levels so you can quickly make trading decisions based on facts.
Trend Continuation Kill Zones:
Based on trending moves and pullbacks, a potential trend continuation Kill Zone is determined. 3 zones are drawn, pink, green and red.
In a trending market, if price action pulls back into the pink zone and presents a valid reason for entry, for example a LLLC in the pink zone in a bearish market, then the green zone represents the test of the previous trend lows and the red zone represents a potential stop loss level (ATR based) such that the green target zone is a 1:1 with the pink plus red zones.
Each time frame will show Kill Zones respecting the trends and pullback on that timeframe.
You may have other filters to apply or your own rules for entry to improve your results, but the zones are drawn out using market moves and could be useful in Trend Continuation trading. Clearly you have to perform your own testing with this utility before trading live. To support back testing, the indicator has the option of showing all historic Kill Zones.
Indicator Inputs
- HHHC line colour [Blue] - bullish move
- LLLC line colour [Red] - bearish move
- HHHC-LLLC line style [Solid] - the line style, Solid, Dash, etc.
- HHHC-LLLC line width [3 pixels] - HIDE the line, or set width from 1 to 5 pixels
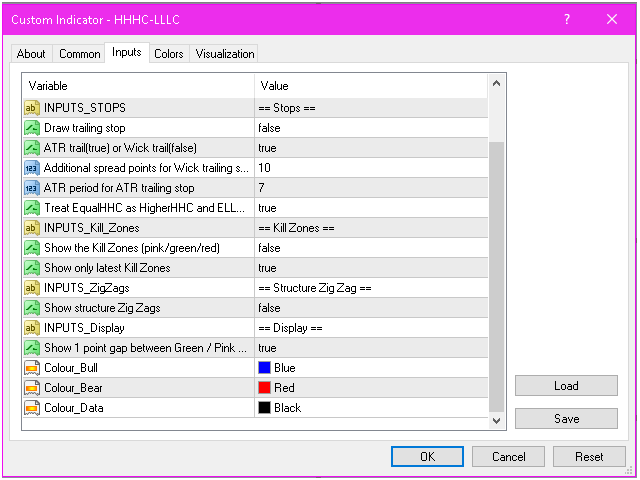
=Stops=
- Trail stop type [HEIKEN_ASHI_PLUS_POINTS_TRAIL_STOP] - options are NO_TRAIL_STOP (to disable it), ATR_TRAIL_STOP (uses the ATR period below) or WICK_PLUS_POINTS_TRAIL_STOP (based on the high/low extremes.) The Heiken Ashi trailing stop uses virtual Heiken Ashi candles
- Trailing stop line style [Dot] - the line style, Solid, Dash, etc.
- Trailing stop line width [1 pixel] - HIDE the line, or set width from 1 to 5 pixels
- Typical Spread Points [15] - used with trailing stops to determine if the stop was reached with price action
- ATR period for ATR trailing stop [7] - ATR period of the ATR trailing stop and Kill Zones functions
- trailing stop points [50] - Fixed adjustment to the Wick and Heiken Ashi trailing stops
=Kill Zones=
- Show the Kill Zones (pink/green/red) [false] - Controls the display of the Kill Zones
- Show only the latest Kill Zones [true] - Controls if only the latest bull and bear Kill Zones are displayed or all historic zones are displayed
=Zig Zags=
- Show Structure Zig Zags [true] - Controls the display of structure Zig Zags between apexes of successive HHHC and LLLC moves
- Zig Zag line colour [Black] - colour
- Zig Zag line style [Solid] - line style, Solid, Dash, etc.
- Zig Zag line width [2 pixels] - HIDE the line, or set width from 1 to 5 pixels
- Draw the Channel lines [true] - Controls the display of channel lines between the upper apexes (upper channel) and between the lower apexes (lower channel)
- Channel line colour [Gray] - colour
- Channel line style [DashDot] - line style, Solid, Dash, etc.
- Channel line width [1 pixel] - HIDE the line, or set width from 1 to 5 pixels
=Display=
- Show 1 point gap [true] - to see exact levels in the Kill Zone graphics when zoomed in
- Treat EqualHHC as HigherHHC and ELLC as LLLC [true] - A HHHC is a candle that has a higher high AND higher close than the candle before it. With [false] this pure approach is maintained. With [true] a candle that is equal high to the previous candle, but closes higher than the previous candle close "EHHC", will be treated as the start of a HHHC move. Bearish moves for equal low, lower close "ELLC" to be treated as LLLC

