Gartley Projection D
- インディケータ
- Oleksandr Medviediev
- バージョン: 3.23
- アップデート済み: 22 8月 2017
- アクティベーション: 20
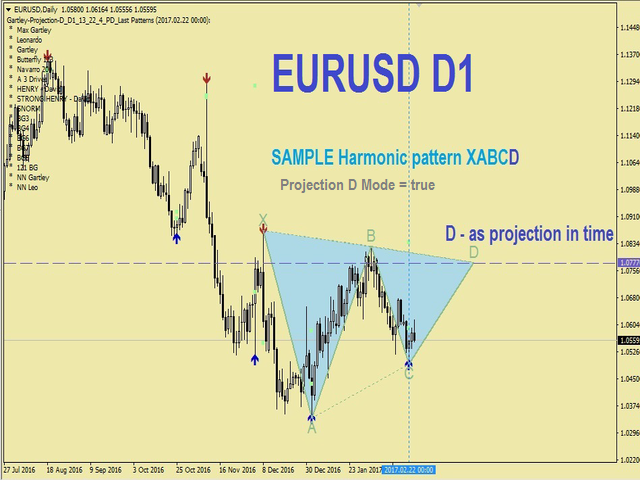
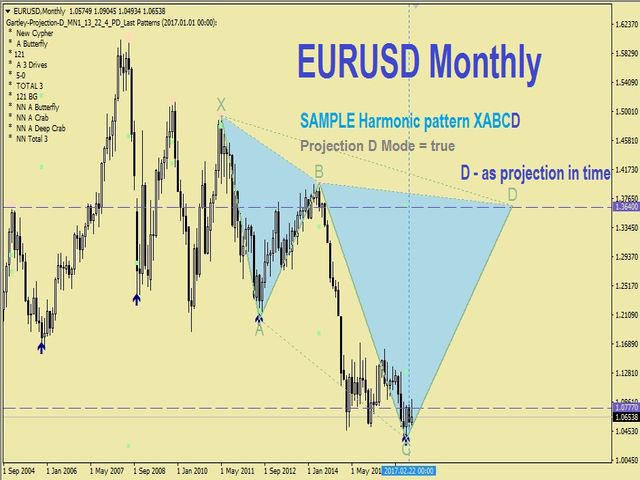
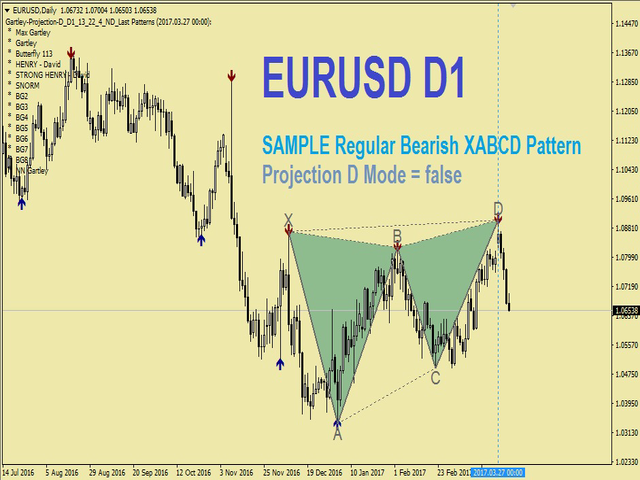
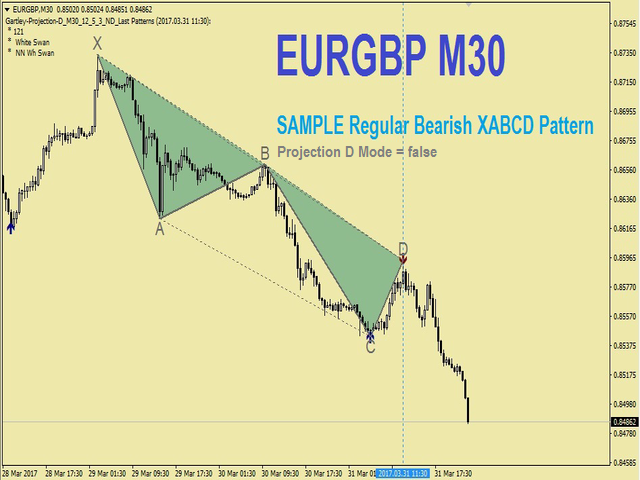
このインジケーターは、H.M.Gartley (「株式市場の利益」、1935 年) の開発に従って調和パターン (XABCD) を識別します。
D 点を透視投影の点として投影します (設定で ProjectionD_Mode = true を指定します)。
再描画はしません。 作業時間枠のバーが閉じるとき、特定されたパターン ポイントが Patterns_Fractal_Bars バーの間に移動していない場合、チャート上に (予想される価格変動の方向に) 矢印が表示されます。 この瞬間から、矢印はチャート上に永久に残ります。
連続した 2 ~ 3 つ以上の矢印 - これは市場状況の変化であり、再描画/再描画ではありません (時間枠を前後に切り替えてはなりません)。
注: 2 ~ 3 つ以上の矢印が連続している場合 - これは市況の変化であり、再描画ではありません。
パターンの総数は 85 です (Gartley-222 と Gartley-222WS を含む。完全なリストはコメント セクションにあります)。 識別されたすべてのパターンのうち、最後に識別されたパターンのみがベタ色で塗りつぶされます。
パラメーター
DrawPatterns (true/false) - 単色でパターンを描画します
ProjectionD_Mode (true/false) - D ポイントを遠近法の投影として定義するためのモード
Patterns_Fractal_Bars - 作業タイムフレーム バーの数。その間、形成されたフラクタルと見なされるためには、最後に識別されたパターン ポイントが固定されたままでなければなりません (チャート上に矢印が表示されます)。
Patterns_Deviation - パターン内の側面比率の基準値からの許容偏差パーセンテージ (許容値範囲)
Patterns_XA_MinLength_Bars - 初期セグメント XA のバーの最小許容数
Patterns_XA_MinHeight_Points - 初期セグメント XA の最小許容サイズ (ポイント単位)
ZigZag_Depth - ジグザグインジケーターのパラメーター
ZigZag_Deviation - ZigZag インジケーターのパラメーター
ZigZag_Backstep - ZigZag インジケーターのパラメーター
ShowInfo (true/false) - チャートの左側に識別されたパターンのリストを表示します。
PrintInfo (true/false) - 情報をログに出力します。


Updated review: I rented this indicator awhile back but came back to started using it once again because if you really study these patterns use both True and False settings it will allow you to see the whole picture of the particular pair you're trading.........This is just the way i like to use it following the False setting to trade but also using the True setting to be able to calculate my exit area to take profit at........Simply the best out there recommend is 1,000%!!! Thanks for your hard work on this huge winner, Oleksandr!!
Awesome Indicator, Great Work!! Truly no repainting arrows plus nice Gartley patterns respecting prices as far as I can see I can't wait to use it long term but short term I've had it already had a couple of winners following longer 1h,4h time frames THANKS!