Multi informer RSI and Bollinger Bands
- インディケータ
- Vyacheslav Ustinov
- バージョン: 2.0
- アップデート済み: 18 11月 2021
- アクティベーション: 5
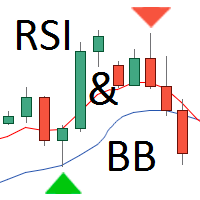
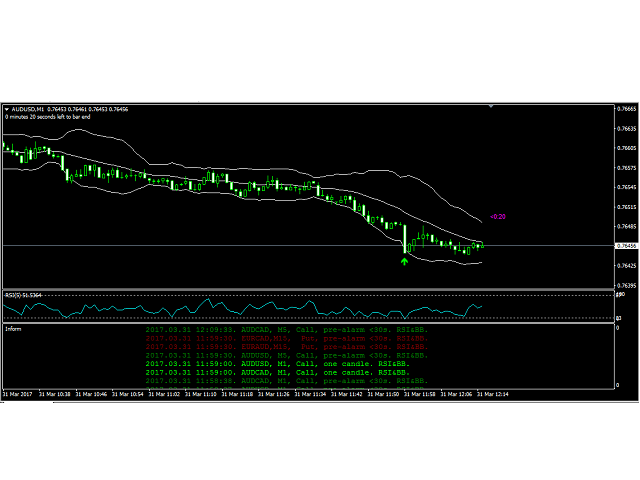
A lot of traders are interested in the Reversal Strategy for Binary Options. Most used indicators are Bollinger Bands (BB) and the Relative Strength Index (RSI). This indicator combines the BB and RSI indicators, information box with text message about the appearing signal and signal arrows on the price chart. The information box displays the preliminary and main signals for currency pairs with corresponding timeframes and accompanying audio alerts. The signals are generated for the currency pairs and timeframes specified in the settings.
When a signal appears, the information window displays a line with the currency pair and timeframe, audio notification is generated. Clicking the information line opens the currency pair and the timeframe in the current window. Thus, in the MetaTrader 4 terminal, there is no need to keep open windows with a multitude of currency pairs and timeframes required for trading.
Signal formation conditions
- A buy signal (Call) is formed when a bar closes below the lower line of the BB indicator while the RSI indicator value is below the lower border;
- A sell signal (Put) is formed when a bar closes above the upper line of the BB indicator while the RSI indicator value is above the upper border.
When the signal formation condition is met, a signal icon in the form of the corresponding arrow is displayed on the chart, a corresponding entry about the signal appears in the information box and an audio alert is generated. If a signal appears on a currency pair which is not opened on the current chart, then only a message in the information box is provided.
The settings include a parameter for obtaining the preliminary setting the specified number of seconds ahead, which allows evaluating an entry point beforehand and preparing to open an order. The preliminary signal in the form of an arrow may disappear from the chart, if the signal formation condition is no longer met. However, the information on the preliminary signal will not disappear from the information box.
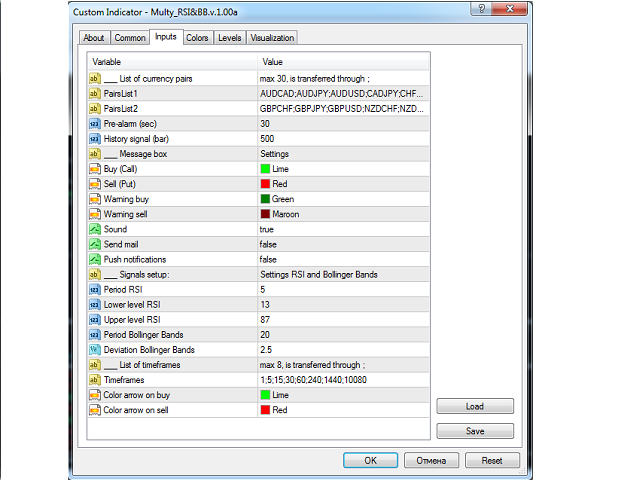
Indicator settings
Block of settings for currency pairs (30 pairs maximum)
- PairsList1 - the first list of currency pairs separated by ";" (15 pairs maximum);
- PairsList2 - the second list of currency pairs separated by ";" (15 pairs maximum);
- Pre-alarm (sec) - the number of seconds to receive the preliminary signal;
- History signal (bar) - the number of bars to output signals in the form of an arrow.
Settings for outputting information in the information box
- Buy (Call) - color of the information line for buying;
- Sell (Put) - color of the information line for selling;
- Warning buy - color of the information line for the preliminary buy signal;
- Warning sell - color of the information line for the preliminary sell signal;
- Sound - enable/disable audio alerts;
- Send mail - enable/disable sending emails;
- Push notifications - enable/disable sending push notifications.
Settings for the RSI and Bollinger Bands indicators
- Period RSI - RSI period (Close is used as the applied price);
- Lower level RSI - value for the lower RSI level;
- Upper level RSI - value for the upper RSI level;
- Period Bollinger Bands - BB period (Close is used as the applied price);
- Deviation Bollinger Bands - deviation value for the BB.
Timeframe settings (8 timeframes maximum)
- Timeframes - list of timeframes in minutes separated by ";" (max 8);
- Color arrow on buy - color for the sell signal arrow;
- Color arrow on sell - color for the buy signal arrow.
If it is necessary to display the BB and RSI on the main chart, separately attach the standard BB and RSI indicators with the corresponding settings to the chart.
Attention: Normal operation of the indicator requires downloading the bar history for the currency pairs and timeframes specified in the settings. A warning is output if history is not available. The history for each currency pair can be downloaded in a separate window without leaving the main window where the indicator is running.
The history of signals in the form of arrows is generated only for the timeframes listed in the "List of timeframes" field.
For testing in the strategy tester, it is necessary to specify a single currency pair and a single timeframe.







Great indicator! :)