Pivot Trend
- インディケータ
- Harun Celik
- バージョン: 1.0
- アクティベーション: 20
Pivot trend indicator is a trend indicator that uses standard pivot calculation and some indicators. The purpose of the indicator is to calculate the possible trends using the pivot point. And to give the user an idea about trend direction.
You can use this display as a trend indicator. Or with other indicators suitable for your strategy.
Features
- The green bar represents the upward trend.
- The red bar represents the downward trend.
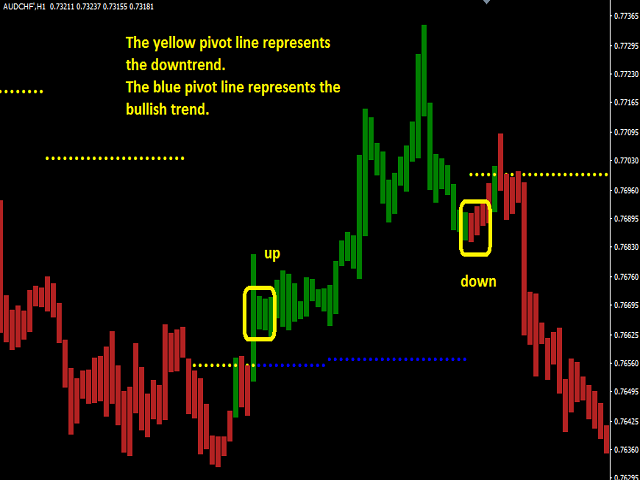
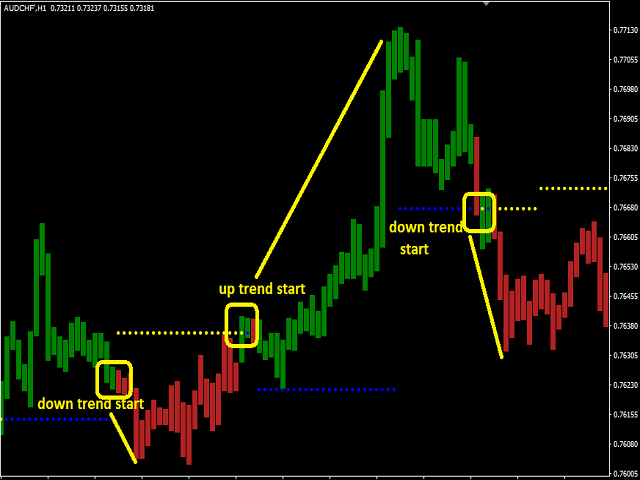
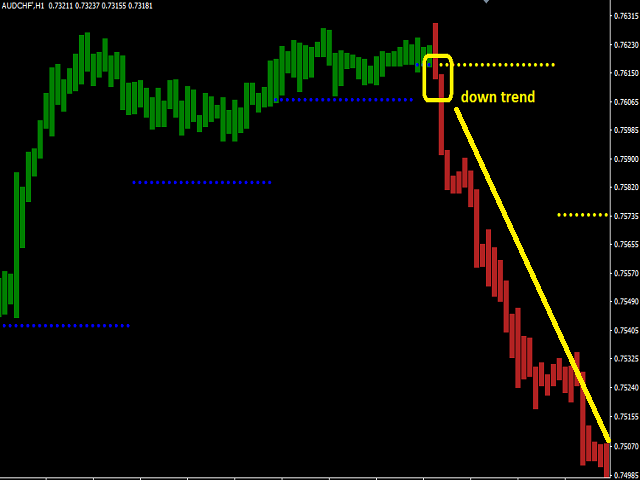
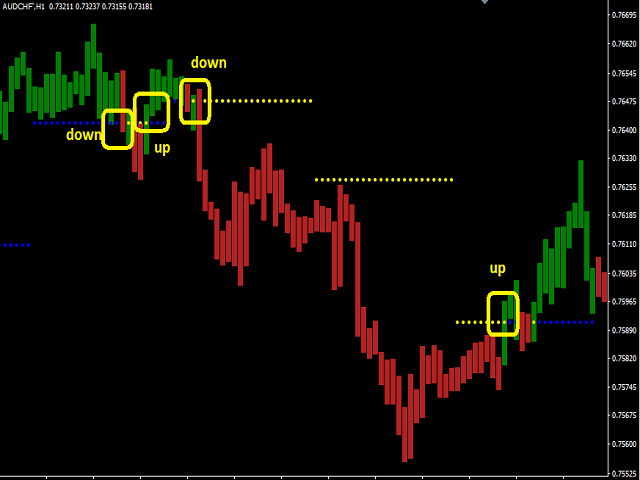
- The blue pivot point represents the upward trend.
- The yellow pivot point represents the trend of decline.
- Up trend
- If the bar color is green and pivot color is blue, upward trend is started.
- These two colors should appear at the same time.
- Follow the bar closures and act accordingly.
- Down trend
- If the bar color is red and pivot color is yellow, then the down trend will be started.
- These two colors should appear at the same time.
- Follow the bar closures and act accordingly.
Parameters
- Pivot_Trend_Period - The time frame for trend calculation is set here.


Thanks.