• 概要
  • レビュー (4)
  • コメント (70)
  • 最新情報

Color Trend FX

4

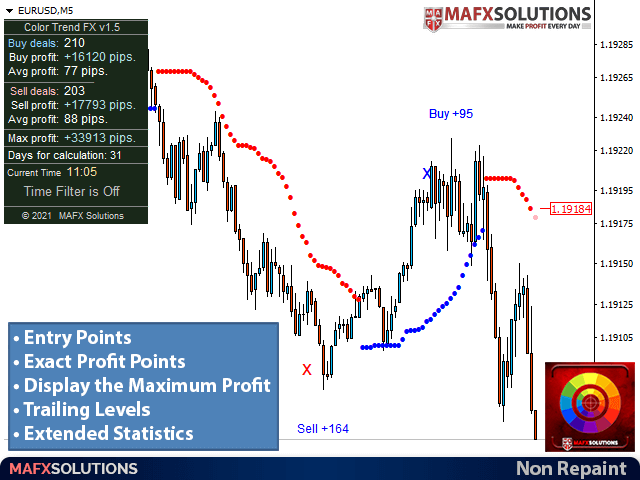
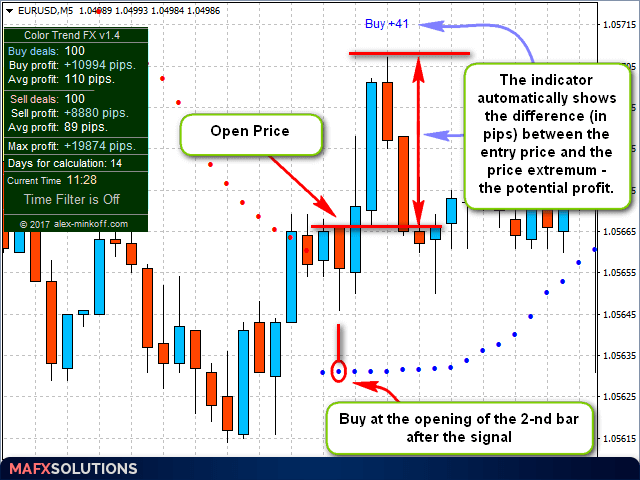
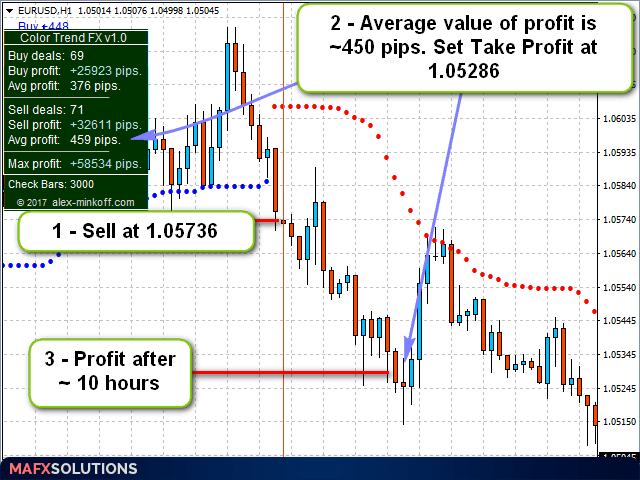
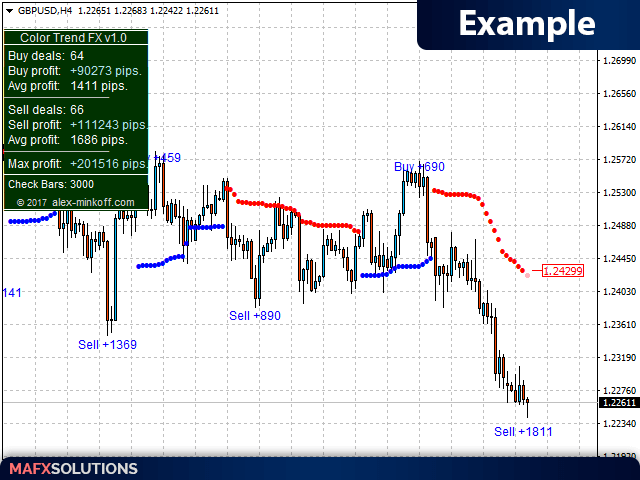
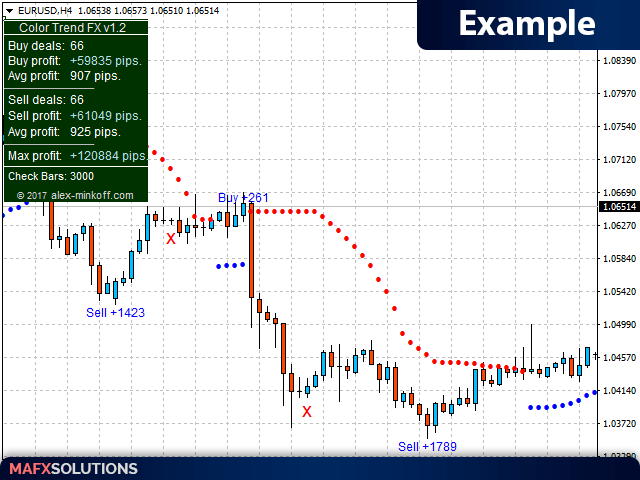
!SPECIAL SALE! The indicator shows on the chart the accurate market entry points, accurate exit points, maximum possible profit of a deal (for those who take profit according to their own system for exiting deals), points for trailing the open positions, as well as detailed statistics. Statistics allows to choose the most profitable trading instruments, and also to determine the potential profits.

The indicator does not redraw its signals! The indicator is simple to set up and manage, and is suitable for beginners, advanced and professional traders.

The indicator is a part of my portfolio of tools for trading, therefore, it will be constantly upgraded and supplemented with new features, which will be available to all my clients.


Features of Color Trend FX

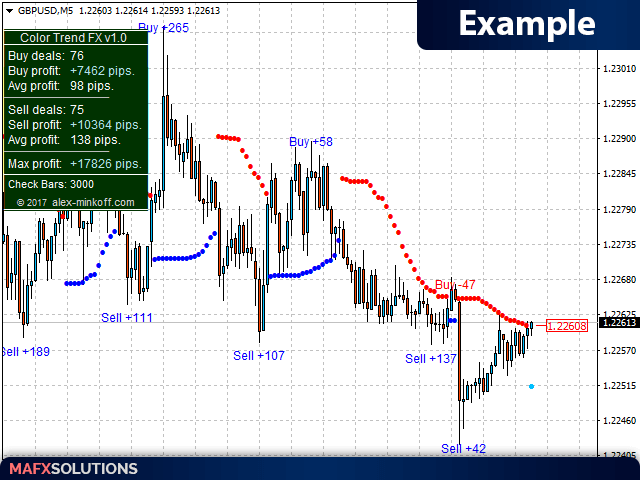
  • Automatically determines the market entry points;
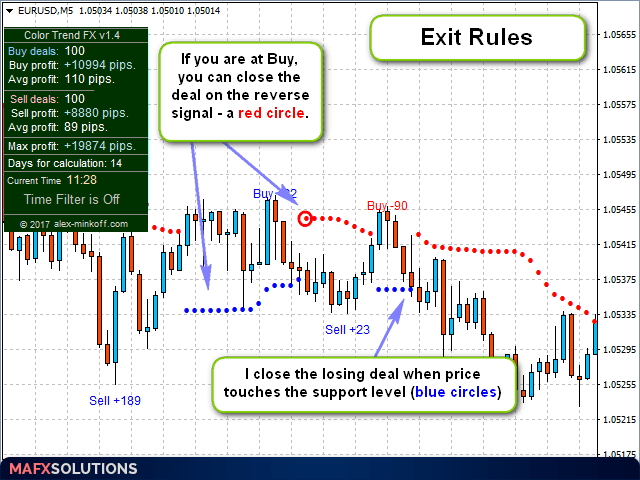
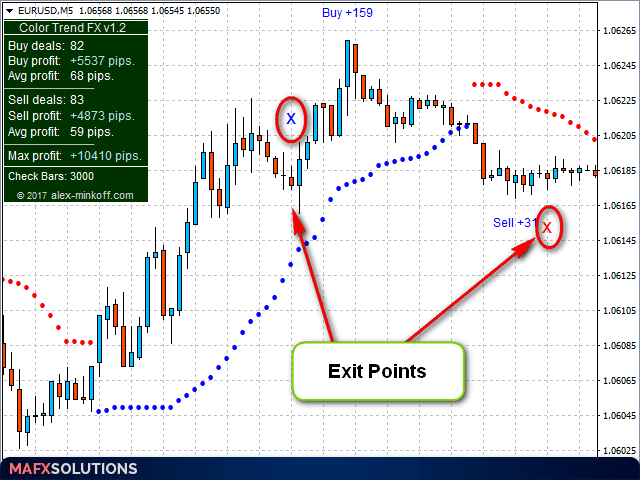
  • Automatically determines the market exit points;
  • Can be used on any symbols and timeframes;
  • Ability to trail open positions;
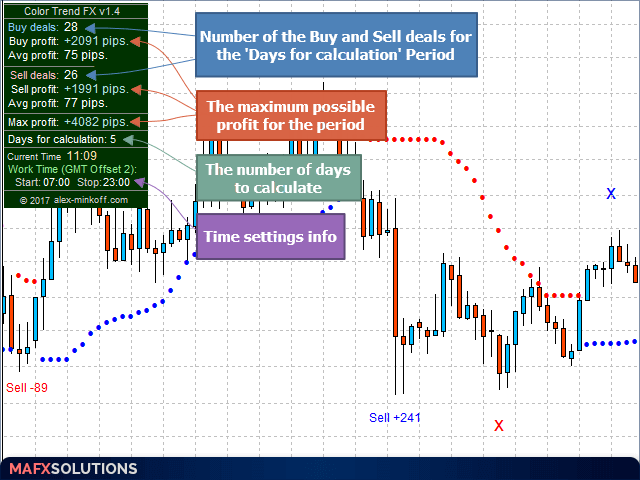
  • Expanded statistics on entries (separate for Buy and Sell deals), allowing to choose a profitable symbol and determine potential profit;
  • Notification functions using email messages, terminal alerts, push notifications;
  • Signals are not repainted;
  • Signals strictly on the "Close of the bar".


Main settings

  • AccuracyDelta - accuracy of entry filter. The lower the value, the more "noise" in signals. If a value is too large, the signal may be lagging;
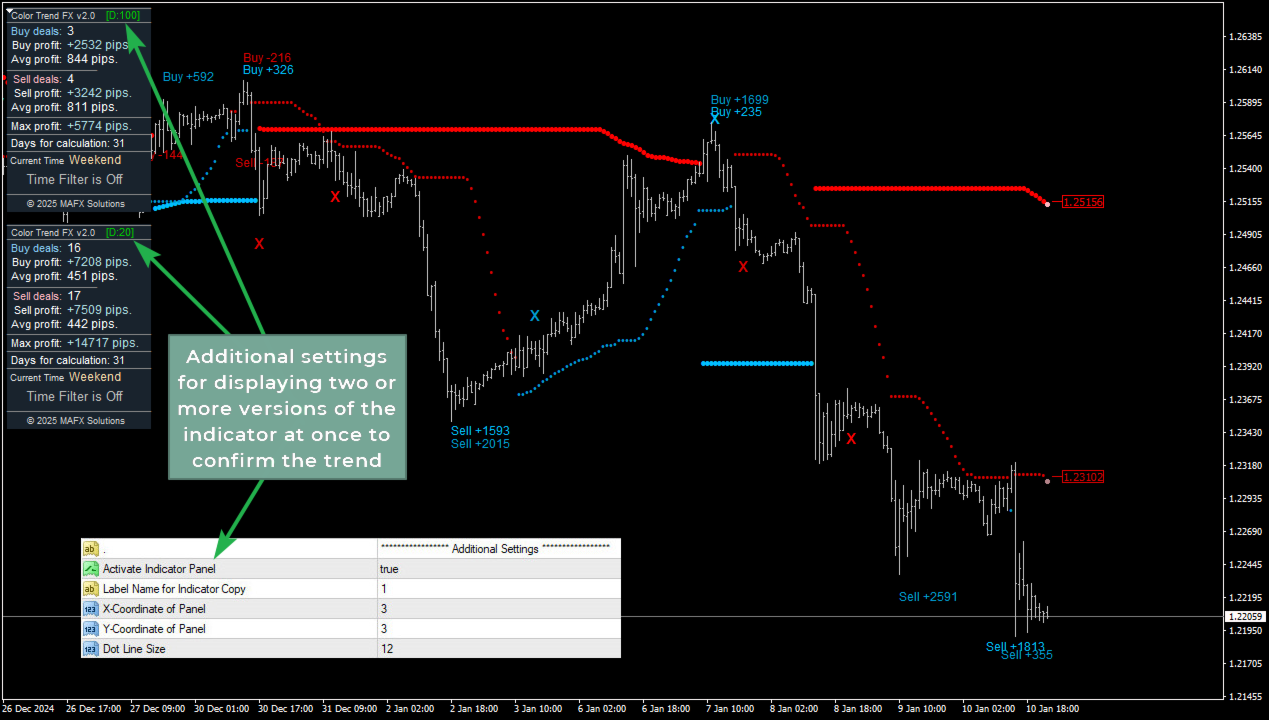
  • ‌Days for Calculation - number of days for calculation.  If your computer is not very powerful, you can limit the number of bars for calculation;
  • Show Extended Statistics - display extended statistics on deals;
  • Delta to Draw Arrows (in Pips) – offset in pips to display the signals on the chart.


    Time settings

    • Use Time Filter - activate filter by time;
    • ‌Start Hour - trading start hour;
    • Stop Hour - trading end hour;
    • GMT Offset – shift relative to GMT.

    Color settings

    • ColorBuy - color of buy signals;
    • ColorSell - color of sell signals;
    • CurrentColorBuy - color of buy signals on the current [0] bar;
    • ‌CurrentColorSell - color of sell signals on the current [0] bar.


    Notification (alert) settings

    • Enable Notifications - activate all types of alerts, false - disabled, true - enabled;
    • Enable Terminal Alerts - activate alerts in separate message boxes;
    • Send Push Message - send push notifications to the mobile terminals (specify the MetaQuotes ID in the settings);
    • Send an Email - send emails to the address specified in the settings.


    Important Note

    The purpose of the instrument is to show accurate entry points, points for trailing open positions, exit points. It also displays statistics on the possible potential profit for the current instrument and timeframe. It is not recommended to trade during important news releases, in order to avoid false entries!

    It is not recommended to trade on a low-volatility (flat) market!

    The principle of using the data on the average profit at the current symbol and timeframe:

    By analyzing different pairs and timeframes, you can choose the most profitable pair and timeframe suitable for your style of trading.

    Knowing the average profit on the current instrument and timeframe, you can select the average profit level for next trades.

    レビュー 4
    elabet78
    26
    elabet78 2023.08.08 22:08 
     

    Great product. Looking forward to get other indicators. Thanks.

    Gary Gee
    264
    Gary Gee 2022.03.04 07:04 
     

    More people should buy the Color Trend FX indicator. If you use it when the market is moving up and down and not going sideways, it provides great entry and exit points for trades. I'm using this indicator in conjunction with the AOTI indicator to decide when to enter and exit trades. This is a sleeper indicator that a lot of people have missed. I found a bug in the indicator. Alex fixed the bug right away. Alex provides great support.

    Joshua Mangold
    412
    Joshua Mangold 2017.12.27 07:12 
     

    This is my favorite indicator, would recommend. Very well done Alex!

    おすすめのプロダクト
    Implement
    Vitalii Zakharuk
    5 (1)
    Implement analyzes market dynamics for pivot points. If you want to learn how to spot the correct reversals for consistently likely profitable trading, buy this indicator. Shows favorable moments of entering the market in stripes. Ready-made trading system. The principle of operation of the indicator is to automatically determine the current state of the market when placed on a chart, analyze historical data based on historical data and display instructions for further actions on the trader's
    The Sentiment Ratio indicator gauges current Market Sentiment between -100% and 100%, where lower than -40% is considered Bearish and higher than 40% is Bullish. The channel between the two is considered Neutral. The indicator has been a very useful filter tool for signals within a trading system. Example call function:  int SentimentIndicator(double triggerLevel)//Return sentiment if trigger level is activated {   double sentimentRatio=iCustom(NULL,0,"Sentiment Ratio",0,0,0);   if(sentimentRat
    FREE
    Crypto_Forex インジケーター HTF OsMA オシレーター (MT4 用)。 - HTF OsMA は、市場で最も優れたトレンド インジケーターの 1 つです。HTF は、Higher Time Frame を意味します。 - このインジケーターは、プライス アクション エントリを使用するか、他のインジケーターと組み合わせて使用​​する、マルチタイム フレーム トレーディング システムに最適です。 - HTF OsMA インジケーターを使用すると、Higher Time Frame の OsMA を現在のチャートに添付できます --> これは、プロフェッショナルなトレーディング アプローチです。 // より優れたエキスパート アドバイザーとインジケーターは、こちらで入手できます: https://www.mql5.com/en/users/def1380/seller これは、この MQL5 Web サイトでのみ提供されるオリジナル製品です。
    Ska ZigZag BuySell
    NKATEKO VUKOSI LEROY MASANGO
    Ska ZigZag BuySell indicator determines the overbought and oversold regions within a trend. The indicator determines the overbought region by the candlestick high and the oversold region by the candlestick low. This indicator only gives signals with arrow and audible alerts each and every time when a new candlestick appear. To utilize the full strategy i recommend using "Ska ZigZag BuySell" together with "Ska ZigZag Line". The Ska ZigZag Line indicator is available for free. NOTE: Indicator is h
    Rira VWAP Bands
    Vitor Palmeira Abbehusen
    VWAP Bands gives you the regular Volume-Weighted Average Price and also the deviation bands. Use this indicator to see the possible amount of market movement, find support and resistance lines, find good spots for entry and exit,  and the most important feature is to find possible pivot points. This indicator has been mathematically improved by Rira team. The calculation begins at the start of each trading day
    Time Levels
    Yurij Izyumov
    4.38 (8)
    The indicator is designed for displaying the following price levels on the chart: Previous day's high and low. Previous week's high and low. Previous month's high and low. Each of the level types is customizable. In the indicator settings, you set line style, line color, enable or disable separate levels. The version of the exact same indicator but only with sound alerts there - Time Levels with Alerts . Configurations ----Day------------------------------------------------- DayLevels - enable/
    FREE
    このインジケーターは実践的なトレードに最適な自動波動分析のインジケーターです! 場合... 注:   Tang Lun (Tang Zhong Shuo Zen) の命名規則の影響で、私は波のグレーディングに西洋の名前を使用することに慣れていません。基本的な波を ペン 、二次波のバンドを セグメント と名付けました。同時に、 セグメント にはトレンドの方向が指定されます (この命名方法は将来のノートで使用されます。最初に言っておきます)。ただし、アルゴリズムは曲がりくねった理論とはほとんど関係がないため、付けるべきではありません。これは、私の市場分析 によって要約された、絶えず変化する複雑な運用ルール を反映しています。 バンドは標準化され、人によって異なることがないよう定義されており、市場参入を厳密に分析する上で重要な役割を果たす人為的な干渉の描画方法が排除されています。 このインジケーターを使用することは、取引インターフェイスの美しさを改善することと同等であり、元の K ライン取引を放棄し、取引の新しいレベルに連れて行きます。また、宣伝の観点から顧客の認識も向上します。 イ
    A ready-made trading system based on automatic construction and maintenance of Fibonacci levels for buying and selling on any instrument (symbol) and on any period of the chart. Determination of trend direction (14 indicators). The display of the trend strength and the values of the indicators that make up the direction of the trend. Construction of horizontal levels, support and resistance lines, channels. Choosing a variant for calculating Fibonacci levels (six different methods). Alert system
    Projection Trend - a Forex arrow indicator without redrawing does not change its signals when the market situation changes, does not adjust to the chart. The signals given by him are unambiguous. Traders build a trading system that provides good signals 80-90% of the time. The indicator showing the points of entry and exit from the market with arrows is able to bring results not only in the Forex market, but also when working with binary options. You can buy it and install it in MetaTrader you
    PowerXXX
    Marco Fornero Monia
    PowerXXX measures the power of the current candlestick and displays it in numerical format and colors. The indicator can cover multiple timeframes and can be placed on the main chart or on the charts of the underlying indicators. The number of timeframes is selectable, as well as the color levels according to the power expressed. In the latest version, the power can be expressed as a function of the opening of the candle itself or as a function of the opening of the total candles before. There
    This indicator is designed to help you forecast the potential high and low prices for the current trading day, based on the high and low of the previous day. It does this by applying a customizable percentage increase or decrease to those levels. How It Works: The idea is simple: It looks at the previous day's high and low prices and then adjusts them by a percentage you choose. Here's what that means: Predicted High : This is calculated by taking the high price of the previous day and adding a
    Fibonacci automatically draws Fibonacci retracement, Because Fibonacci automatically draws Fibonacci retracement, you can know at a glance the price to buy at a push or sell back. Therefore, you can trade in favorable conditions in a trending market. The "PowerMap" is a bundle of four items ("DrawTurningPoint", "DrawHurdle", "DrawChartPattern", "DrawFibonacci").  Please be careful not to purchase more than one copy (duplicates). We are live-streaming the actual operation of the system. Please
    MoveWave - Moving waves are very handy indicators for determining pivot levels. Most Forex traders make decisions based on technical analysis. This type of analysis determines patterns and trends in the market. With the help of complex mathematical equations that are combined and made out in the form of this indicator, the trader will be able to more accurately determine the price reversal levels. Wave theory mathematically represents various behavioral models of the market. It is used as the ba
    パラボリック SAR およびサポート/レジスタンス レベルは、潜在的なトレンドの反転やエントリー ポイントとエグジット ポイントを識別するために外国為替取引で使用されるテクニカル分析インジケーターであるだけでなく、既製の自律的な取引戦略でもあります。 このインジケーターは、チャートに動的なサポート レベルとレジスタンス レベルを追加することで PSAR インジケーターを基盤としており、トレーダーが市場が反転する可能性のある主要な価格レベルを特定するのに役立ちます。 このインジケーターを使用すると、トレーダーは市場の強さと方向、および取引の潜在的なエントリー ポイントとエグジット ポイントに関する洞察を得ることができます。 パラボリック SAR およびサポート/レジスタンス レベル インジケーターは、チャートにさまざまなパラボリック サポートとレジスタンス (PSAR) レベルをプロットするテクニカル分析ツールであり、トレーダーに潜在的なトレンドの反転シグナルを提供します。 このインジケーターは、メインの MT4 チャート ウィンドウに一連の水平に並んだ線として表示されるため、トレ
    購入後に包括的なユーザーガイドを入手するには、お問い合わせください。  MQL5のシルバー賞を受賞した開発者が精密に設計したHydra Trend Riderインジケーターで、あなたのトレーディング体験を向上させましょう。比類なき市場の洞察を提供し、意思決定プロセスを強化するこの高度なツールは、トレーダーがトレーディング戦略において精度と効率を追求するための完璧な選択肢です。 MQL5チャンネル に参加する 当社の製品をご購入いただくと、 PDF形式の包括的なユーザーガイドをお送りします。ご購入後にお問い合わせいただければ、 迅速にユーザーガイドをお送りします。 インジケーターの特徴: マルチタイムフレームダッシュボード:  当社の洗練されたダッシュボードで、異なるタイムフレームにわたる市場の全体像を把握しましょう。短期的な変動や長期的なトレンドを分析する際にも、Hydraインジケーターは一瞬も見逃さないようにします。 強力なトレンドシグナル:  強力なトレンドシグナル機能で市場に先んじましょう。このツールは市場のトレンドを特定し、それを活用するのに役立ち、タイムリーで情報に基づい
    Diamonds Min5   - DM5-   DM5   is an indicator that suggests entering levels (sell or buy) ,it always follow the trends using parabolic sar ,  working on is so easy, you need just to attach it to the chart and all the magic will show , this indicator does not repeat itself or redraw signals . After months of testing, it provides a very good result     it works on all pairs with no excaption 
    Calculated trend indicator, can be used with an optimal risk to profit ratio, shows successful signals. Uses two options for settings. Shows favorable moments for entering the market with arrows. The probability of a successful trend is not very bad! The indicator can be used both for pipsing on small periods, and for long-term trading. The indicator does not redraw and does not lag. It works on all currency pairs and on all timeframes.
    The indicator trades during horizontal channel breakthroughs. It searches for prices exceeding extreme points or bouncing back, monitors night flat and defines targets using customizable Fibo levels with a sound alert, which can be disabled if necessary. The indicator allows you to create a horizontal channel between the necessary extreme points in visual mode quickly and easily. It automatically applies your selected Fibo levels to these extreme points (if the appropriate option is enabled in t
    Introduction In the fast-paced world of financial market trading, success often hinges on the ability to spot and leverage trends. Among the various strategies available, momentum trading stands out as a powerful tool for traders seeking to capitalize on market movements. In this article, we will delve into the concept of momentum, its significance in trading, and the numerous benefits it offers to traders. What is Momentum? Momentum in trading refers to the tendency of assets to continue moving
    A trending market is one in which price is generally moving in one direction. ... When trading a trend-based strategy, traders usually pick the major currencies as well as any other currency utilizing the dollar because these pairs tend to trend and be more liquid than other pairs.  Best Trend Indicator That Tells You the Direction of the Trend   Trend MagicX_v1.1 displays the trend direction, duration, intensity and the resulting trend rating for all time frames in real time. You'll see at a
    SSA stands for ' Singular Spectrum Analysis '. It combines elements of classical time series decomposition, statistics, multivariate geometry, dynamical systems and signal processing. SSA decomposes time series into a sum of components (ETs), with each component representing a lower smoothing, using several SVD ( Singular Value Decompositions ). It is a powerful filtering process used in many fields of research (climatology, biomedical, aerospace, etc), where high quality forecasting and smoot
    最高のパフォーマンスを実現。利益出金用に最適化。 新しいオプションの導入 - 利益出金のエミュレーションによるテスト。 アルティメットヒーローは、FXの利益を最大化するために設計された高度な取引ツールです。この高度な取引ソフトウェアは、最新のGPT-4テクノロジーを使用して作成され、幅広い高度な機能を備えています。 アルティメットヒーローは、マーチンゲールシステムに基づいたグリッド取引戦略を使用する取引ボットです。市場の実勢に応じて複数の取引を行うことで、安定したリターンを提供するように設計されています。 エキスパートアドバイザーは、異なる価格レベルで複数の注文を発注し、現在の市場価格を中心としたグリッドを作成するグリッド取引方法を使用します。このアプローチにより、ボットは常に市場に存在し、両方向の潜在的な値動きを捉えます。 アルティメットヒーローは、マーチンゲール取引システムを使用してリスクを管理し、利益を確保します。このシステムでは、同じ利益目標を維持しながら、その後の取引サイズを大きくすることで、負け取引の影響を最小限に抑え、勝ち取引からの潜在的利益を最大化します。 取引専門家
    Arrow up down is a mt4 indicator that shows various levels to enter the market. It consists of two signals; Buy signal Sell signal Buy signals are shown as blue arrows on the chart once you install the indicator. Sell signals are shown as red signals on the chart. The indicator uses other underlying indicators like moving average together with statistical calculations to generate signals.
    CSS " currency strength slope "  is a a multi currency strength indicator that use Forex major currencies, EUR, USD, CAD, AUD, NZD, JPY, CHF, GBP. it use 28 major pairs to calculate the power of every currency using a based moving averages algorithm : you will see volatility clearly between currencies. input: MA Fast & Slow. - MA Mode : simple, exponential, smoothed, linear weighted - Applied Price : close, open, high, low, median price, typical price, weighted price.
    This indicator draws lines at the open, close, high and low price of the last chart candle from the set timeframe. In addition, a label shows whether it was an up or down candle. The standard settings follow the original idea of ​​getting the price data from the daily timeframe for day trading/scalping, but since this indicator is fully customizable, you can also set a different timeframe. Based on the drawn price lines, you can then also display Fibonacci levels. This function can also be
    This is a simple PriceTMA bands, non repaint! it can be used for a trend following system or sometimes reversals. as a main signal or a filter for others strategies, it depends on the trader main strategy. calculations for this indicator are a combined Algorithm between moving averages "MA" and average true range"ATR". good luck with your trading! i hope it is helpful Cheers
    Trend New Trend Indicator, shows the signals for entry. Displays both entry points and the trend itself. Shows statistically calculated moments for entering the market with arrows. When using the indicator, it is possible to optimally distribute the risk factor. Settings: Uses all one parameter for settings. Selecting a parameter, it is necessary to visually resemble it so that the appropriate graph has a projection of extremes. Options: Length - the number of bars for calculating the indica
    Fibo label
    Damir Satridinov
    5 (1)
    Индикатор рисует уровни Фибоначчи с выделенными Ценовыми метками.При установке индикатора на график необходимо создать трендовую линию с именем указанным в поле" Unique name of trend line to place fib on ". По умолчанию имя=" Unique name of trend line to place fib on"  =     "+"    .В индикаторе можно заменить уровни фибоначчи по своему усмотрению.Также меняются цвет,стиль,толщина линий и т. д.
    FREE
    This is a simple and efficient indicator based on market logic. The indicator creates a range chosen by a trader. Trader selects only two parameters. The first one is the number of candles that define the frame. The second one is the number of candles needed for confirmation frame. The indicator shows all situations in history and works with the actual movement of the market. The indicator works on all timeframes . You are not limited by use of different timeframes, the indicator is able to adap
    ForexGumpUltra is a new and more advanced indicator of the ForexGump series. This indicator easily determines the price direction on any currency pair and any timeframe. The indicator draws its signals on the zero bar and does not redraw them (see the video). In the 34th second of the video it can be seen that this indicator uses new filters to determine the changes in price movement direction without delay, despite the market noise present at the moment (see the video on the 34th second). Once
    このプロダクトを購入した人は以下も購入しています
    NOTE: CYCLEMAESTRO is distributed only on this website, there are no other distributors. Demo version is for reference only and is not supported. Full versione is perfectly functional and it is supported CYCLEMAESTRO , the first and only indicator of Cyclic Analysis, useful for giving signals of TRADING, BUY, SELL, STOP LOSS, ADDING. Created on the logic of Serghei Istrati and programmed by Stefano Frisetti ; CYCLEMAESTRO is not an indicator like the others, the challenge was to interpret only t
    !SPECIAL SALE! An exclusive indicator that utilizes an innovative algorithm to swiftly and accurately determine the market trend. The indicator automatically calculates opening, closing, and profit levels, providing detailed trading statistics. With these features, you can choose the most appropriate trading instrument for the current market conditions. Additionally, you can easily integrate your own arrow indicators into Scalper Inside Pro to quickly evaluate their statistics and profitability
    反転ゾーン / ピークボリューム / 主要プレーヤーのアクティブゾーン =       TS TPSプロシステム 説明書 RUS       /       説明書     英語     /       Version MT5 このインジケーターを購入したすべての購入者は、さらに以下を無料で受け取ります: RFI SIGNALS サービスからの取引シグナルへの 6 か月間のアクセス - TPSproSYSTEM アルゴリズムに従った既製のエントリ ポイント。 定期的に更新されるトレーニング資料 - 戦略に没頭し、プロフェッショナル レベルを高めます。 平日は 24 時間 365 日サポート、非公開のトレーダー チャットへのアクセス - コミュニケーション、サポート、市場状況の分析。 著者の設定ファイル - 余分な労力をかけずに最大の結果を達成するための自動インジケーター設定。 主な機能: 売り手と買い手のアクティブなゾーンを表示します。 このインジケーターは、購入と販売の正しい最初のインパルス レベル/ゾーンをすべて表示します。これらのレベル/ゾーンがアクティブになると、エントリ
    現在20%OFF! 初心者やエキスパートトレーダーに最適なソリューションです。 このインディケータは、エキゾチックペア・コモディティ・インデックス・先物など、あらゆるシンボルの通貨の強さを表示することに特化したインディケータです。金、銀、原油、DAX、US30、MXN、TRY、CNHなどの通貨の強さを表示するために、9行目にどのシンボルでも追加することができます。独自の機能を多数搭載し、新しい計算式を採用したため、ユニークで高品質、かつ手頃な価格のトレーディングツールとなっています。新しいトレンドやスキャルピングチャンスのトリガーポイントを正確に把握することができるため、あなたのトレードがどのように改善されるか想像してみてください。 ユーザーマニュアル:ここをクリック   https://www.mql5.com/en/blogs/post/708876 すべての時間枠に対応します。あなたはすぐにトレンドを見ることができるようになります! 新しいアルゴリズムに基づいて設計されているため、潜在的な取引の特定と確認がより簡単になります。これは、8つの主要通貨と1つのシンボルの強弱
    Advanced Supply Demand
    Bernhard Schweigert
    4.91 (294)
    現在33%オフ 初心者にもエキスパートトレーダーにも最適なソリューション このインジケーターは独自の機能と新しい公式を多数内蔵しており、ユニークで高品質かつ手頃な取引ツールです。このアップデートでは、2つの時間枠ゾーンを表示できるようになります。より長いTFだけでなく、チャートTFとより長いTF(ネストゾーンを表示)の両方を表示できます。すべてのSupply Demandトレーダーの皆さんのお気に召すはずです。:) 重要情報の公開 Advanced Supply Demandの可能性を最大化するには、 https://www.mql5.com/ja/blogs/post/720245 にアクセスしてください。   エントリーまたはターゲットの正確なトリガーポイントを正確に特定できれば取引がどのように改善されるか想像してみてください。新しい基盤となるアルゴリズムに基づいて構築されているため、買い手と売り手の間の潜在的な不均衡をさらに簡単に特定できます。これは、最も強い需要と供給のゾーンと、過去のパフォーマンス(古いゾーンを表示)がグラフィカルに表現されるためです。これらの機能は、最適な
    現在20%OFF! 初心者やエキスパートトレーダーのためのベストソリューション! このダッシュボードソフトウェアは、28の通貨ペアで動作しています。それは私達の主要な指標(高度な通貨の強さ28と高度な通貨インパルス)の2に基づいています。それは全体の外国為替市場の大きい概観を与えます。それは、すべての(9)時間枠で28の外国為替ペアのための高度な通貨の強さの値、通貨の動きの速度と信号を示しています。チャート上で1つのインディケータを使用して市場全体を観察し、トレンドやスキャルピングの機会をピンポイントで見つけることができたら、あなたのトレードがどのように改善されるか想像してみてください。 このインディケータには、強い通貨と弱い通貨の識別、潜在的な取引の識別と確認がより簡単になるような機能が搭載されています。このインディケータは、通貨の強さや弱さが増加しているか減少しているか、また、すべての時間枠でどのように機能しているかをグラフィカルに表示します。 新機能として、現在の市場環境の変化に適応するダイナミックなマーケットフィボナッチレベルが追加され、すでに当社のAdvanced
    このインディケータは、当社の2つの製品 Advanced Currency IMPULSE with ALERT  +   Currency Strength Exotics . のスーパーコンビネーションです。 このインジケーターは全ての時間枠で作動し、8つの主要通貨と1つのシンボルの強弱のインパルスをグラフで表示します。 このインジケータは、金、エキゾチックペア、商品、インデックス、先物など、あらゆるシンボルの通貨強度の加速度を表示することに特化されています。金、銀、原油、DAX、US30、MXN、TRY、CNHなどの通貨強度の加速度(インパルスまたは速度)を表示するために、任意のシンボルを9行目に追加できる、この種の最初のものです。 新しいアルゴリズムに基づいて構築され、潜在的な取引の特定と確認がさらに容易になりました。これは、通貨の強さや弱さが加速しているかどうかをグラフィカルに表示し、その加速の速度を測定するためです。加速すると物事は明らかに速く進みますが、これはFX市場でも同じです。つまり、反対方向に加速している通貨をペアリングすれば、潜在的に利益を生む取引を特定
    PUMPING STATION – あなた専用の「オールインワン」戦略 PUMPING STATIONは、あなたのトレードをより楽しく、そして効果的に変えてくれる革新的なFXインジケーターです。ただの補助ツールではなく、強力なアルゴリズムを備えた本格的なトレーディングシステムで、より安定したトレードのスタートをサポートします。 この商品をご購入いただくと、以下の特典を無料でお付けします: 専用セットファイル:自動設定による最大パフォーマンスを実現。 ステップバイステップのビデオマニュアル:PUMPING STATION戦略の使い方を学べます。 Pumping Utility:PUMPING STATION専用の半自動トレードボットで、より快適かつシンプルな運用を可能にします。 ※ご購入後すぐにご連絡ください。追加リソースへのアクセスを提供いたします。 PUMPING STATIONの仕組み: トレンド管理:市場のトレンド方向を即座に判断。トレンドはあなたの最高の味方です。 エントリーサイン:チャート上の矢印で、取引のタイミングと方向を明確に示します。 明確な目標設定:インジケーターが自
    StalkeR Arrow
    Abdulkarim Karazon
    5 (3)
    StalkeR Arrow は、バーオープン/バー内で売買シグナルを与える矢印インジケーターです。このインジケーターは価格行動パターンとフラクタルに基づいています。 このインジケーターは、各買いシグナルと売りシグナルの tp と sl を与えます。tp と sl は各シグナルの上下の線の形式であり、新しいシグナルが形成されるまで延長されます。 このインジケーターには、履歴シグナルの勝敗統計を提供するバックテスト パネル/ダッシュボードがありますが、このインジケーターは再ペイントやバックペイントを行いません。 パラメーター : StalkeR 周期 : 矢印周期、数値が大きいほど信号が少なくなります スプレッド: ポイント単位のスプレッド値を使用して、パネル上の勝敗を計算します。 ストップロス ATR x : atr 乗算における SL 値 Takeprofit ATR x : atr乗算のTP値 ATR 期間 : に基づいて tp と sl を計算するために使用する atr 期間 TP/SL ラインの色と幅 矢印の色と幅 パネル/ダッシュボードの位置。 ア
    Golden Trend Indicator
    Noha Mohamed Fathy Younes Badr
    5 (10)
    Golden Trend indicator  is The best indicator for predicting trend movement this indicator never lags and never repaints and never back paints    and give  arrow buy and sell    before the candle appear  and it will help you and  will make your trading decisions clearer its work on all currencies and  gold and crypto and all time frame This unique  indicator uses very secret algorithms to catch the  trends, so you can trade using this indicator and see the trend clear on charts  manual guide and
    VERSION MT5        —        ИНСТРУКЦИЯ RUS           —        INSTRUCTIONS  ENG 主な機能: レンダリングなしで正確な入力信号! シグナルが表示された場合、それは関連性を維持します。これは、シグナルを提供してからそれを変更する可能性があり、入金時の資金の損失につながる可能性があるリドローインジケーターとの重要な違いです。より高い確率と精度で市場に参入できるようになりました。矢印が表示された後、ターゲットに達する (利益確定) か反転シグナルが表示されるまで、ローソク足を色付けする機能もあります。 STOP LOSS / TAKE PROFITゾーンの表示 エントリーポイントを検索する際の視覚的な明瞭さを改善するために、市場に参入するための最適なポイントが検索される買い/売りゾーンを最初に表示するモジュールが作成されました。ストップロスレベルを操作するための追加のインテリジェントロジックは、時間の経過とともにそのサイズを縮小するのに役立ち、その結果、取引を開始するとき(move sl)の初期リスクを軽減しま
    FX Volume
    Daniel Stein
    4.6 (35)
    FX Volume:ブローカー視点で捉える本物の市場センチメント クイック概要 トレード手法をさらに高めたいとお考えですか? FX Volume は、リテールトレーダーやブローカーのポジション状況をリアルタイムで提供します。これは、COTのような遅延レポートよりもはるかに早く知ることができます。安定した利益を目指す方も、さらなる優位性を求める方も、 FX Volume は大きな不均衡を見極め、ブレイクアウトを確認し、リスク管理を洗練させるのに役立ちます。今すぐ始めて、実際の出来高データがどのように意思決定を変革するかを体感してください! 1. FX Volume がトレーダーにとって非常に有益な理由 高精度の早期警戒シグナル • 各通貨ペアを売買しているトレーダー数を、他者よりも早く、ほぼリアルタイムで把握できます。 • FX Volume は、複数のリテールブローカーから得られる本物の出来高データを収集し、分かりやすい形式で提供する 唯一 のツールです。 強力なリスク管理 • ロングやショートの大きな偏り(インバランス)を特定し、潜在的なトレンド転換を見逃しません。ストップ
    Dynamic Forex28 Navigator - 次世代の Forex 取引ツール。 現在 49% オフ。 Dynamic Forex28 Navigator は、長年人気のインジケーターを進化させたもので、3 つの機能を 1 つにまとめています。 Advanced Currency Strength28 インジケーター (レビュー 695 件)  + Advanced Currency IMPULSE with ALERT (レビュー 520 件) + CS28 コンボ シグナル (ボーナス)。 インジケーターの詳細 https://www.mql5.com/en/blogs/post/758844 次世代の Strength インジケーターが提供するもの  オリジナルで気に入っていたすべての機能が、新機能と精度の向上によって強化されました。 主な機能: 独自の通貨強度計算式。 すべての時間枠でスムーズかつ正確な強度ライン。 トレンドの特定と正確なエントリーに最適です。 ダイナミックマーケットフィボナッチレベル (マーケットフィボナッチ)。 このインジケーターに固有
    Special offer! https://www.mql5.com/ru/users/bossik2810 Trend Arrow Super The indicator not repaint or change its data. A professional, yet very easy to use Forex system. The indicator gives accurate BUY\SELL signals. Trend Arrow Super is very easy to use, you just need to attach it to the chart and follow simple trading recommendations. Buy signal: Arrow + Histogram in green color, enter immediately on the market to buy. Sell signal: Arrow + Histogram of red color, enter immediately on the m
    After your purchase, feel free to contact me for more details on how to receive a bonus indicator called VFI, which pairs perfectly with Easy Breakout for enhanced confluence!   Easy Breakout is a powerful price action trading system built on one of the most popular and widely trusted strategies among traders: the Breakout strategy ! This indicator delivers crystal-clear Buy and Sell signals based on breakouts from key support and resistance zones. Unlike typical breakout indicators, it levera
    !SPECIAL SALE!  The All-in-One Trade Indicator (AOTI) determines daily targets for EURUSD, EURJPY, GBPUSD, USDCHF, EURGBP, EURCAD, EURAUD, AUDJPY, GBPAUD, GBPCAD, GBPCHF, GBPJPY, AUDUSD, and USDJPY. All other modules work with any trading instruments. The indicator includes various features, such as Double Channel trend direction, Price channel, MA Bands, Fibo levels, Climax Bar detection, and others. The AOTI indicator is based on several trading strategies, and created to simplify market analy
    ヒット率トップボトムシグナル ヒット率トップボトムシグナル ヒット率トップボトムシグナル は、完全に革新的なアプローチを提供します。 特定のTP-SLとPAIRS/TFで最も優れたパフォーマンスを発揮する方法を事前に評価したい方に理想的です。 ヒット率トップボトムシグナル 戦略は、 すべてのトレーダーとトレードスタイル にとって基本的なツールです。これは、 リペイントしない精度の高いシグナル を提供し、どのタイミングでどの方向に取引するかを明確に示すだけでなく、各通貨ペアとTFの ヒット率を詳細に記録 し、あらかじめ設定されたテイクプロフィット(TP)とストップロス(SL)を提供するためです。 これにより、シグナルの有効性の比率を事前に知ることができ 、リスク管理と正確な取引に非常に重要です。 この戦略の特徴は、全体的な動きではなく、インパルス内のリバーサルポイントの検出に焦点を当てている点で、従来のトップボトムよりも頻繁にシグナルが発生し、 市場の重要な各変動のキーとなる瞬間に焦点を当てています。 このシグナルの歴史的な効果を%で表示する SL/TP比率との組み合わせ により、こ
    Special offer! https://www.mql5.com/ru/users/bossik2810 System Trend Pro - This is the best trend trading indicator!!! The indicator no repaint!!!  The indicator has   MTF   mode, which adds confidence to trading on the trend (   no repaint   ). How to trade? Everything is very simple, we wait for the first signal (big arrow), then wait for the second signal (small arrow) and enter the market in the direction of the arrow. (See screens 1 and 2.) Exit on the opposite signal or take 20-30 pips,
    Advanced version of CyberZingFx Volume Plus, the ultimate MT4 indicator for traders seeking highly accurate buy and sell signals. With an additional strategy and price action dot signals that enhances its effectiveness, this indicator offers a superior trading experience for professionals and beginners alike. The CyberZingFx Volume Plus Advanced version combines the power of volume analysis and historical price data with an additional strategy, resulting in even more precise and reliable signals
    Special offer! https://www.mql5.com/ru/users/bossik2810 Gold AMS   - is a good technical stock indicator. The indicator algorithm analyzes the asset price movement and reflects volatility and potential entry zones. The indicator 100% does not repaint!!! The best indicator signals: If a signal appears, it does not disappear! Unlike indicators with redrawing, which lead to loss of deposit, because they can show a signal and then remove it. Trading with this indicator is very easy. We wait for a
    現在26%オフ 初心者やエキスパートトレーダーに最適なソリューション! このインジケーターは、独自の機能と新しい計算式を取り入れた、ユニークで高品質、かつ手頃な価格のトレーディングツールです。たった1枚のチャートで28の為替ペアの通貨強度を読み取ることができます。新しいトレンドやスキャルピングチャンスの引き金となるポイントを正確に特定することができるので、あなたのトレードがどのように改善されるか想像してみてください。 ユーザーマニュアルはこちら  https://www.mql5.com/en/blogs/post/697384 これが最初の1本、オリジナルだ! 価値のないクローンを買わないでください。 特別な サブウィンドウの矢印で強い通貨の勢いを表示 GAPがあなたのトレードを導く! 基準通貨や気配値が売られすぎ・買われすぎのゾーン(外相フィボナッチレベル)にあるとき、個別チャートのメインウィンドウに警告表示。 通貨がレンジの外側から反落した場合、プルバック/リバーサルのアラート。 クロスパターンの特別なアラート 複数の時間枠を選択可能で、トレンドを素早く確認できます
    IQ Gold Gann Levels a non-repainting, precision tool designed exclusively for XAUUSD/Gold intraday trading. It uses W.D. Gann’s square root method to plot real-time support and resistance levels, helping traders spot high-probability entries with confidence and clarity. William Delbert Gann (W.D. Gann) was an exceptional market analyst, whose trading technique was based on a complex blend of mathematics, geometry, astrology, and ancient mathematics which proved to be extremely accurate. Download
    Introducing the Delta Volume Profile Indicator - Unleash the Power of Institutional Precision!  https://youtube.com/shorts/znUdz5PEBAY Technical Indicator: Are you ready to trade like the pros? The Delta Volume Profile Indicator is no ordinary tool. It’s a high-precision, cutting-edge indicator that puts the power of institutional-grade trading in your hands. This unique indicator analyses delta volume distribution in real-time, revealing the market's hidden buy/sell imbalances that the biggest
    Volatility Trend System - a trading system that gives signals for entries. The volatility system gives linear and point signals in the direction of the trend, as well as signals to exit it, without redrawing and delays. The trend indicator monitors the direction of the medium-term trend, shows the direction and its change. The signal indicator is based on changes in volatility and shows market entries. The indicator is equipped with several types of alerts. Can be applied to various trading ins
    TrendMaestro
    Stefano Frisetti
    4 (4)
    note: this indicator is for METATRADER4, if you want the version for METATRADER5 this is the link:  https://www.mql5.com/it/market/product/108106 TRENDMAESTRO ver 2.4 TRENDMAESTRO recognizes a new TREND in the bud, he never makes mistakes. The certainty of identifying a new TREND is priceless. DESCRIPTION TRENDMAESTRO identifies a new TREND in the bud, this indicator examines the volatility, volumes and momentum to identify the moment in which there is an explosion of one or more of these data a
    現在31%オフ! 初心者やエキスパートトレーダーに最適なソリューション! このインジケータは、独自の機能と秘密の数式を組み込んだ、ユニークで高品質かつ手頃な価格のトレーディングツールです。たった1枚のチャートで28の通貨ペアのアラートを表示します。新しいトレンドやスキャルピングチャンスの引き金となるポイントを正確に把握することができるので、あなたのトレードがどのように改善されるか想像してみてください! 新しい基本的なアルゴリズムに基づいて構築されているため、潜在的な取引の特定と確認がより簡単になります。これは、通貨の強さや弱さが加速しているかどうかをグラフィカルに表示し、その加速のスピードを測定するためです。加速すると物事は明らかに速く進みますが、これはFX市場でも同じです。つまり、反対方向に加速している通貨をペアにすれば、利益を生む可能性のある取引を特定することができるのです。 通貨の勢いを示す縦の線と矢印は、あなたの取引の指針となるでしょう。 ダイナミックマーケットフィボナッチ23レベルはアラートトリガーとして使用され、市場の動きに適応します。もしインパルスが黄色のトリガ
    Take Your Trading Experience To the Next Level ! and get the exclusive TFSR-Analyzer for free !    So you have all these outstanding features  on up to 20 symbols and all timeframes in a smart and clear Design. Correct identification of the trends  in stock investments are pivotal and TrendFollowerSR ensures this perspective while displaying the correct trend on multiply timeframes to help you go long way as much as possible. The latest technology of the Indicator enables to track whether if a
    もしあなたがFX取引をしているなら、通貨の強さと通貨ペアの相関関係に関する詳細な情報を持つことは、取引パフォーマンスを飛躍的に向上させることができます。相関関係を活用すればリスクを半減でき、強さの分析を活用すれば利益を最大化することが可能です。 このインジケーターは、通貨の強さ分析と通貨ペアの相関関係を組み合わせたハイブリッドなアプローチにより、最適な通貨ペアを選択するサポートをします。 通貨の強さ分析の使い方 例えば、あなたの取引戦略でAUD/JPYの買いシグナルが出たとします。しかしKTの通貨強さ分析を使うと、JPYがAUDよりも強くなっていることがわかりました。この場合、その取引は損失に終わる可能性が高いです。このインジケーターがあれば、そのような損失を未然に防ぐことができます。 通貨ペア相関関係の使い方 例えば、NZD/USDとGBP/JPYの同時売りシグナルが出たとします。KTの通貨ペア相関ツールを使うと、これらのペアの相関率が77%であることが判明します。  これらのペアは強く相関しているため、同時に取引するとリスクが二重になります。もしNZD/USDで損失が出れば、
    - 50% OFF - Telegram group : https://t.me/+5RIceImV_OJmNDA0 MT5 version : https://www.mql5.com/en/market/product/85917?source=Site+Market+Product+Page Master Pullback is a complete system that gives unique trading opportunities and a clear indication of the market: trend, signals as well as stop loss and take profit levels. This system has been designed to be as simple as possible and detects extreme overbought and oversold zones, support and resistance levels, as well as the major trend. You p
    Enigmera
    Ivan Stefanov
    5 (7)
    ENIGMERA: 市場の中心 重要:MQL5.comのデモはStrategy Testerで実行されており、Enigmeraの機能を完全には反映していない場合があります。詳細については、説明、スクリーンショット、ビデオをご確認ください。質問があれば、遠慮なくメッセージを送ってください! インジケーターのコードは完全に書き直されました。バージョン3.0は新機能を追加し、インジケーターの開始以来蓄積されたバグを修正しました。 紹介 このインジケーターとトレーディングシステムは、金融市場への注目すべきアプローチです。ENIGMERAはフラクタルサイクルを使用して、サポートとレジスタンスのレベルを正確に計算します。真の蓄積フェーズを示し、方向と目標を提供します。トレンドでも修正でも機能するシステムです。 動作方法 インジケーターのほとんどの機能は、チャートの左側にあるボタンで制御され、市場の状況に迅速に対応できるようになっています。 ボタン ON/OFF – インジケーター全体を表示または非表示にします。 Channel – サポートチャネルを有効にし、許容範囲の偏差を示します。 Dev
    作者のその他のプロダクト
    !SPECIAL SALE! An exclusive indicator that utilizes an innovative algorithm to swiftly and accurately determine the market trend. The indicator automatically calculates opening, closing, and profit levels, providing detailed trading statistics. With these features, you can choose the most appropriate trading instrument for the current market conditions. Additionally, you can easily integrate your own arrow indicators into Scalper Inside Pro to quickly evaluate their statistics and profitability
    !SPECIAL SALE!  The All-in-One Trade Indicator (AOTI) determines daily targets for EURUSD, EURJPY, GBPUSD, USDCHF, EURGBP, EURCAD, EURAUD, AUDJPY, GBPAUD, GBPCAD, GBPCHF, GBPJPY, AUDUSD, and USDJPY. All other modules work with any trading instruments. The indicator includes various features, such as Double Channel trend direction, Price channel, MA Bands, Fibo levels, Climax Bar detection, and others. The AOTI indicator is based on several trading strategies, and created to simplify market analy
    The Trend Forecaster indicator utilizes a unique proprietary algorithm to determine entry points for a breakout trading strategy. The indicator identifies price clusters, analyzes price movement near levels, and provides a signal when the price breaks through a level. The Trend Forecaster indicator is suitable for all financial assets, including currencies (Forex), metals, stocks, indices, and cryptocurrencies. You can also adjust the indicator to work on any time frames, although it is recommen
    !SPECIAL SALE! The Reversal Master is an indicator for determining the current direction of price movement and reversal points. The indicator will be useful for those who want to see the current market situation better. The indicator can be used as an add-on for ready-made trading systems, or as an independent tool, or to develop your own trading systems. The Reversal Master indicator, to determine the reversal points,  analyzes a lot of conditions since the combined analysis gives a more accura
    フィルタ:
    elabet78
    26
    elabet78 2023.08.08 22:08 
     

    Great product. Looking forward to get other indicators. Thanks.

    MILAD NAJJARI
    146
    MILAD NAJJARI 2022.05.03 14:24 
     

    many wrong signal !

    Alexey Minkov
    12752
    開発者からの返信 Alexey Minkov 2022.05.03 16:12
    Hi. I think you just did not fully understand the functionality of the indicator. There is a detailed article on my blog about the indicator and its application in practice, with examples. I also want to draw your attention to the fact that my clients are never left without my support and assistance. You can read about this in other reviews. But instead of writing me a personal message with questions about the indicator, you prefer immediately to write negative feedback. This does not look like an attempt to understand how the indicator works and how to use it correctly. Nevertheless, I am sending you many examples of working with the indicator and I sincerely recommend studying them. I believe in you that with practice you will succeed, if, of course, you are interested!
    Gary Gee
    264
    Gary Gee 2022.03.04 07:04 
     

    More people should buy the Color Trend FX indicator. If you use it when the market is moving up and down and not going sideways, it provides great entry and exit points for trades. I'm using this indicator in conjunction with the AOTI indicator to decide when to enter and exit trades. This is a sleeper indicator that a lot of people have missed. I found a bug in the indicator. Alex fixed the bug right away. Alex provides great support.

    Alexey Minkov
    12752
    開発者からの返信 Alexey Minkov 2022.05.03 16:11
    Thank you so much for the review! ❤️ I'm glad you like my product. And I’m very appreciated such kind words about my person. It's very important to me that my experience benefits not only me, and I'm happy to share it with my clients and friends! That's the real power – doing what you love and share it with the friends and like-minded people.
    Joshua Mangold
    412
    Joshua Mangold 2017.12.27 07:12 
     

    This is my favorite indicator, would recommend. Very well done Alex!

    Alexey Minkov
    12752
    開発者からの返信 Alexey Minkov 2022.05.03 15:57
    Thank you for your review and your kind words! ❤️ I'm glad you like my product.
    レビューに返信
    バージョン 2.0 2025.01.14
    ▪ Added possibility of simultaneous installation of several indicators with different settings
    ▪ Other improvements in the indicator code
    バージョン 1.91 2023.08.28
    ▪ Improvement of internal algorithms of the indicator
    バージョン 1.9 2023.01.17
    ▪ Improvement of internal algorithms of the indicator
    バージョン 1.8 2022.04.04
    ▪ Fixed the moving of the information panel on the chart
    バージョン 1.7 2022.04.01
    ▪ Updating and improving the internal algorithms of the indicator
    バージョン 1.6 2022.03.27
    ▪ Adapting the indicator to actual builds of the terminal

    ▪ Added the ability to change the sensitivity of the trend ending detection module

    ▪ The parameters of the trend ending detection module are placed in external buffers (Buy Exit - Buffer 2, Sell Exit - Buffer 3)
    バージョン 1.5 2021.06.29
    ▪ Scheduled compilation for the current build of the terminal
    バージョン 1.4 2017.11.30
    * Indicator's logic upgrade,
    * Added filter by time,
    * Some minor changes.
    バージョン 1.2 2017.04.25
    * Important update: added the ability to determine the exit points

    * Ability to move the comment area on the price chart