RiveR Scope
- インディケータ
- Ruslan Losin
- バージョン: 1.31
- アップデート済み: 18 7月 2018
- アクティベーション: 5
RiverScope automatically determines the nearest most important price levels and support and resistance zones in history, it also identifies a large number of price action patterns (30+).
The support and resistance levels are determined based on an algorithm that calculates and filters the historical values of the price, its movement character, volumes, etc. It displays the current situation, therefore the nearest levels change in real time depending on the current price.
Advantages
- flexible customization of timeframes for calculating the main and additional support and resistance zones
- convenient display of the zones and levels on the chart
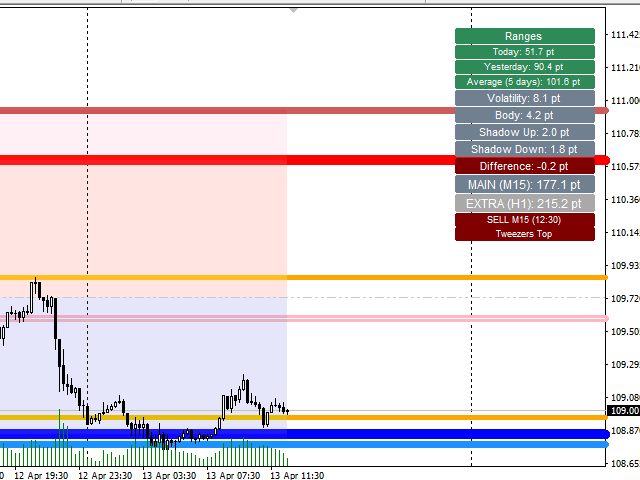
- display of the information about the range in points for the main and additional zones
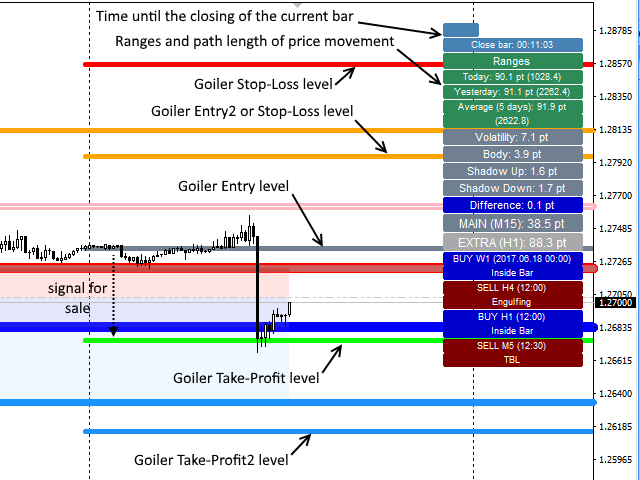
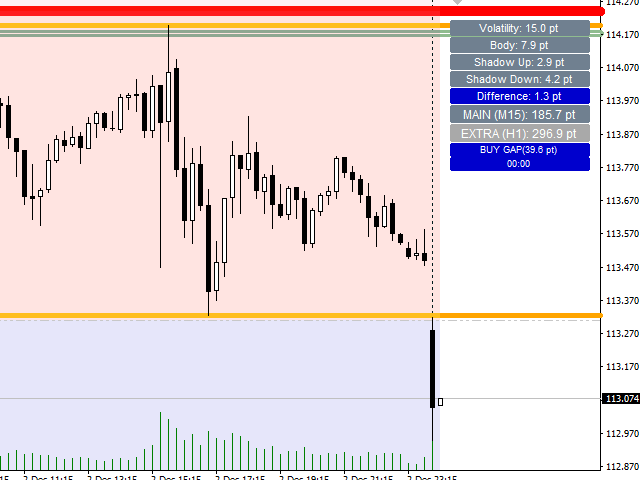
- output of the information about the current market situation (average volatility, size of the candle body, its upper/lower wick and their difference, which indicates the probable direction of the price using colors: Bullish - blue, Bearish - red)
- information of the price movement: ranges and path passed during the current day, the previous day and average for 5 days
- comfortable display of time until the current candle closes
- determines the gaps and displays information on the number of points before it "closes" in real time
- easily identifies 30+ candlestick patterns of price action (with additional filtering)
- convenient display of information about patterns and gaps: bullish ones have blue color, bearish - red
- Goiler levels, which based on the principles of analysis by Gann, provide additional information on trades or strong levels.
- The Goiler levels show the probability of trade direction: if the light green line is above the dark gray line, it is a buy signal, if lower — sell signal. Light green - take profit, blue - take profit 2, red - stop loss, orange - either stop loss or (depending on the market situation) the market entry point.
- The Goiler levels can also be used similar to all other support/resistance levels (because the levels are strong enough, i.e. trade either level rebounds or breakouts.
Settings
- Main options -
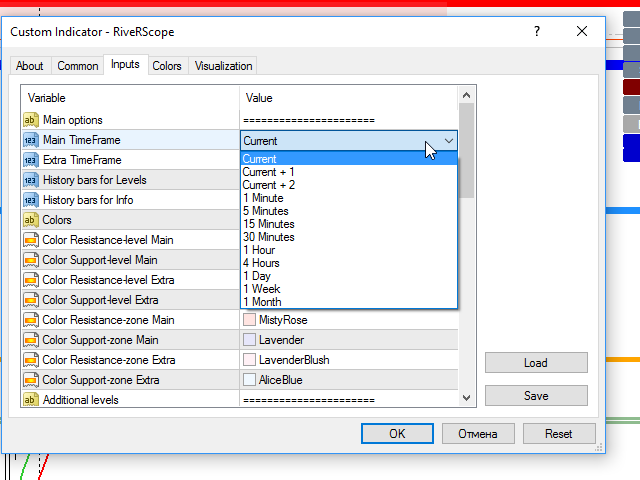
- Main TimeFrame - select the timeframe for calculation of the MAIN support and resistance zones:
- Current - current timeframe
- Current + 1 - current timeframe + 1
- Current + 2 - current timeframe + 2
- 1 Minute - fixed timeframe selection
- ...
- 1 Month
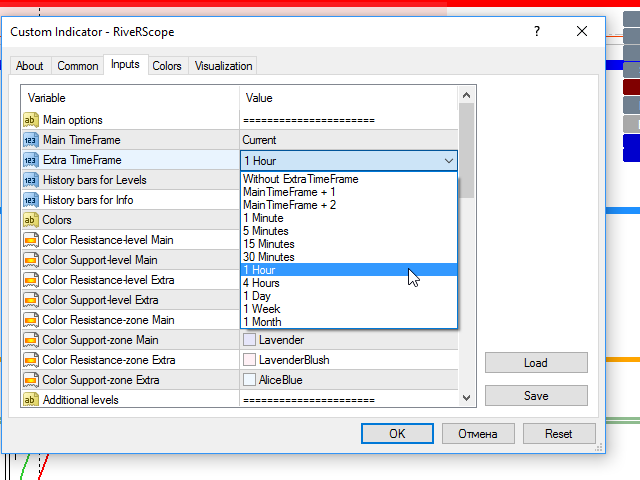
- Extra TimeFrame - select the timeframe for calculation of the ADDITIONAL support and resistance zones:
- Without ExtraTimeFrame - do not use the ADDITIONAL support and resistance zones
- MainTimeFrame + 1 - MAIN timeframe + 1
- MainTimeFrame + 2 - MAIN timeframe + 2
- 1 Minute - fixed timeframe selection
- ...
- 1 Month
- History bars for Levels – the number of bars to calculate the support and resistance areas (500 recommended)
- History bars for Info – the number of bars to calculate the information about the current market situation (50 recommended)
- Path length price - enable/disable the information on price path
- Colors -
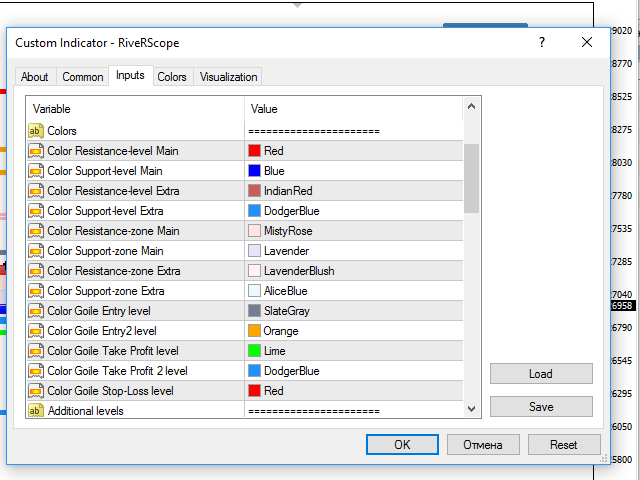
- Color Resistance-level Main - the color of the MAIN resistance level
- Color Support-level Main - the color of the MAIN support level
- Color Resistance-level Extra - the color of the ADDITIONAL resistance level
- Color Support-level Extra - the color of the ADDITIONAL support level
- Color Resistance-zone Main - the color of the MAIN resistance zone
- Color Support-zone Main - the color of the MAIN support zone
- Color Resistance-zone Extra - the color of the ADDITIONAL resistance zone
- Color Support-zone Extra - the color of the ADDITIONAL support zone
- Color Goile Entry level - color of the entry level (by Goiler)
- Color Goile Entry2 level - color of the second entry or stop loss level (by Goiler)
- Goile Take Profit level - color of the take profit 1 level (by Goiler)
- Goile Take Profit 2 level - color of the take profit 2 level (by Goiler)
- Goile Stop-Loss level - color of the stop loss level (by Goiler)
- Additional levels -
- Bank-level - enable/disable the bank level
- Min/Max price previous day - enable/disable the min/max price level of the previous day
- Goiler-level (analize Gann) - enable/disable the Goiler levels
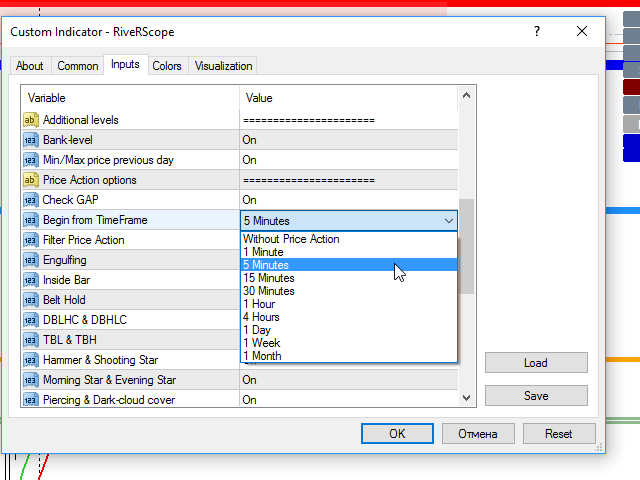
- Price Action options -
- Check GAP - enable/disable the gap control
- Begin from TimeFrame - select the timeframe to start identifying the patterns (not related to the chart timeframe)
- Without Price Action - disable the pattern recognition block
- 1 Minute - select the timeframe
- ..
- 1 Month
- Filter Price Action - enable/disable pattern filtering
- List of patterns with the ability to enable/disable each:
- Engulfing
- Inside Bar
- Belt Hold
- Rails
- DBLHC & DBHLC
- TBL & TBH
- Pin Bar
- Hammer
- Shooting Star
- Morning Star
- Evening Star
- Piercing
- Dark-cloud cover
- Doji
- Tweezers Top & Bottom
- Key Reversal
- Open-Close Reversal
- Hook Reversal
- Island Reversal
- Pivot Point Reversal
- Closing Price Reversal
- 4B1B Pivot
- Complex Pivot Point
- Move-Congestion-Move?
- Three Inside Up & Down
- Kicker
- Three BlackCrows & WhiteSoldiers
- Three Line Strike
- Abandoned Baby Top & Bottom
- Three Outside Up & Down
- Stick Sandwich
- Squeeze Alert
- Rising & Falling Three Method
Added integration with RiveRControl
The product will be improved and supplemented. If you have questions or suggestions please send me a message.
















Okay I never comment But I have too here I have used this for about 5 years, just came back into mql5 to look for something and thought i would look at the comments here ,,,,, I cannot believe no one has said how good this is I am now a funded trader and i still use this ever day it draws the support area's in real time all the time ... that why they change all the time and that is what you need to stop you taking a trade in front of a resistance area and the Goile trade on Gold ... i have paid for this indi a 1000 times can not believe no one else has taken the time to say this From the bottom of my heart Thank you Ruslan for your work I love it