Close MT4 Script by PipTick
- ユーティリティ
- Michal Jurnik
- バージョン: 1.1
- アップデート済み: 3 12月 2021
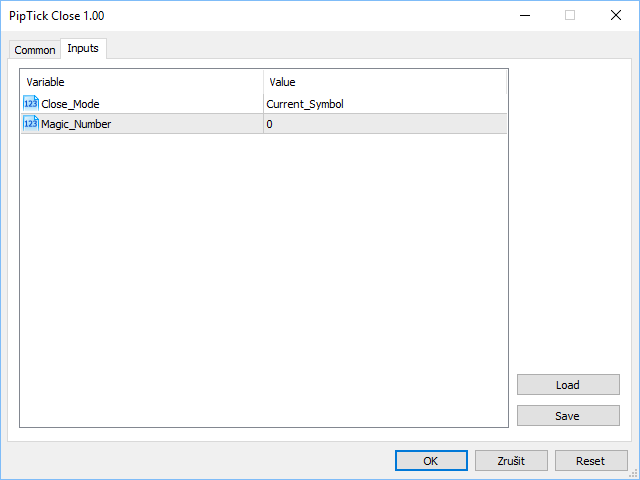
The Close script is a simple tool that allows traders to close their trades by three methods. Just run the script and choose the close method.
Closing methods
- Symbol - Allows closing all open trades for a specific symbol.
- All_Trades - Allows closing all open trades.
- Magic_Number - Allows closing all open trades according to their magic number.
Recommendation
- AutoTrading functions must be activated. If the AutoTrading function is disabled, the script will not work.
- EA should be stopped. If you are using an Expert Advisor, you should remove it before running the script.
Main features
- Three closing methods.
- Straightforward script.
- Available for MT4 and MT5.
Please visit the Close script product page for the input parameters settings.
ユーザーは評価に対して何もコメントを残しませんでした