Equity Curve MT4 Indicator by PipTick
- ユーティリティ
- Michal Jurnik
- バージョン: 1.1
- アップデート済み: 3 12月 2021
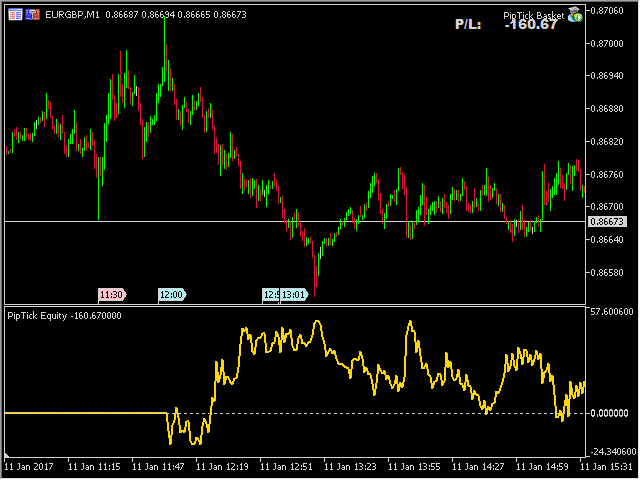
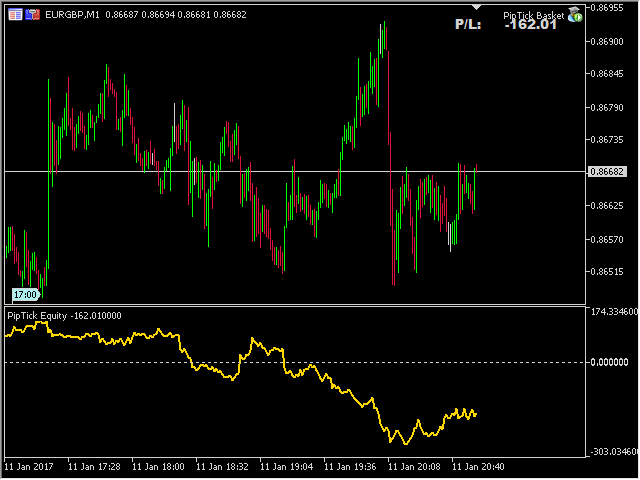
The Equity Curve indicator is a simple and helpful tool that shows the development of the equity curve in real time.
For precision measurement, it should be used in a separate window with a period of M1.
Main features
- The indicator shows the development of the equity curve in real time.
- High precision on the minute chart.
- High-speed calculation.
- Available for MT4 and MT5.

Very nice, but missing consideration of the commission.