バージョン 7.70
2024.10.01
2024.10.01:
[+] Show OPENED deals: "Trend lines without arrows" mode (affects close arrows as well)
バージョン 7.69
2024.06.14
2024.06.13 (7.69):
[+] Separate color for profit labels
バージョン 7.68
2023.01.22
[*] Multiple blinking is fixed on new trades
バージョン 7.66
2021.04.20
2021.01.21 (7.64):
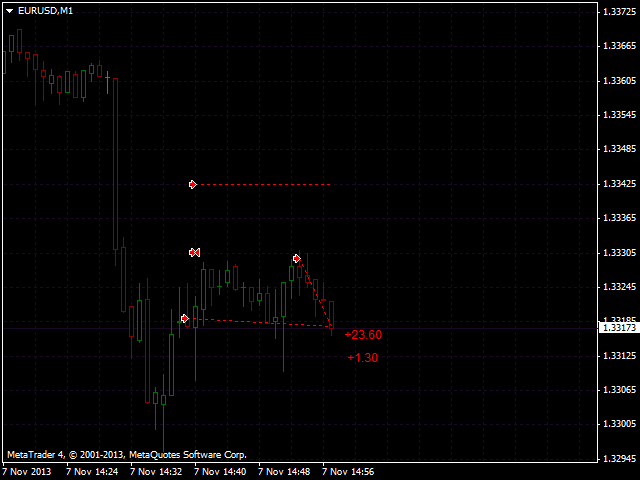
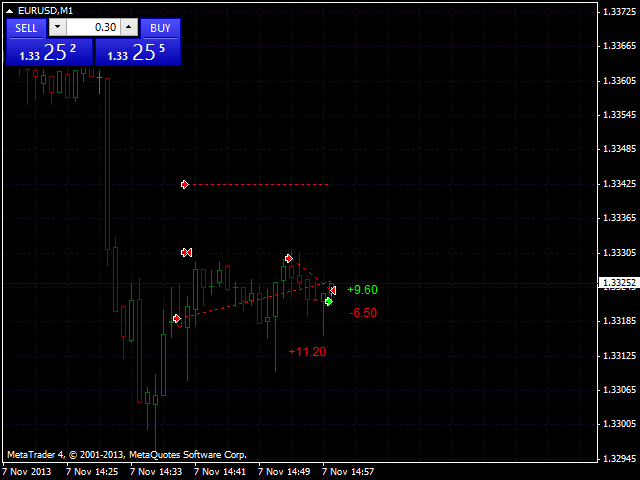
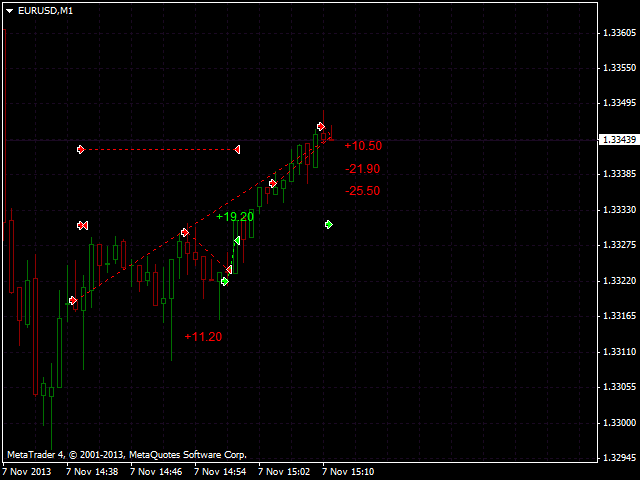
[+] Aggregate profit for opened positions
[*] Bug fixes
2021.01.23 (7.65):
[*] Opened profit labels set correctly on rescale
[*] Drawing of history profits doesn't freeze the terminal
2021.03.31 (7.66):
[+] Aggregate profit for closed positions
[+] Summary lot for opened positions
バージョン 7.63
2021.01.19
2021.01.19 (7.63):
[*] Profit in points fixed
[*] Lines color fixed
バージョン 7.52
2018.12.18
- Open positions profit color changes correct
- BreakEven: both BUY and SELL levels modes
バージョン 7.50
2018.10.04
- New open deals drawing style: Horizontal lines like in MT
- Aggregated BreakEven level for buys and sells (if both are opened and lots are different)
- History profit labels do not intersect
バージョン 7.20
2017.04.04
1) When displaying spread as a rectangle (Rectangle), its width is selected automatically depending on the chart scale.
2) Added the ability to display spread as a text (in points).
3) Added selection of the breakeven levels display mode ("BreakEven type"):
- Using a horizontal line across the entire chart,
- Using a short horizontal line on the right side of the chart,
- Using a price label.
4) Added color settings for the breakeven levels of buy and sell positions ("BreakEven color for BUYs" and "BreakEven color for SELLs").
5) Added the buttons for managing spread visualization and breakeven levels:
- If spread/breakeven display is disabled in the settings, the button is used for switching the modes (handy for quick reference and selecting the appropriate mode),
- If spread/breakeven display is enabled in the settings, the button enables/disables spread or breakeven.
バージョン 7.10
2017.03.02
1) Added ability to visualize the current spread in four different ways:
- Horizontal lines throughout the entire chart (Bid, Ask, line width and style are configurable),
- Short horizontal lines to the right of the chart (the settings are the same),
- Price labels (colors and size are configurable),
- Rectangle (a color (Average color) and rectangle width in bars (Width) are configurable).
2) Added settings for the open arrows (BUYs open arrows and SELLs open arrows).
3) Changed default colors for loss-making trades.
バージョン 7.8
2017.02.16
- The swaps and commissions are now taken into account in calculation of the breakeven levels
- Fixed the display of profit in points and percentages for cent accounts
バージョン 7.6
2017.02.13
- Added display of breakeven levels for buy and sell trades ("BreakEven lines width" and "BreakEven lines style" parameters)
バージョン 7.5
2016.10.19
- Added display of the expiration time for pending orders (if specified) as a line (parameters "Expiration lines width" and "Expiration lines style") with a text comment ("Expiration comment").
The tooltip can display both the exact expiration time and the time left before that moment.
- Fixed the display of pending orders, if display of open positions is enabled.
バージョン 7.4
2016.09.22
- Added ability to select a button connection corner (Control buttons corner)
- Changed profit display for opened positions
バージョン 7.3
2016.08.19
Fixed indicator loading error in case there are buttons (e.g. when using a template with a saved indicator).
バージョン 7.2
2016.06.14
Added settings that allow you to configure the width and style of lines and dashes:
- "Open-Close lines width" / "Open-Close lines style" — the width and style of lines between the open and close of a trade (0 - hide the lines)
- "Show SL and TP dashes" — flag of display of SL and TP dashes
- "SL and TP vertical lines width" / "SL and TP vertical lines style" — the width and style of lines between the open point and SL/TP (0 - hide the lines)
バージョン 7.1
2016.06.03
1. Added handling of custom chart events (CHARTEVENT_CUSTOM) to enable interaction with other programs.
The description of commands and an example are available in comments to the product: https://www.mql5.com/en/market/product/2050#!tab=comments&page=7&comment=2450290
2. New parameter "Max history deals", using which you can limit the depth of history to analyze (no limit if set to 0).
バージョン 7.0
2016.04.25
1. Added parameter "Number of digits to show" for selecting the number of decimal places in the displayed profit in points.
2. Added the mode of displaying the profit as a percentage of the account balance.
The balance history of the account is modeled based on the trade history and may be inaccurate.
For the correct calculation of the balance all account history must available (Account History tab - right mouse button - All history).
3. Added buttons for quick selection of the displayed trades. Now it is possible to hide the closed trades, open positions or pending orders in one click.
The button size is adjusted using the "Control buttons size" parameter, it is possible to disable the button display.
4. Added buttons for selecting the displayed profit - in points, in the deposit currency or as a percentage of the balance. All three numbers can be enabled simultaneously.
バージョン 6.5
2016.04.07
1. Sorted the profit icons of the open positions.
2. The profit icons of the open positions, that fall on the same bar, are located below one another.
3. Added the parameter "Custom digits multiplier", which can be used to adjust the profit in points to any value (leave 1 for normal display).
バージョン 6.3
2016.03.28
1. Calculation of profit in points considers the price step.
2. Added parameter "Show profit mode" for selecting the profit display mode:
- display disabled
- profit in the deposit currency
- profit in points
3. Added parameter "Correct 3/5 digits to 2/4 digits", not it is possible to disable the automatic conversion of the profit in points to 2/4 decimal places.
バージョン 6.1
2016.03.04
1. Added the possibility to choose different colors for profits and losses.
2. Added the possibility to display open and close price labels.
バージョン 6.0
2015.11.06
1. Added ability to display only orders and deals having a certain MagicNumber.
2. Added ability to display deals from a csv file.
Save the monitoring service trade history to a csv file, put the file to \data folder\MQL4\Files\ and specify its name when launching iOrders, so that you can see the deals on your terminal's chart. Set a correct time shift relative to GMT for proper display.
バージョン 4.20
2014.09.25
Added the possibility to display profit in points, "Show profit in points" option.
バージョン 4.15
2014.07.28
Added the possibility to display vertical lines from the open price to the Stop Loss and Take Profit levels at the request of a71 (parameter "Show SL and TP vertical lines").


























Very good for tracking your live trades and history. Seller answer to request fast when there was an error.