RSI vs Envelopes Graph
- インディケータ
- Yurij Izyumov
- バージョン: 2.1
- アップデート済み: 26 11月 2021
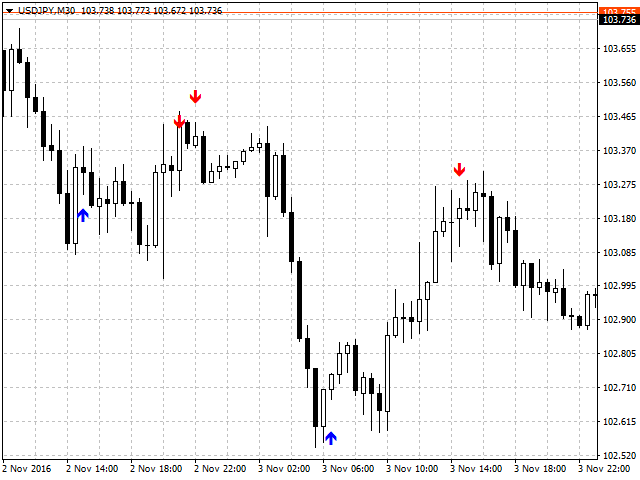
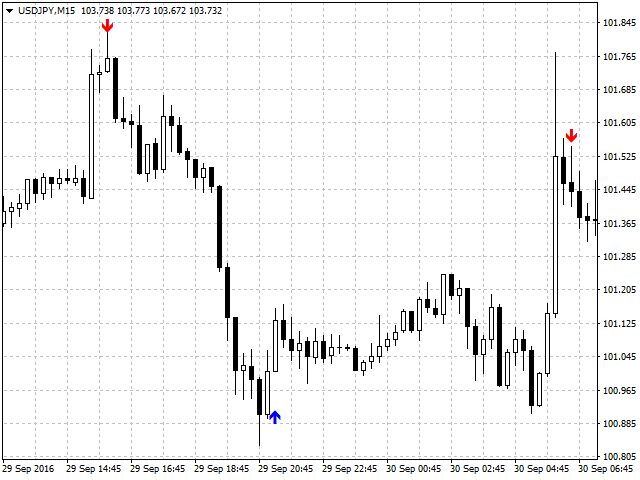
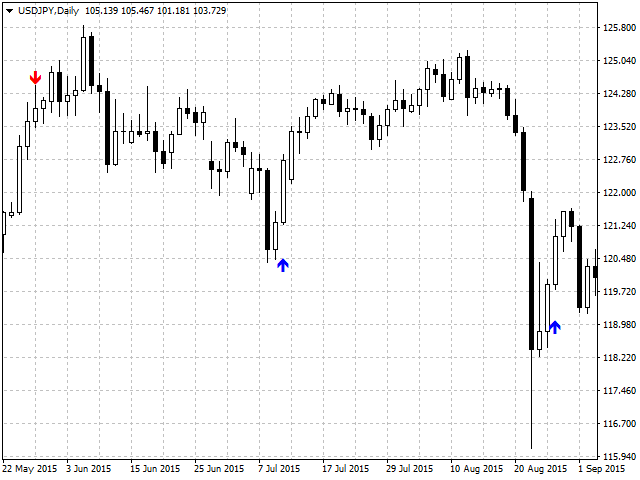
This semaphore indicator is based in the standard RSI, which is applied over the Envelopes indicator that shows an envelope or envelope fluctuation borders. This is a version of RSI vs Envelopes drawn in the symbol window.
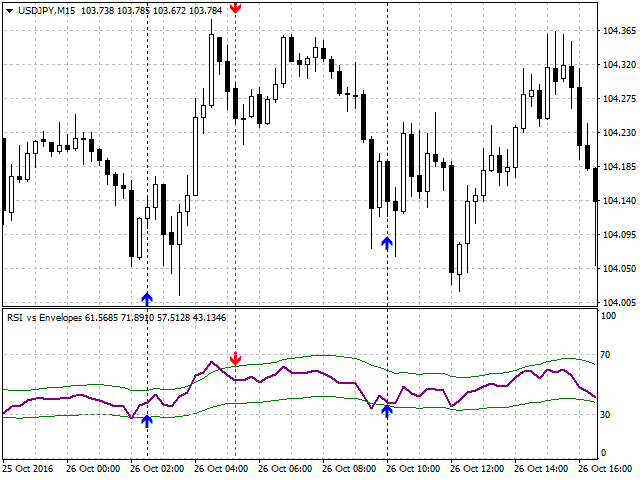
A sell signal emerges when the upper envelope/border is broken by the RSI indicator from top to bottom.
A buy signal emerges when the lower envelope/border is broken by the RSI indicator from bottom upwards.
The indicator can draw arrows on the indicator, draw vertical lines to keep track of where the entry is located on the chart, play a sound alert upon an entry signal, and send push notifications to your mobile.
If you only need signals upon crossing of the RSI indicator and the standard signal levels, use the RSI Alerts indicator.
Settings
- RSI Period - standard RSI period.
- Envelopes Period - indicator period.
- Alert on screen - enable alerts.
- Send Push - enable push-notifications to a mobile.
- Envelopes Method - Envelopes drawing method.
- Applied price - ерк pices used for the indicator calculations.
- Envelopes deviation % - deviation in % (envelope width).
- Shift 0-current bar, 1-first bar - shift of the signal, if =0 - the signal will be searched on a zero candle, if =1 - the signal will be searched on the completed candlestick, and the signal will be produced on the new candlestick opening. The second method (=1) is more reliable.
- Draw Lines - enable/disable.
- RSI color - choose color.
- Envelopes color - choose color.
- Buy arrow color - choose color.
- Sell arrow color - choose color.
Recommendations
If you set "Shift 0-curren bar, 1-first bar" = 0, there is a chance that the signal will not be confirmed and will be redrawn, therefore the recommended value is = 1.
Sometimes it is convenient to watch two indicators RSI vs Envelopes and RSI vs Envelopes Graph both on the same chart.

This is an amazing indicator if used correctly! Also, Yurij is an amazing person! I just asked him a favour and he did it without knowing me before. Thanks Yurij. You are the best!