• 概要
  • レビュー
  • コメント (36)
  • 最新情報

AMD Trend Risk Reward

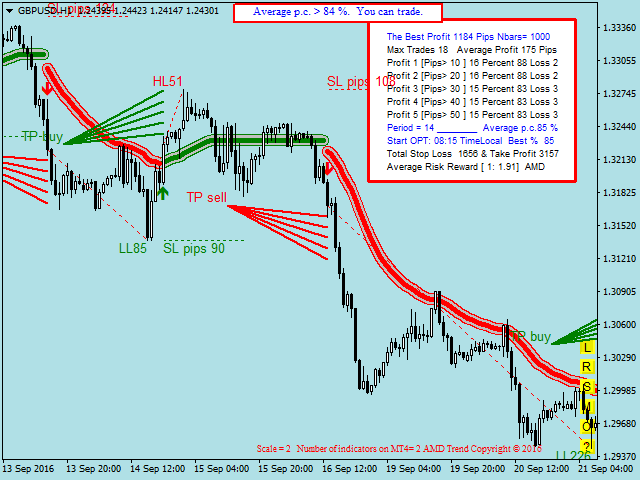
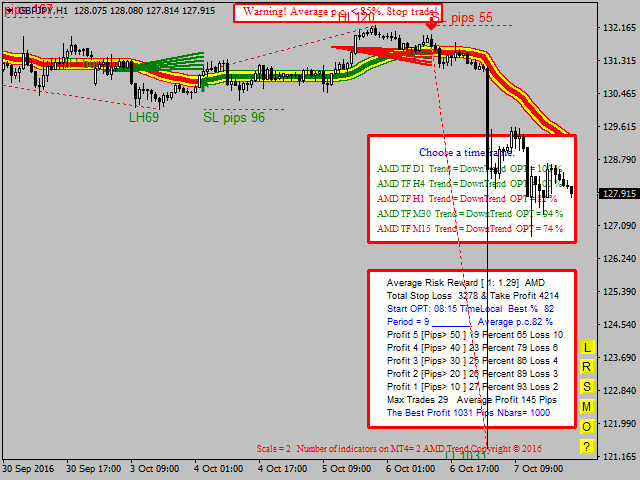
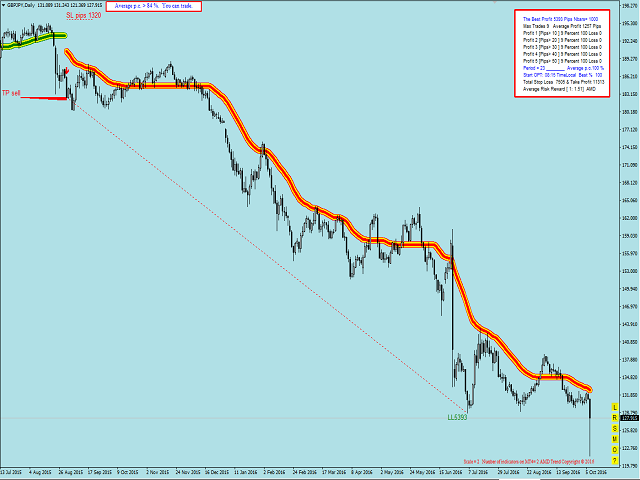
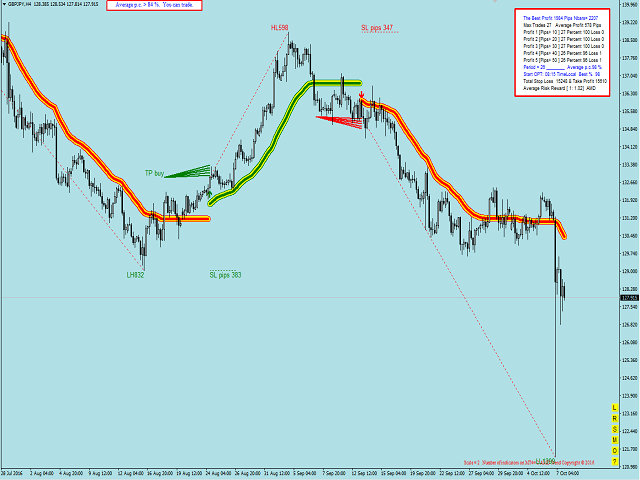
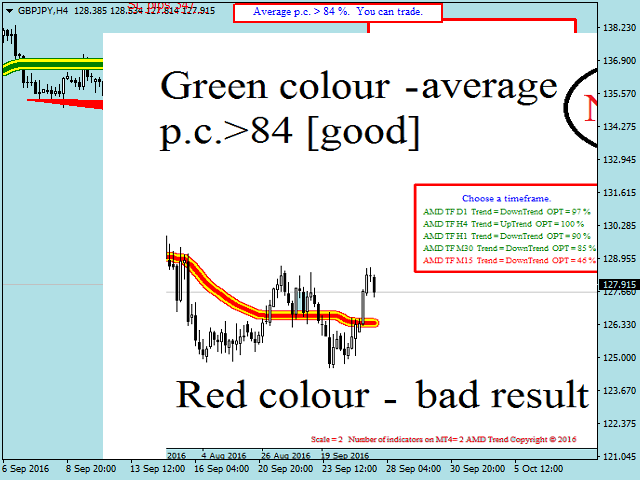
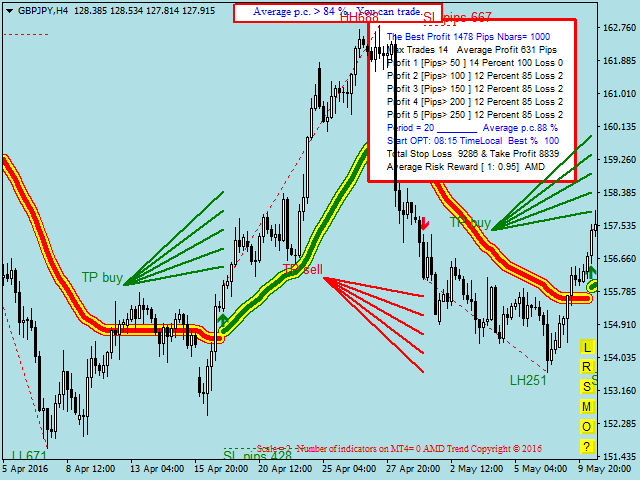
AMD Trend Risk Reward is an indicator which belongs to the group of trend indicators. It provides the possibility to take the correct decisions about timely market entrances or exits. Trend horizontal can cause a lot of headaches to the traders and can be the reason of money loss. By automatic optimizing the settings of our AMD Trend Risk Reward indicator you can avoid most of them and save your money. How to choose the best chart? Press the button [O] on the chart. Indicator automatically optimizes time frame M15, M30, H1, H4 and D1.


Features
  • Very simple
  • Never repaints
  • Never recalculates
  • Automatic Optimization
  • The current trend is not taken into account
  • The main trend in the form of a background (see button[?] on chart)
  • Automatic management of multiple indicators in terms of optimization and use of computer resources
  • Transferring files between your smartphone and indicator and vice versa. Stay updated with indicator - wherever you are
  • Additionally we have: filtering of trend based on the Overbalance, ATR, Detector Consolidation, Push Notifications (current information)


Button On Chart
  • Button [F]: filtering of trend based on the Overbalance
  • Button [C]: enable/disable the fixed scale mode
  • Button [D]: delete indicator
  • Button [1]: method of estimating trends
  • Button [R]: reset
  • Button [S]: size snake
  • Button [M]: money management
  • Button [O]: start optimization from M15 to D1
  • Button [?]: help


Input Parameters
  • ID: chart ID
  • Number of the analyzed bars [Nbars on chart]: e.g. 480 bars H1 = 20 days
  • AMD Trend Period: manual optimization (3,4,5,..28)
  • Detector Consolidation: minimum number of bars in consolidation
  • Show Take Profit: true/false
  • Automatic Optimization: true/false
  • Start Optimization: the local time of a computer, where the client terminal is running
  • Use ATR: true/false
  • Alert: sound alert on chart
  • Push Notifications: Send notification on a mobile phone
  • Push Notifications (current information): Send notification on a mobile phone. Indicator gives exact distance to the line reversal
  • AMD control.csv: Using the defined command types you can create commands in csv file.
  • Email: Send alert via e-mail
  • Profit 1 in pips: enter the value of profit in pips (see screenshot)
  • Profit 2 in pips: enter the value of profit in pips
  • Profit 3 in pips: enter the value of profit in pips
  • Profit 4 in pips: enter the value of profit in pips
  • Profit 5 in pips: enter the value of profit in pips
  • Size digits on chart: only red and green digits
  • Color Trend [background]: default yellow.
  • Sound file (Start Optimization) - Record your own sound effects for indicator
  • Sound file (End Optimization) - Record your own sound effects for indicator


Automatic Optimization
  • Start Automatic Optimization:
    • Automatic Optimization = true (first start)
    • Start Optimization = Time Local (sound "wait.wav")
    • Change Time Frame
    • Button [O] on chart
  • Automatic Optimization doesn't work in strategy tester.


Transferring files

Transferring files between your smartphone and indicator and vice versa. How does this work? Send a command from your smartphone and get screenshots of the chart. Required application that synchronizes and backs up files such as photos, documents, and e-mails between desktops, laptops, servers, and external drives. More details? Please write to me.

Enter the command:

  • 1 = WindowScreenShot and push if candle closed [one-off event]
  • 2 = WindowScreenShot and push if candle closed [continuous event]
  • 3 = WindowScreenShot and push if candle closed [one-off event]+big snake
  • 4 = WindowScreenShot and push if candle closed [continuous event]+big snake
  • 5 = WindowScreenShot and push [one-off event] return 0
  • 6 = TimeFrame M15(15) return 0
  • 7 = TimeFrame M30(30) return 0
  • 8 = TimeFrame H1(60) return 0
  • 9 = TimeFrame H4(240( return 0
  • 10 = TimeFrame D1(1440) return 0
  • 11 = Reset and small snake return 0
  • 0 = Disable
File will be created in the folder MQL4\Files.
おすすめのプロダクト
VR Cub
Vladimir Pastushak
VR Cub は、質の高いエントリーポイントを獲得するためのインジケーターです。このインジケーターは、数学的計算を容易にし、ポジションへのエントリーポイントの検索を簡素化するために開発されました。このインジケーターが作成されたトレーディング戦略は、長年にわたってその有効性が証明されてきました。取引戦略のシンプルさはその大きな利点であり、初心者のトレーダーでもうまく取引することができます。 VR Cub はポジション開始ポイントとテイクプロフィットとストップロスのターゲットレベルを計算し、効率と使いやすさを大幅に向上させます。取引の簡単なルールを理解するには、以下の戦略を使用した取引のスクリーンショットを見てください。 設定、設定ファイル、デモ版、説明書、問題解決方法は、以下から入手できます。 [ブログ] レビューを読んだり書いたりすることができます。 [リンク] のバージョン [MetaTrader 5] エントリーポイントの計算ルール ポジションをオープンする エントリーポイントを計算するには、VR Cub ツールを最後の高値から最後の安値までストレッチする必要があります。
Noize Absorption Index - is the manual trading system that measures the difference of pressure between bears forces and bulls forces. Green line - is a noize free index that showing curent situation. Zero value of index shows totally choppy/flat market.Values above zero level shows how powerfull bullish wave is and values below zero measures bearish forces.Up arrow appears on bearish market when it's ready to reverse, dn arrow appears on weak bullish market, as a result of reverse expectation. S
Indicator for binary options arrow is easy to use and does not require configuration works on all currency pairs, cryptocurrencies buy signal blue up arrow sell signal red down arrow tips do not trade during news and 15-30 minutes before their release, as the market is too volatile and there is a lot of noise it is worth entering trades one or two candles from the current period (recommended for 1 candle) timeframe up to m 15 recommended money management fixed lot or fixed percentage of the depo
これは、キャンドルの終値を予測する指標です。 このインジケータは、主にD1チャートでの使用を目的としていますが. この指標は、従来の外国為替取引とバイナリオプション取引の両方に適しています。 インジケーターは、スタンドアロンのトレーディングシステムとして使用することも、既存のトレーディングシステムへの追加として機能させることもできます。 このインジケーターは、現在のキャンドルを分析し、キャンドル自体の内部の特定の強度係数と、前のキャンドルのパラメーターを計算します。 したがって、この指標は、市場の動きのさらなる方向性と現在のキャンドルの終値を予測します。 この方法のおかげで、この指標は、短期の日中取引だけでなく、中期および長期の取引にも適しています。 インジケーターを使用すると、市場の状況の分析中にインジケーターが生成する潜在的な信号の数を設定できます。 インジケーターの設定には、このための特別なパラメーターがあります。 また、インジケーターは、チャート上のメッセージの形式で、電子メールで、およびPUSH通知の形式で、新しい信号について通知することができます。 購入後は必ず私に書いて
Strong Retracement Points Pro demo edition! SRP (Strong Retracement/Reversal Points) is a powerful and unique support and resistance indicator. It displays the closest important levels which we expect the price retracement/reversal! If all level are broken from one side, it recalculates and draws new support and resistance levels, so the levels might be valid for several days depending on the market! If you are still hesitating to start using this wonderful tool, you can check this link to see h
The new update makes this indicator a complete tool for studying, analyzing and operating probabilistic patterns. It includes: On-chart Multi-asset percentage monitor. Configurable martingales. Twenty-one pre-configured patterns , including Mhi patterns and C3. An advanced pattern editor to store up to 5 custom patterns. Backtest mode to test results with loss reports. Trend filter. Hit operational filter. Martingale Cycles option. Various types of strategies and alerts. Confluence between patte
Was: $249  Now: $99   Market Profile defines a number of day types that can help the trader to determine market behaviour. A key feature is the Value Area, representing the range of price action where 70% of trading took place. Understanding the Value Area can give traders valuable insight into market direction and establish the higher odds trade. It is an excellent addition to any system you may be using. Blahtech Limited presents their Market Profile indicator for the MetaTrader community. Ins
Improved version of the free HMA Trend indicator (for MetaTrader 4) with statistical analysis. HMA Trend is a trend indicator based on the Hull Moving Average (HMA) with two periods. HMA with a slow period identifies the trend, while HMA with a fast period determines the short-term movements and signals in the trend direction. The main differences from the free version: Ability to predict the probability of a trend reversal using analysis of history data. Plotting statistical charts for analyz
To download MT5 version please click  here . This is the exact conversion from TradingView: "WaveTrend [LazyBear]" By "zeusuk3". One of the coolest indicators out there to detect overbought and oversold zones. It can be used as a part of more complicated strategy and for confirming a potential trade setup. There are buffers to use in EAs also. The indicator is loaded light and non-repaint. - You can message in private chat for further changes you need. Thanks for downloading 
The indicator allows you to trade binary options. The recommended time frame is М1 and the expiration time is 1,2,3 minutes. The indicator suitable for auto and manual trading. A possible signal is specified as a arrows above/under a candle. You should wait until the candle closes! Arrows are not re-painted Trade sessions: TOKYO section (Half-end) Currency pairs: USD/JPY Working time frame: M1 Expiration time: 1,2,3 minutes. The indicator also shows good results when using the martingale strateg
FREE
The Th3Eng PipFinite indicator is based on a very excellent analysis of the right trend direction with perfect custom algorithms. It show the true direction and the best point to start trading. With StopLoss point and Three Take Profit points. Also it show the right pivot of the price and small points to order to replace the dynamic support and resistance channel, Which surrounds the price. And Finally it draws a very helpful Box on the left side on the chart includes (take profits and Stop loss
フィボナッチリトレースと拡張ラインツール DiNapoliポイント取引方法とゴールデンセクション取引を使用するトレーダーにとって理想的なMT4プラットフォームのフィボナッチリトレースと拡張ラインツール 主な特長: あなたはフィボナッチリトレースメントの複数のセットを直接描くことができ、重要なリターンポイント間の関係は一目瞭然です。 2.フィボナッチ拡張を描画することができます。 3.フィボナッチフォールドバックとラインの延長は、簡単な観察と数値表示のために左右に動かすことができます。 4.チャートは非常に爽やかな 5.数字キーでサイクルを切り替えることができます。 ファンクションキー: 1。 [戻るを押す、要求に応じて描画する、最大8つのグループにする 2。拡張]を描くには[押す] 3。 \を押すと、現在のサイクルの下にあるすべての拡張機能と折り畳みが削除されます 4。フォールドバックを移動して削除して展開する (1)最初のフォールドバックセットのF5行をクリックします。 一度クリックすると(黄色に変わります)、キーボードのDel
TPA True Price Action indicator reveals the true price action of the market makers through 100% non-repainting signals (except early signals mode) strictly at the close of a candle! TPA shows entries and re-entries, every time the bulls are definitely stronger than the bears and vice versa. Not to confuse with red/green candles. The shift of power gets confirmed at the earliest stage and is ONE exit strategy of several. There are available now two free parts of the TPA User Guide for our custo
Gvs Undefeated Trend   indicator is designed for trend and signal trading. This indicator generates trend signals.  It uses many algorithms and indicators to generate this signal. It tries to generate a signal from the points with the highest trend potential. This indicator is a complete trading product. This indicator does not need any additional indicators.  You can only trade with this indicator. The generated signals are displayed on the graphical screen.  Thanks to the alert features you ca
We present you the indicator "Candle closing counter", which will become your indispensable assistant in the world of trading. That’s why knowing when the candle will close can help: If you like to trade using candle patterns, you will know when the candle will be closed. This indicator will allow you to check if a known pattern has formed and if there is a possibility of trading. The indicator will help you to prepare for market opening and market closure. You can set a timer to create a p
The Volume by Price Indicator for MetaTrader 4 features Volume Profile and Market Profile TPO (Time Price Opportunity). Volume and TPO histogram bar and line charts. Volume Footprint charts. TPO letter and block marker collapsed and split structure charts. Session filtering and grouping. Static, dynamic and flexible range segmentation and compositing methods with relative and absolute visualizations. Graphical layering, positioning and styling options to suit the user's analytic and aesthetic n
This unique multi-currency strategy simultaneously determines the strength of trends and market entry points, visualizing this using histograms on the chart. The indicator is optimally adapted for trading on the timeframes М5, М15, М30, Н1. For the convenience of users, the indicator renders the entry point (in the form of an arrow), recommended take profit levels (TP1, TP2 with text labels) and the recommended Stop Loss level. The take profit levels (TP1, TP2) are automatically calculated for
This is a new strategy for SUPPLY DEMAND areas It is based on a calculation using the tick volume to detect the big price action in market for both bear /bull actions this smart volume action candles are used to determine the supply and demand areas prices in between main supply and demand lines indicate sideway market  up arrows will be shown when prices moves above the main supply and the secondary supply lines Down arrows will be shown when prices moves below the main demand and the secondary
ナイト ゴースト - バイナリ オプションの矢印インジケーター。 これからのあなたの頼もしいアシスタントです! 11 - チャートの再描画なし - すべての通貨ペアで大活躍! -インジケータの精度は最大 90% (特に夜間) ・長時間の設定不要(バイナリーオプションに最適な設定) - 信号が遅れない - 現在のローソク足でのシグナルの出現 ・M1期にピッタリ(No More!) ・目に優しいキャンドルカラー(赤・青) -インストールされたアラート それを扱う: - 青い矢印は信号アップを示します -赤い下向き矢印 M1 以上のインジケーターをチャートに配置しないでください. シグナルの精度が低下します! インジケーターのスクリーンショットとビデオを見る
Bermaui Bands
Muhammad Elbermawi
4.94 (90)
Bermaui Bands(BB)は、レンジとトレンドの価格変動をフィルタリングするのに役立つテクニカル分析ツールです。この指標の背後にある考え方は、次のステップで説明できます。 標準偏差を0〜100の間で移動するオシレーターとして計算します。これをBermaui偏差パーセント(BD%)と名付けます。 「BD%」がゼロに近い場合、ボラティリティは極端になります。さらに、「BD%」が100に近い場合、ボラティリティは非常に低くなります。 ボラティリティが高いということは、トレンド市場の可能性が高いことを意味し、ボラティリティが低いということは、横向きまたはレンジング市場を意味します。 標準偏差はSMAに基づいて計算されるため、中央の線は単純移動平均(SMA)です。 計算で同じバー数の単純移動平均に「BD%」を追加して、アッパーベルマウイバンドを取得します。 計算で同じ数のバーを使用した単純な移動平均から「BD%」を減算して、Lower BermauiBandsを取得します。 重要な情報 Bermaui Bandsユーザーズマニュアル: https://www.mql5.com/en/b
フラットとトレンドを決定するための指標。 価格が2つのヒストグラムと2つの線(赤と青)のいずれかを下回っている場合、これは売りゾーンです。 このバージョンのインジケーターを購入するときは、1つの実際のアカウントと1つのデモアカウント用のMT4バージョン-ギフトとして(受け取るには、プライベートメッセージを書いてください)! 価格が2つのヒストグラムと2つの線(赤と青)のいずれかを上回っている場合、これは購入ゾーンです。 MT4バージョン: https//www.mql5.com/en/market/product/3793 価格が2つの線の間、またはいずれかのヒストグラムのゾーンにある場合、市場に明確な傾向はありません。簡単に言えば、市場は横ばいです。 インジケーターの動作は、スクリーンショットでより明確に示されています。
「Turbo Helper for scalping」(スキャルピング用ターボヘルパー)は完全なトレーディングシステムです。チャート上に矢印を表示して、トレーダーに注文を開くタイミングと方向を示します。また、四角形のシンボルでトレーダーに取引を終了するタイミングを示します。その後、このインジケーターは取引における予想されるポイント数をチャート上に表示します。この値は実際のスプレッドの大きさやブローカーのスワップを考慮していないため、若干異なる場合があります。ただし、より正確な計算をするためには、インジケーターの設定で「平均デイリースプレッド」というパラメーターでスプレッドのサイズを指定できます。計算時には、システムはこのパラメーターの値を考慮します。このトレーディングシステムは、トレーダーの代わりに市場分析を行い、具体的なアドバイスを提供します。また、「Turbo Helper for scalping」はメールと電話でシグナルを送信します。 システムの利点: 完全なトレーディングシステム M5、M15、M30の時間枠でスキャルピングをするために設計されています 値を再描画しません 市
This   Real Magic Trend   indicator is designed for signal trading. This indicator generates trend signals. It uses many algorithms and indicators to generate this signal. It tries to generate signals from the points with the highest trend potential. This indicator is a complete trading product. This indicator does not need any additional indicators. The indicator is never repainted. The point at which the signal is given does not change.      Features and Recommendations Time Frame
This is the FXTraderariel-TakeProfit - Stop Loss Indicator . It provides you 3 potential Take Profits and 1 Stop Loss. These potential targets are computed based on several methods . The indicator can be used on every time frame, but we advise to use it on H1, H4 and D1. Especially if you are a novice trader. Pro Traders can also you use it for scalping in smaller time frames (M1, M5 and M15). This indicator is not a complete trading system. It doesn't provide you a Signal nor can predict the m
Title : Market Bias Indicator - Oscillator-Based Trading Tool Introduction : Discover the potential of the "Market Bias Indicator," a revolutionary oscillator-based trading tool designed for precise market analysis. If you're in search of a robust alternative to traditional bias indicators, your quest ends here. Market Bias Indicator offers unparalleled accuracy in identifying market sentiment and is your gateway to confident trading decisions. Recommended Trading Pairs : Market Bias Indicator i
TWO PAIRS SQUARE HEDGE METER INDICATOR Try this brilliant 2 pairs square indicator It draws a square wave of the relation between your two inputs symbols when square wave indicates -1 then it is very great opportunity to SELL pair1 and BUY Pair2 when square wave indicates +1 then it is very great opportunity to BUY pair1 and SELL Pair2 the inputs are : 2 pairs of symbols         then index value : i use 20 for M30 charts ( you can try other values : 40/50 for M15 , : 30 for M30 , : 10 for H1 ,
Delta Pairs
Anatolii Zainchkovskii
1 (1)
Delta Pairs is an indicator for pair trading, it displays the divergence of two currency pairs. Does not redraw. A useful tool for the analysis of the behavior of two currency pairs relative to each other. Purpose The Delta Pairs indicator is designed for determining the divergences in the movements of two currency pairs. This indicator is displayed as two line charts and the difference (delta) between these charts in the form of a histogram. The Delta Pairs indicator will be useful for those
Basic Support and Resistance インジケータは、テクニカル分析を強化するために必要なソリューションです。このインジケータを使用すると、チャートにサポートレベルとレジスタンスレベルを投影できます/ mt5バージョン 機能 フィボナッチレベルの統合: サポートと抵抗レベルとともにフィボナッチレベルを表示するオプションを使用すると、私たちの指標は市場行動と逆転領域の可能性についてさらに深い洞察を提供します。 パフォーマンスの最適化: 各バーの開口部のみで拡張ラインを更新するオプションを使用すると、インジケータは、サポートレベルと抵抗レベルの精度を犠牲にすることなく最適なパフォーマンスを保証します。 入力 メイン設定 Timeframe:  この入力を通じて、より高い時間枠のサポートラインとレジスタンスラインをチャート上に表示することを選択できます。 Support/Resistance Strength [Number of Bars]:  この入力を使用して、サポートと抵抗の強度を決定できます。数が高いほど、サポート/抵抗がより強くなります。 Pri
Heiken Ashi candle chart is an improved version of The Japanese candle chart, which can effectively filter the market "noise" of the Japanese candle chart. It is favored by many traders for its simplicity and intuition. For trend traders, the HA candle chart is a magic tool. Unlike the traditional Japanese candle chart, Heikenashi does not reflect the opening price, high price, low price and closing price of the market. Instead, Heikenashi calculates the value of a single K line in the dominant
このプロダクトを購入した人は以下も購入しています
現在26%オフ 初心者やエキスパートトレーダーに最適なソリューション! このインジケーターは、独自の機能と新しい計算式を取り入れた、ユニークで高品質、かつ手頃な価格のトレーディングツールです。たった1枚のチャートで28の為替ペアの通貨強度を読み取ることができます。新しいトレンドやスキャルピングチャンスの引き金となるポイントを正確に特定することができるので、あなたのトレードがどのように改善されるか想像してみてください。 ユーザーマニュアルはこちら  https://www.mql5.com/en/blogs/post/697384 これが最初の1本、オリジナルだ! 価値のないクローンを買わないでください。 特別な サブウィンドウの矢印で強い通貨の勢いを表示 GAPがあなたのトレードを導く! 基準通貨や気配値が売られすぎ・買われすぎのゾーン(外相フィボナッチレベル)にあるとき、個別チャートのメインウィンドウに警告表示。 通貨がレンジの外側から反落した場合、プルバック/リバーサルのアラート。 クロスパターンの特別なアラート 複数の時間枠を選択可能で、トレンドを素早く
An exclusive indicator that utilizes an innovative algorithm to swiftly and accurately determine the market trend. The indicator automatically calculates opening, closing, and profit levels, providing detailed trading statistics. With these features, you can choose the most appropriate trading instrument for the current market conditions. Additionally, you can easily integrate your own arrow indicators into Scalper Inside Pro to quickly evaluate their statistics and profitability. Scalper Inside
Reversal First Impulse levels (RFI)    INSTRUCTIONS        RUS       -       ENG              R ecommended to use with an indicator   -   TREND PRO -  Version MT5 A key element in trading is zones or levels from which decisions to buy or sell a trading instrument are made. Despite attempts by major players to conceal their presence in the market, they inevitably leave traces. Our task was to learn how to identify these traces and interpret them correctly. Main functions: Displaying active zones
まず第一に、この取引インジケーターは再描画されず、再描画されず、遅延しないことを強調する価値があります。これにより、手動取引とロボット取引の両方に理想的なものになります。 ユーザーマニュアル:設定、入力、戦略。 アトミックアナリストは、価格の強さとモメンタムを利用して市場でより良いエッジを見つけるためのPA価格アクションインジケーターです。ノイズや誤ったシグナルを除去し、取引ポテンシャルを高めるための高度なフィルターを備えています。複雑なインジケーターの複数のレイヤーを使用して、アトミックアナリストはチャートをスキャンし、複雑な数学的計算をシンプルなシグナルと色に変換します。これにより、どのような初心者トレーダーでも理解して使用し、一貫した取引の決定を行うことができます。 「アトミックアナリスト」は、新規および経験豊富なトレーダー向けにカスタマイズされた包括的な取引ソリューションです。プレミアムインジケーターとトップノッチの機能を1つの取引戦略に組み合わせ、すべてのタイプのトレーダーにとって汎用性のある選択肢にします。 デイリートレーディングとスキャルピング戦略:高
Enigmera
Ivan Stefanov
5 (3)
エニグメラ:市場の中核 https://www.enigmera.com はじめに このインディケータと取引システムは、金融市場に対する驚くべきアプローチです。ENIGMERAは、フラクタルサイクルを使用して、サポートとレジスタンスレベルを正確に計算します。本格的な蓄積局面を示し、方向性と目標を示します。 トレンド中でも調整中でも機能するシステムです。 どのように作動するのか? ENIGMERAは、支持線・抵抗線、目標線、乖離線の3つのラインで構成されています。このシステムは、過去のデータを現在と未来に外挿する典型的な市場指標とは異なり、現在の完全な画像を提供します。支持線上にある場合、それは本当の支持を意味し、抵抗線上にある場合、それは本当の抵抗を意味する。ある水準が破られた場合、それはトレンドの変化を意味する。再描画はしない。 市場は常に進化しているため、ENIGMERAはその評価ツールを適応させ、定期的に戦略を修正しています。  これにより、すべてのシナリオが徹底的に評価されることが保証されます。この市場指標の独自性は、その能力を見れば明らかです。  ENIGM
現在20%OFF! 初心者やエキスパートトレーダーのためのベストソリューション! このダッシュボードソフトウェアは、28の通貨ペアで動作しています。それは私達の主要な指標(高度な通貨の強さ28と高度な通貨インパルス)の2に基づいています。それは全体の外国為替市場の大きい概観を与えます。それは、すべての(9)時間枠で28の外国為替ペアのための高度な通貨の強さの値、通貨の動きの速度と信号を示しています。チャート上で1つのインディケータを使用して市場全体を観察し、トレンドやスキャルピングの機会をピンポイントで見つけることができたら、あなたのトレードがどのように改善されるか想像してみてください。 このインディケータには、強い通貨と弱い通貨の識別、潜在的な取引の識別と確認がより簡単になるような機能が搭載されています。このインディケータは、通貨の強さや弱さが増加しているか減少しているか、また、すべての時間枠でどのように機能しているかをグラフィカルに表示します。 新機能として、現在の市場環境の変化に適応するダイナミックなマーケットフィボナッチレベルが追加され、すでに当社のAdvan
TPSpro TRENDPRO  - is a trend indicator that automatically analyzes the market and provides information about the trend and each of its changes, as well as giving signals for entering trades without redrawing! The indicator uses each candle, analyzing them separately. referring to different impulses - up or down impulse. Exact entry points into transactions for currencies, crypto, metals, stocks, indices!  -  Version MT5               DETAILED DESCRIPTION                R ecommended to use with
Advanced Supply Demand
Bernhard Schweigert
4.92 (313)
現在33%オフ 初心者にもエキスパートトレーダーにも最適なソリューション このインジケーターは独自の機能と新しい公式を多数内蔵しており、ユニークで高品質かつ手頃な取引ツールです。このアップデートでは、2つの時間枠ゾーンを表示できるようになります。より長いTFだけでなく、チャートTFとより長いTF(ネストゾーンを表示)の両方を表示できます。すべてのSupply Demandトレーダーの皆さんのお気に召すはずです。:) 重要情報の公開 Advanced Supply Demandの可能性を最大化するには、 https://www.mql5.com/ja/blogs/post/720245 にアクセスしてください。   エントリーまたはターゲットの正確なトリガーポイントを正確に特定できれば取引がどのように改善されるか想像してみてください。新しい基盤となるアルゴリズムに基づいて構築されているため、買い手と売り手の間の潜在的な不均衡をさらに簡単に特定できます。これは、最も強い需要と供給のゾーンと、過去のパフォーマンス(古いゾーンを表示)がグラフィカルに表現されるためです。これらの機能は、最適
mql5と Telegramの モーニング・ブリーフィングで、詳細とスクリーンショットを含む毎日のマーケット・アップデートをご覧 ください! FX Power MT4 NGは 、長年の人気を誇る通貨強度計FX Powerの次世代モデルです。 この次世代ストレングスメーターは何を提供するのでしょうか?初代FXパワーの魅力すべて プラス GOLD/XAUの強さ分析 より正確な計算結果 個別に設定可能な分析期間 カスタマイズ可能な計算上限値により、さらに優れたパフォーマンスを実現 もっと見たい人のための特別なマルチインスタンス設定 すべてのチャートでお好みの色を無限に設定可能 数え切れないほどの通知オプションにより、重要なことを見逃すことはありません。 Windows 11とmacOSのスタイルで角を丸くした新しいデザイン 魔法のように動くインジケーターパネル FXパワーの主な機能 すべての主要通貨の強さの完全な履歴 すべての時間枠における通貨の強さの履歴 すべてのブローカーとチャートで同一の計算結果 100%信頼できるリアルタイム計算 -> リペイントなし ドロップダウン・リストから
ご紹介   クォンタム トレンド スナイパー インジケーターは 、トレンド反転を特定して取引する方法を変革する画期的な MQL5 インジケーターです。 13年以上の取引経験を持つ経験豊富なトレーダーのチームによって開発されました。     クォンタムトレンドスナイパーインジケーター   は、非常に高い精度でトレンドの反転を識別する革新的な方法で、あなたのトレーディングの旅を新たな高みに押し上げるように設計されています。 ***Quantum Trend Sniper Indicatorを購入すると、Quantum Breakout Indicatorを無料で入手できます!*** クォンタム ブレイクアウト インジケーターは、トレンドの反転を特定するとアラートを発し、矢印を示し、3 つのテイクプロフィットレベルを提案します。 初心者トレーダーにもプロのトレーダーにも適しています。 量子EAチャネル:       ここをクリック MT5のバージョン:       ここをクリック 推奨事項: 期間: すべての時間枠。最良の結果を得るには、
FX Volume
Daniel Stein
4.6 (35)
mql5と Telegramの モーニング・ブリーフィングで、詳細とスクリーンショットを含む毎日のマーケット・アップデートをご覧 ください! FX Volumeは、ブローカーの視点から市場のセンチメントをリアルに洞察する、最初で唯一の出来高インジケーターです。 ブローカーのような機関投資家が外国為替市場でどのようなポジションをとっているか、COTレポートよりもはるかに速く、素晴らしい洞察を提供します。 この情報をチャート上で直接見ることは、あなたの取引にとって真のゲームチェンジャーであり、画期的なソリューションです。 以下のようなユニークなマーケットデータ洞察から利益を得てください。 比率は 、通貨のロングポジションとショートポジションの比率をパーセントで表示します。 比率の変化は 、選択した期間内のロング比率とその変化率を表示します。 Volumes Totalは 、通貨の取引量(ロングとショート)の合計をロット単位で表示します。 Volumes Long :全通貨のロングポジションの取引量を表示します。 Volumes(ショート )は、全通貨のショートポジションの取引量を表示
現在20%OFF! 初心者やエキスパートトレーダーに最適なソリューションです。 このインディケータは、エキゾチックペア・コモディティ・インデックス・先物など、あらゆるシンボルの通貨の強さを表示することに特化したインディケータです。金、銀、原油、DAX、US30、MXN、TRY、CNHなどの通貨の強さを表示するために、9行目にどのシンボルでも追加することができます。独自の機能を多数搭載し、新しい計算式を採用したため、ユニークで高品質、かつ手頃な価格のトレーディングツールとなっています。新しいトレンドやスキャルピングチャンスのトリガーポイントを正確に把握することができるため、あなたのトレードがどのように改善されるか想像してみてください。 ユーザーマニュアル:ここをクリック   https://www.mql5.com/en/blogs/post/708876 すべての時間枠に対応します。あなたはすぐにトレンドを見ることができるようになります! 新しいアルゴリズムに基づいて設計されているため、潜在的な取引の特定と確認がより簡単になります。これは、8つの主要通貨と1つのシンボ
ご紹介     Quantum Breakout PRO は 、ブレイクアウト ゾーンの取引方法を変革する画期的な MQL5 インジケーターです。 13年以上の取引経験を持つ経験豊富なトレーダーのチームによって開発された Quantum Breakout PROは 、革新的でダイナミックなブレイクアウトゾーン戦略により、あなたの取引の旅を新たな高みに押し上げるように設計されています。 クォンタム ブレイクアウト インジケーターは、5 つの利益ターゲット ゾーンを備えたブレイクアウト ゾーン上のシグナル矢印と、ブレイクアウト ボックスに基づいたストップロスの提案を提供します。 初心者トレーダーにもプロのトレーダーにも適しています。 量子EAチャネル:       ここをクリック MT5バージョン:   ここをクリック 重要!購入後、インストールマニュアルを受け取るためにプライベートメッセージを送ってください。 推奨事項: 時間枠: M15 通貨ペア: GBPJPY、EURJPY、USDJPY、NZDUSD、XAUUSD アカウントの種類: ECN、Raw、また
Indicator : RealValueIndicator Description : RealValueIndicator is a powerful tool designed specifically for trading on the EURUSD pair. This indicator analyzes all EUR and USD pairs, calculates their real currency strength values, and displays them as a single realistic value to give you a head start on price. This indicator will tell you moves before they happen if you use it right. RealValueIndicator allows you to get a quick and accurate overview of the EURUSD currency pair tops and bottoms,
TakePropips Donchian Trend Pro
Eric John Pajarillaga Aldana
4.82 (17)
TakePropips Donchian Trend Pro   (MT4) は、ドンチャン チャネルを使用してトレンドの方向を自動的に検出し、エントリーとエグジットの取引シグナルを提供する強力で効果的なツールです! この多機能インジケーターには、トレンド スキャナー、取引シグナル、統計パネル、スクリーナー、取引セッション、およびアラート履歴ダッシュボードが含まれます。取引シグナルを提供し、チャートを分析する時間を節約するように設計されています! ユーザー マニュアルとインストール ガイドは、ブログ投稿 (   https://www.mql5.com/en/blogs/post/751368   ) からダウンロードできます。 今日は 50% オフ! 98ドルから49ドルに値下げ! このインジケーターは、ストラテジー テスターでテストできます (ビジュアル モードを有効にします)。 詳細については、説明の下にあるビデオ チュートリアルも利用できます。 ご不明な点やサポートが必要な場合は、私に連絡してください。 TakePropips Donchian Trend Pro イン
Trend Screener
STE S.S.COMPANY
4.83 (88)
トレンドインジケーター、1つのツールに組み込まれたすべての重要なトレンド機能を備えたトレンドトレーディングとフィルタリングのための画期的なユニークなソリューション! これは、すべてのシンボル/商品(外国為替、商品、暗号通貨、インデックス、株式)で使用できる100%再描画されていないマルチタイムフレームおよびマルチ通貨インジケーターです。 トレンドスクリーナーは、チャート内のドットで矢印トレンドシグナルを提供するインジケーターに続く効率的なインジケーターです。 トレンド分析インジケーターで使用できる機能: 1.トレンドスキャナー。 2.最大利益分析を備えたトレンドライン。 3.トレンド通貨強度メーター。 4.アラート付きのトレンド反転ドット。 5.アラート付きの強いトレンドドット。 6.トレンド矢印 毎日の分析例、毎日のシグナルパフォーマンス...など、トレンドスクリーナーインジケーターを使用して、ここで見つけることができます: ここをクリックしてください 期間限定オファー:トレンドスクリーナーインジケーターは、50ドルと生涯でのみご利用いただけます。 (元の価格125 $) MQ
現在31%オフ! 初心者やエキスパートトレーダーに最適なソリューション! このインジケータは、独自の機能と秘密の数式を組み込んだ、ユニークで高品質かつ手頃な価格のトレーディングツールです。たった1枚のチャートで28の通貨ペアのアラートを表示します。新しいトレンドやスキャルピングチャンスの引き金となるポイントを正確に把握することができるので、あなたのトレードがどのように改善されるか想像してみてください! 新しい基本的なアルゴリズムに基づいて構築されているため、潜在的な取引の特定と確認がより簡単になります。これは、通貨の強さや弱さが加速しているかどうかをグラフィカルに表示し、その加速のスピードを測定するためです。加速すると物事は明らかに速く進みますが、これはFX市場でも同じです。つまり、反対方向に加速している通貨をペアにすれば、利益を生む可能性のある取引を特定することができるのです。 通貨の勢いを示す縦の線と矢印は、あなたの取引の指針となるでしょう。 ダイナミックマーケットフィボナッチ23レベルはアラートトリガーとして使用され、市場の動きに適応します。もしインパルスが黄色
Thise indicator is up down v6  comes with tradingwiev pinescript. purchased people, after installed on terminal ,contact me on mql5  to get BONUS  TradingView pinescript. up-down indicator is no repaint and works all pairs and lower than weekly time frames charts. it is suitable also 1 m charts for all pairs. and hold long way to signal. dont gives too many signals. when red histogram cross trigger line that is up signal.and price probably will down when blue histogram cross trigger line that
Gold Channel is a volatility-based indicator, developed with a specific timing algorithm for the XAUUSD pair, which consists of finding possible corrections in the market. This indicator shows two outer lines, an inner line (retracement line) and an arrow sign, where the theory of the channel is to help identify overbought and oversold conditions in the market. The market price will generally fall between the boundaries of the channel. If prices touch or move outside the channel it is a tra
ECM Elite Channel is a volatility-based indicator, developed with a specific time algorithm, which consists of finding possible corrections in the market. This indicator shows two outer lines, an inner line (retracement line) and an arrow sign, where the channel theory is to help identify overbought and oversold conditions in the market. The market price will generally fall between the boundaries of the channel. If prices touch or move outside the channel, it's a trading opportunity. The
Gann Signal is a very simple indicator at first glance, but hidden inside is many years of experience in studying W.D.Ganna methods. The indicator gives accurate BUY/SELL signals, without redrawing. The indicator is very easy to use. All you need to do is attach it to your chart and follow its recommendations. The indicator constantly analyzes the market for entry opportunities. When such an opportunity appears, the indicator gives a signal in the form of an arrow. I repeat, all signals are NOT
Please send me Direct message on MQL5 CHAT after purchasing the Indicator for Training and Installation Support There are some additional files that is important to use with the Indicator . So be sure to contact me after purchasing the Indicator So that I can add you for training and support . If you find any difficulty with installation then send me Direct message here So that I can connect with you via Anydesk or Teamview for the product installation. " Smart Order Block Indicator " to find
Introduction to X3 Chart Pattern Scanner X3 Cherart Pattern Scanner is the non-repainting and non-lagging indicator detecting X3 chart patterns including Harmonic pattern, Elliott Wave pattern, X3 patterns, and Japanese Candlestick patterns. Historical patterns match with signal patterns. Hence, you can readily develop the solid trading strategy in your chart. More importantly, this superb pattern scanner can detect the optimal pattern of its kind. In addition, you can switch on and off individu
TrendMaestro
Stefano Frisetti
5 (3)
note: this indicator is for METATRADER4, if you want the version for METATRADER5 this is the link:  https://www.mql5.com/it/market/product/108106 TRENDMAESTRO ver 2.4 TRENDMAESTRO recognizes a new TREND in the bud, he never makes mistakes. The certainty of identifying a new TREND is priceless. DESCRIPTION TRENDMAESTRO identifies a new TREND in the bud, this indicator examines the volatility, volumes and momentum to identify the moment in which there is an explosion of one or more of these data a
このダッシュボードは、選択されたシンボルの最新の利用可能なハーモニックパターンを表示するので、時間を節約し、より効率的に / MT5バージョン 。 無料インジケーター: Basic Harmonic Pattern インジケーター列 Symbol : 選択したシンボルが表示されます。 Trend : 強気または弱気 Pattern : パターンの種類(ガートレー、バタフライ、バット、カニ、サメ、サイファー、ABCD) Entry : エントリー価格 SL: ストップロス価格 TP1: 1回目の利食い価格 TP2: 2回目の利食い価格 TP3: 3回目の利食い価格 Current price : 現在値 Age (in bars):  最後に描画されたパターンの年齢 主な入力項目 Symbols: "28 Major Currency Pairs "または "Selected Symbols "から選択。 Selected Symbols: カンマで区切られた監視したいシンボル("EURUSD,GBPUSD,XAUUSD")。ブローカーがペアに接尾辞または接頭辞を付けて
norepaint buy sell indicator is norepaint indicator.and works all pairs and all timeframes. using is wery simple ,it puts arrow on price probably buy sell arrows. thise indicator is suitable for beginner and experienced traders. there is cnt numbers that show how many bars you see the signal back. increasing it possible but up to chart have the how many bars . minimum value of this 500.
このインディケータは、当社の2つの製品 Advanced Currency IMPULSE with ALERT  +   Currency Strength Exotics . のスーパーコンビネーションです。 このインジケーターは全ての時間枠で作動し、8つの主要通貨と1つのシンボルの強弱のインパルスをグラフで表示します。 このインジケータは、金、エキゾチックペア、商品、インデックス、先物など、あらゆるシンボルの通貨強度の加速度を表示することに特化されています。金、銀、原油、DAX、US30、MXN、TRY、CNHなどの通貨強度の加速度(インパルスまたは速度)を表示するために、任意のシンボルを9行目に追加できる、この種の最初のものです。 新しいアルゴリズムに基づいて構築され、潜在的な取引の特定と確認がさらに容易になりました。これは、通貨の強さや弱さが加速しているかどうかをグラフィカルに表示し、その加速の速度を測定するためです。加速すると物事は明らかに速く進みますが、これはFX市場でも同じです。つまり、反対方向に加速している通貨をペアリングすれば、潜在的に利益を生む取
NextCandlePredictor インジケーター NextCandlePredictorは、再描画しない、色が変わらない、動かない、消えない、遅延がないアラート付きのシグナルインジケーターです。あらゆるタイムフレームで次のキャンドルまたはその次のキャンドルの方向を識別するのに役立ちます。ニューヨーク、ロンドン、またはその両方の重なり合う高ボラティリティ市場に特にお勧めです。 主な特徴: タイムフレームの汎用性: M1からH1以上のあらゆるタイムフレームで迅速かつ正確なシグナルを提供します。 明確な買い/売りシグナル: ADXのDI+とDI-ラインを使用して明確な買いと売りのシグナルを生成し、最良のトレード判断を下せるようにします。 直感的な視覚化: シグナルはチャート上に緑色(買い)と赤色(売り)の矢印で直接表示され、迅速かつ簡単に読み取れます。 カスタマイズ可能な設定: 分析するバーの数とアラートオプションを好みとトレード戦略に応じて調整できます。使用するTFに応じた提案表を以下で確認してください。 即時およびオプションのキャンドル終了時アラート: デフォルトでは、ADX条件が
Automated Trendlines
Georgios Kalomoiropoulos
5 (17)
トレンドラインは、外国為替取引におけるテクニカル分析の最も重要なツールです。残念ながら、ほとんどのトレーダーはそれらを正しく描画していません。自動トレンドラインインジケーターは、市場のトレンドの動きを視覚化するのに役立つ本格的なトレーダー向けのプロフェッショナルツールです。 トレンドラインには、強気トレンドラインと弱気トレンドラインの2種類があります。 上昇トレンドでは、外国為替トレンドラインは価格変動の最低スイングポイントを介して描画されます。 少なくとも2つの「最低安値」を接続すると、トレンドラインが作成されます。 下降トレンドでは、トレンドラインは価格変動の最も高いスイングポイントを介して描画されます。 少なくとも2つの「最高値」を接続すると、トレンドラインが作成されます。 トレンドラインが壊れたとき? 弱気のろうそくが強気のトレンドラインの下で閉じ、ろうそくの高さがトレンドラインの上にあるとき、強気のトレンドラインは壊れます。 強気のろうそくが弱気のトレンドラインの上で閉じ、ろうそくの安値がトレンドラインの下にあるとき、弱気のトレ
The Supply and Demand with Swap zones MTF indicator is a powerful tool for technical analysis that has been modified and enhanced to provide traders with even more valuable information. This tool is based on the rule of supply and demand and allows traders to analyze a chart on three different timeframes at once, providing a more comprehensive view of the market. One of the key features of this indicator is the so-called swap zones, which are areas that have been broken through by the price but
作者のその他のプロダクト
There is already a test of version 5.70 (starting March 18, 2024)                          The ATR indicator (Average True Range) is a tool used to measure market volatility. It can be used to develop a trading strategy that takes into account daily and weekly price volatility. Here are some key points about using ATR in a trading strategy: Volatility Assessment: ATR helps understand how much the price of an asset has changed in a given period compared to previous periods. This is useful for as
The fact that round number levels have a significant influence on the market cannot be denied and should not be overlooked. These psychological levels are used by both retail Forex traders and major banks that deal in Forex.  Very simple and effective indicator and most importantly free. ////////////////////////////////////////////////////////////////////////////////////////////////////////////////////////////////////////////////////////////// The program does not work in the strategy tester.
FREE
Nimitz-type expert. Simply atomic. I am an automated trading geek but I think the future for me is hybrid trading. I think hybrid commerce has a huge future. While many grid traders finish up with huge drawdowns, I don't believe it is inevitable. Of course, risks are and always will be. Many of my testing and investigation suggests that grid (position averaging) trading is possible with consistently very modest drawdown. If achieved, this then makes grid trading a very attractive proposition. Ma
Smart Grid Executor is an Expert Advisor built for MetaTrader 4 platform only. Smart Grid Executor will work on all account types and sizes on MetaTrader 4 brokers (outside of NFA regulations). Recommended leverage >= 1:500. Features Multicurrency EA Interval - H1 recommended Working with 4 and 5-digit brokers Working with Martingale Automatic multiplier Working with ECN Input Parameters Name - Smart Grid Executor v 4.00 Start - Short & Long, Only Long, Only Short. Time Frame [Recommended H1
V Max NX
Szymon Palczynski
Hundreds of possible combinations and only two strategies. By using automated software like an EA, you can benefit from the following advantages: it can trade while you are sleeping, it is not susceptible to emotions and you can quickly run backtests. However, it is hard to ascertain whether an EA will help you to achieve consistent profits. Lots of EAs are profitable on a demo account, but for some unknown reason, when the trader tries to apply it on a live account with their own funds, suddenl
Currency Correlation Plus is an expensive version of the indicator. It is equipped with the signal and is more equipped than its cheaper brother. The indicator helps us understand and see a correlation. Second chart makes it easy to analyze and trade multiple currencies. On the chart, you can post multiple pairs. Type in the selected currency pair in the settings and add it to the chart. If you want to have another tool, see another product: https://www.mql5.com/en/market/product/13392 Inputs
AMD Exclusive
Szymon Palczynski
5 (1)
AMD Exclusive characterized by high efficiency and can constitute a complete system. Indicator based on Price Action, Statistics and Overbalance. We encourage you to study indicator on its own until you know the tendencies of how it behaves relative to price movement. Indicator automatically optimizes time frame M15, M30, H1, H4, D1 and W1 (press the button [O] on the chart). Filter OVB (overbalance) has three modes: Manual [button F on chart]. Semi-automatic [button F on chart]. Automatic [butt
AMD Exclusive Two
Szymon Palczynski
4.5 (2)
One of the biggest problems you will face as trader is finding the right system for myself. AMD Exclusive Two can constitute a complete system for you. Don’t follow the arrows, without thinking twice. Trading using a whole system.  What we have? Automatic optimization Overbalance (manual, semi-automatic and automatic) Main and additional signals Fibonacci Pivot Linear Regression Channel Mini Tester Early warning system (yellow cloud on the chart) 3D effect Button On Chart Button [Start] - Star
I am writing as is. Remember... "Another alarming fact can be a huge profit stated in the description of a trading robot. If the attached Strategy Tester reports show a sky-high balance, it most likely has to do with curve fitting. Often developers of such "money printing machines" do not even realize that their system is over-optimized and has too many external parameters. Let us support this assertion by another chart from the above-mentioned report   Optimization VS Reality: Evidence from ATC
This indicator displays the histogram and arrows on chart. When Simple The Best Pro are placed on a chart, they identify the trend.  The color of may be blue or red. The blue color stands for upside moves and the red color stands for downside trends. The indicator offers to set Stop Loss (SL) and  Take Profit (TP)  setting. The default value is ATR. Indicator has automatic optimization. The STB is a unique indicator that shows the tendency (button Bars) of a particular signals. The STB tells us
Spider Bot Pro
Szymon Palczynski
3.67 (3)
No fabricated fake forward tests or meaningless optimized backtests. No artificial intelligence and similar things. In fact, there are frequently sharp differences between backtest results and actual results. One of the limitations of backtest is that they are generally prepared with the benefit of hindsight. Spider Bot Pro uses a developed innovative technology involving virtual grid. Simply put, Spider will build virtual grid in the background, using them to constantly monitor the market to he
Please Note:  The new version 3.10 default settings have been changed. If the default settings seem to bad for you this feel free to run a variation of your own settings. Remember to check the new EA for required margin and balance for your settings. Version 3.10 added the ability for greater profitability and slightly safer exits with 5 new parameters: - Multiplier - Next Multiplier - Take Profit (Chart) - Next Take Profit (Chart) - Repeated  The strategy is based on Bollinger Bands.
I personally love trading robots, but there are many situations where semi-auto trading is superior to automation. The system is very simple and effective.  Trend lines are typically used with price charts, however they can also be used with a range of technical analysis charts such as CCI and RSI.  What is the trend line?  Trend line is a bounding line for the price movement. It is formed when a diagonal line can be drawn between a minimum of three or more price pivot points. A line c
Multi-currency expert. Mission Impossible is a fully automated trading system on all major currency pairs. Very focused on small gains with minimizing the risk of loss (see  Entering/ Ellipse/Ellipse Size).  Advantage thanks to technique.  Not for complete amateurs taking too much risk !!! Forex is a risky business on itself - remember. Systems - Partial closing. - Run. - Open bar/ Every Tick.  Recommended: - VPS or Remote Desktop (e.g Chrome  Remote Desktop) Input Parameters Start Dep
Virtual Bot Pro will open virtual trades, using them to monitor the market to determine the entry point(according to the inputs parameters), at which point Virtual Bot Pro will start opening real trades.  It is recommended to test this Expert on demo account or cent account.  Input Parameters TF - the choice of time frame Start - choose whether you want to trade long or short positions only or both. Trend  Disabled  Enabled TF Trend - the choice of Time Frame for trend.   Spread - for 5 d
My new system... This is not a regular channel. Who is it for: - For people who want to understand the market. Tested and used in the real market (I use and not just encodes) Important !!! The system requires thinking. Only for real traders. If you are looking for a holy grail - please don't bother me. Is it possible? Trading has never been so easy. A combination of fibonacci and an intelligent channel plus levels of support and resistance. Setting out a channel is now very easy.
Veil
Szymon Palczynski
Dualistic indicator with multi-functional panel. Using trading indicators is part of any technical trader’s strategy. Paired with the right tools, it could help you gain more insight into price trends. The Veil indicator combines price points of a financial instrument over a specified time frame and makes summary calculations. In a nutshell, it identifies market trends, showing current support and resistance levels, and also forecasting future levels. Is the system important?  "The AMOUNT of m
Commercial version of open code . A forex trader can create a simple trading strategy to take advantage trading opportunities using MA Histogram or associated indicators. MA Histogram are used primarily as trend indicators and also identify support and resistance levels. Improved version 1.30 Added:  Take Profit  Stop Loss  Automatic optimization  Result  R/R  Consecutive losses
V Max
Szymon Palczynski
One of the most common Bollinger Band strategies is using them to gauge if a market is overbought or oversold.A lot of traders will use these bands and look for price to revert back the middle band or to the mean.When using a mean reversion strategy we are assuming that if price deviates or moves too far away from the mean it will eventually have to come back.This is often looked at as price moving back from an overbought or oversold market into more true value. Bollinger Bands react to price a
MA Histogram Pro is an expensive version of the indicator. It is equipped with the second Take Profit (TP) and is more equipped ( has a positive optimization method) than its cheaper brother.  Simple and effective system with automatic optimization. See my forecasts . MA Histogram are used primarily as trend indicators and also identify support and resistance levels. Equipment:  Take Profit 1    Take Profit 2   Stop Loss  Automatic optimization  Result  R/R  Consecutive losses
Envelopes System
Szymon Palczynski
5 (1)
The Simple Envelopes forex trading strategy combines the popular envelopes indicator and two others(ATR, Trend indicator) to look for trade entry  in the direction of the major trend. What are Moving Average Envelopes? A moving average envelope consists of a   moving average and two other lines . One line is above the moving average and the other line is below the moving average. Together, these two lines form an upper and lower envelope. Entry example:  Upper Envelope: 14-day SMA + (14-day S
Professional strategy This EA clearly controls the market and and performs a statistical price analysis.  The best technologies for professional trading: universal strategy that always works! All this is available in this versatile robot! What should be remembered. Some advice: Don't buy at the top and sell at the bottom.  Play with the main trend. Calculate your entry risk. If possible, it is better to choose the market, which is the most suitable for this trading strategy. If you do not have
Price reach indicator. It also serves as the perfect term for supports and resistance. I use it in two experts. The basic tool for professional trading. The indicator analyzes the last 500 bar and uses this to determine the levels ( but it doesn't predict the future ) . Personally, I use it on TF H1.  It is very simple. Four lines on chart and that's all. Only two input parameters.  Thousands of indicators. Why this? Is good ? No! Is very good. Please test the indicator prior to purchasing.
Rediscover trading. The future of Forex is intuitive hybrids. Hello, my name is Szymon, I am a professional algorithm developer for trading on financial markets forex. Working experience in finance and programming for more than 10 years. I specialize in grid systems and martingale. Black Horse EA is an automated forex robot (this is not your usual grid or martingale). This EA trades based on the breakout of price levels (according to the mathematical algorithm, it determines the area of ​​a ran
This EA clearly controls the market and performs a statistical price analysis.  The best technologies for professional trading: a universal strategy that always works! All this is available in this versatile robot! What should be remembered? Some advice: Don't buy at the top and sell at the bottom.  Play with the main trend. Calculate your entry risk. If possible, it is better to choose the market, which is the most suitable for this trading strategy. If you do not have a proven expert, you
Dual Space Time
Szymon Palczynski
5 (1)
Important !!! Only for real traders. If you are looking for a holy grail - please don't bother me. Multi-currency expert.          At the beginning, I suggest: EURUSD and GBPUSD               Tested in three steps ( Tester/Demo/Real  ) TF - H1  recommended Personally i use M1 for EURUSD only The most important thing is to get out of position                     "Stable version. Tester/Demo/Real ";                      "  Applied systems:";            "- Positioning system";          
Do you like to trade on EURUSD and GBPUSD?  This expert may be for you. Trading starts with pending orders: buylimit and selllimit. The second order is at the market price - the so-called probing order (reduces risk). Then the EA adjusts subsequent orders according to the market situation. Both the first and subsequent orders are closed based on a trailing stop. The expert selects the volume himself, as well as how many positions will be closed.          input start_enum      inp_start= 2 ; //S
The Forex grid trading strategy is a technique that seeks to make a profit on the natural movement of the market. The robot is designed to trade on GBPUSD, but can also trade on other pairs. EA has the advantage of simplicity and a unique position enhancer. What is important. Positions are opened at the close of the candle.  Input parameters: Start   Trend in pips. Comment; Max Spread (Digits 5) Slippage Magic Number  Stop Loss Take Profit (first position)  Average Take Profit  PipsStep for gr
A real girder with "blood and bones". Virtual Bot  will open virtual trades, using them to monitor the market to determine the entry point(according to the inputs parameters), at which point Virtual Bot  will start opening real trades.    It is recommended to test this Expert on demo account or cent account.  Input Parameters input group           "..........Choice..........." ;         input start_enum      start= 2 ; //Start input uchar            starting_real_orders= 4 ; //Start opening re
Katana FX Infinity uses a newly developed innovative technology involving a "smart multiplier". Simply put, Katana intelligently selects the size of the positions It works best on EURUSD, GBPUSD, EURCHF, USDCAD, AUDCAD but can be traded on virtually any chart. Katana FX Infinity is a middle-term trend advisor working best on TF H1 with the usage of the price channel. Like all my EA, it undergoes rigorous testing. He works on a real account and is constantly being improved. I have been creating
フィルタ:
レビューなし
レビューに返信
バージョン 3.50 2017.11.23
Code optimization.
Added:
GlobalVariableGet for EA (see input parameters)
バージョン 3.40 2017.01.23
Сode optimization.
Full compliance with four-digit brokers.
バージョン 3.30 2016.12.30
Fixed some minor bugs.
Improved:
- trend
- trend(big snake)
- optimization
- filter OVB
- a lot of small things
Removed:
- button [1]
- Size information on chart
- Vertical line
バージョン 3.10 2016.12.19
Optimized the EA code.
Fixed some minor bugs.
バージョン 3.0 2016.12.14
Added:
- Push Notifications (current information): indicator gives exact distance to the line reversal.
The information sent on the close of the candle.
- Use ATR: true/false.
- Last: The last pips will display on the chart. Press button [M] and you will see the latest MM.
Press a computer mouse button twice in quick succession to delete.
- Button[F]: filtering of trend based on the Overbalance.
- AMD control.csv: using the defined command types you can create commands in csv file.
- Detector Consolidation: minimum number of bars in consolidation.
バージョン 1.50 2016.11.10
Several changes:
- improved performance
- improved MM
- the current trend is not taken into account
- improved testing
Added:
- Automatic management of multiple indicators in terms of optimization and use of computer resources
- Button[1]: method of estimating trends
- Button[D]: delete indicator
- Button[C]: enable/disable the fixed scale mode
- The main trend in the form of a background (see button[?] on chart)
Removed:
- Button[L]