Stochastic Smart
- インディケータ
- Igor Semyonov
- バージョン: 1.22
- アップデート済み: 23 7月 2024
- アクティベーション: 7
Description
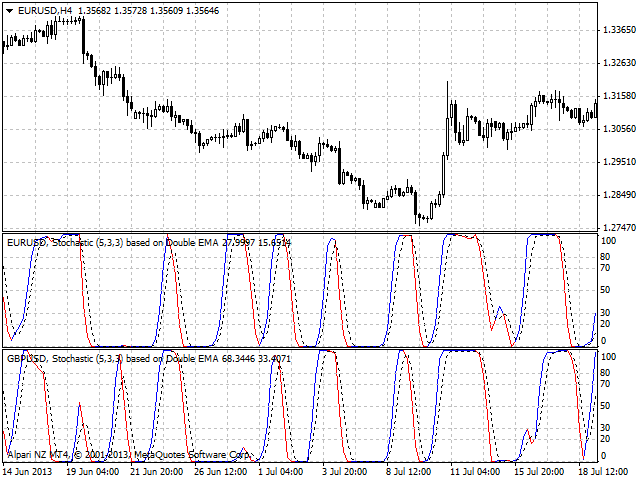
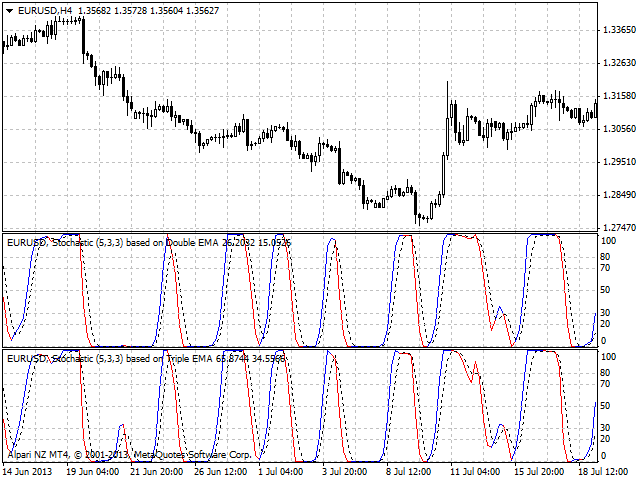
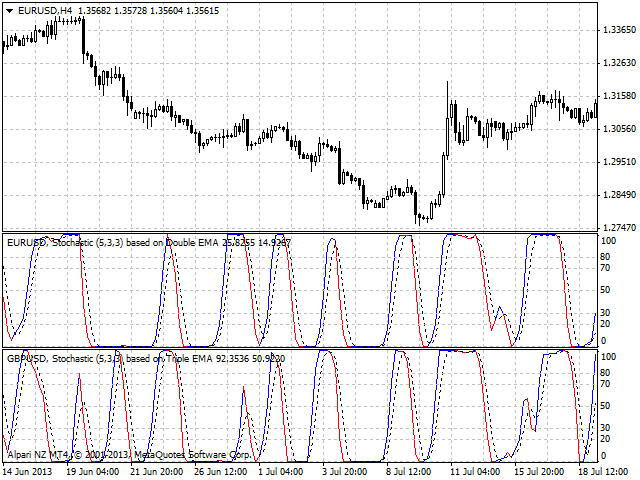
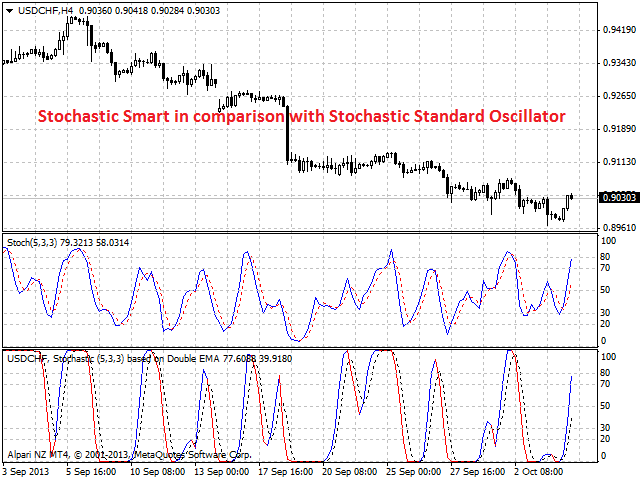
A colored multicurrency/multy-symbol oscillator Stochastic Smart based on the double or triple MA.
Compared with the standard Stochastic, this oscillator is more sensitive, which allows it to generate signals in advance.
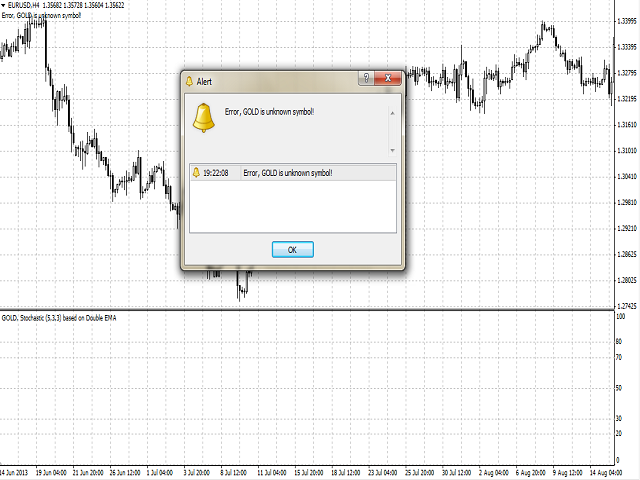
The indicator may be used with any broker, irrespective of the name of the financial instrument since it is necessary to manually enter the name as an input parameter. If you enter a non-existent or incorrect name of a financial instrument, you will receive an error message that this financial instrument is unknown (does not exist).
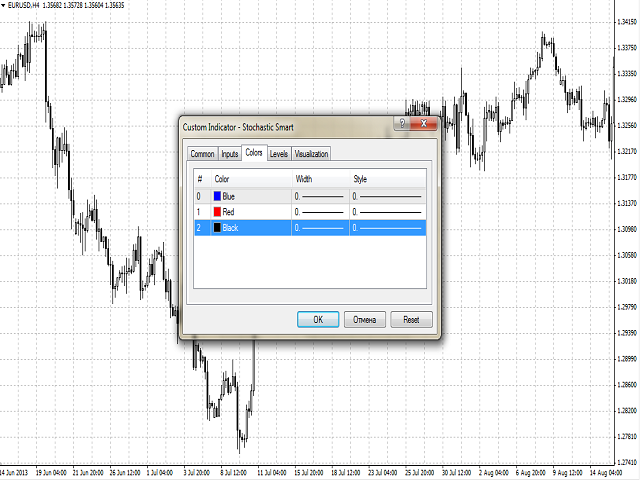
The rising and falling lines of the oscillator can be colored.
Purpose
The oscillator can be used for manual or automated trading in an Expert Advisor. Values of indicator buffer of the double type can be used for automated trading:
- The main line of the indicator - buffer 5.
- The rising line of the indicator - buffer 0.
- The falling the line indicator - buffer 1.
- The signal line of the indicator - buffer 2.
Inputs
- Currency_Name - the name of the financial instrument
- Calc_Method - indicator calculation method:
- based on the double moving average (default).
- based on the triple moving average.
- KPeriod - external parameters of Stochastic.
- DPeriod - external parameters of Stochastic.
- Slowing - external parameters of Stochastic.
- MA_Period - the calculation period of the MA, based on which Stochastic will be calculated.
- MA_Method - the MA averaging method.
- Signal_Method - The averaging method of the signal line.
- Applied_Price - used price.
- Shift - the sift o the basic indicator relative to the price chart.