WalkForwardReporter
- ユーティリティ
- Stanislav Korotky
- バージョン: 1.8
- アップデート済み: 24 10月 2018
WalkForwardReporter is a script creating HTML reports from walk-forward optimization results generated by WalkForwardOptimizer (WFO) library. It allows you to easily view and analyze your expert adviser (EA) performance and robustness in unknown trading conditions of future. You may find more details about walk-forward optimization in Wikipedia.
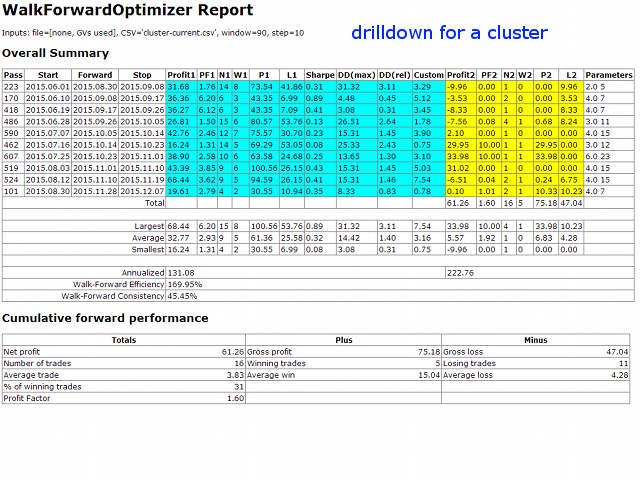
Once you have performed optimization using WFO, the library generates a CSV-file and special global variables with resulting data. Copy the CSV-file from the tester's Files folder into MQL4/Files folder and run the script with default parameters. This builds an html-page with overview of the optimization and also saves the related global variables into GVF-file. In future you may build different reports (drilldowns) from the same resulting data, even if the global variables will be deleted, just by specifing the GVF-file as the 1-st parameter of the script. Until the global variables are intact, you can build drilldowns without mentioning GVF-file.
The names of GVF and HTML files correspond to CSV-file name in global variables, initially specified in EA input wfo_outputFile.
Parameters
- InputVariablesFile - a name of GVF-file to use; if empty (by default), global variables are checked for latest available data;
- WindowSize - specific window size (days) to use for drilldown; must be one of values used during optimization; by default - 0, meaning cluster overview or auto-detection;
- StepSize - specific forward step size (percent or days) to use for drilldown; must be one of values used during optimization; by default - 0, meaning cluster overview or auto-detection;
- ClearWFGlobalVariables - a boolean flag; if true, the script deletes "WF_"-global variables at the end of its run; by default - false; the global variables should be cleared before you start next optimization with WFO.
Report types
Depending from input parameters given for WFO library, WFR can generate different report types from the resulting data.
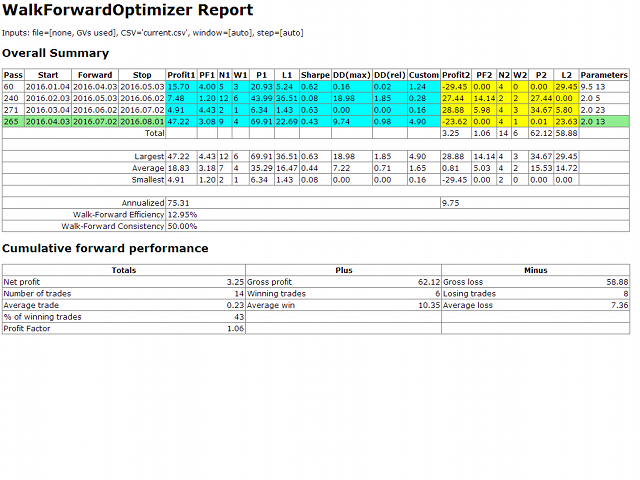
- Standard walk-forward report with a table of passes containing performance indicators for in-sample and out-of-sample periods in the same row, and overall performance for entire aggregated forward period. The report is generated for rolling walk-forward analysis and as a drilldown for cluster analysis (in the later case WindowSize and StepSize parameters should be specified as existing column and row indices of cluster table).
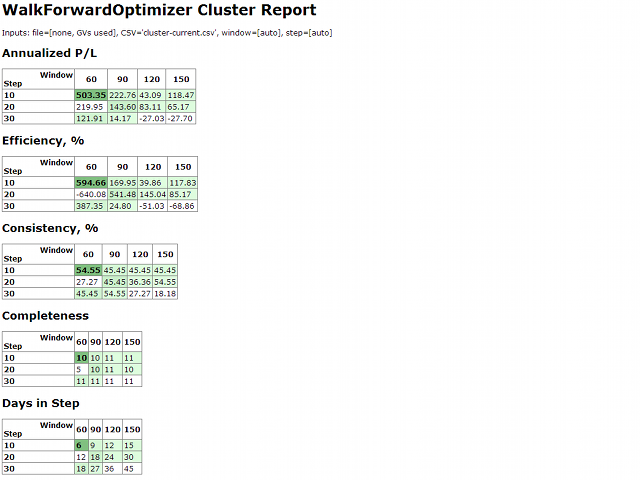
- Cluster report with a set of tables, containing annualized profit, efficiency, consistency, completeness, and number of days in step for selected combinations of window sizes and forward step sizes. This report is generated after clustered walk-forward optimization, if drilldown is not used (WindowSize and StepSize remains 0 by default).
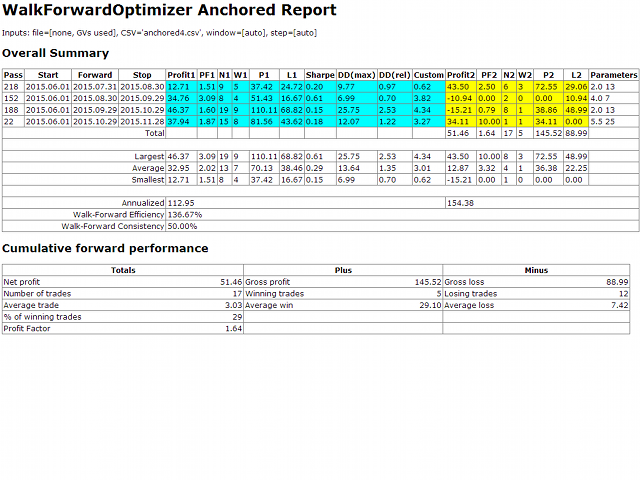
- Anchored walk-forward report is similar to standard report except for that window size changes in every pass (row).
Standard and anchored reports show pass number in the 1-st column. Until MetaTrader 4 is closed you may check every single pass by opening Optimization Results tab in the tester, double-clicking a row with required pass number - this will select optimal inputs from this pass into EA, so you can then start a test run.
In standard reports, in-sample optimization data is highlighted with blue color, and out-of-sample data - with yellow. If the latest pass contains forward step overlapping with current time it's highlighted in green, indicating that this is the latest known parameters applicable for trading right now.
Performance indicators
Annualized profit is a hypothetical profit which EA could earn in a year if optimization period profit and forward period profit are re-scaled proportionally to their length.
Efficiency is a ratio of annualized profits of forward and back periods.
Consistency is a fraction of profitable forward passes in aggregated forward period.
Completeness shows how many rolling passes was performed for specified combination of optimization window size and forward step size, can be less than requested number during genetic optimization, because this method skips some parameters values.
Number of days is suitable for converting step size in percent into days.

