Modified Bollinger Bands
- インディケータ
- Gennadiy Stanilevych
- バージョン: 6.96
- アップデート済み: 4 12月 2021
- アクティベーション: 13
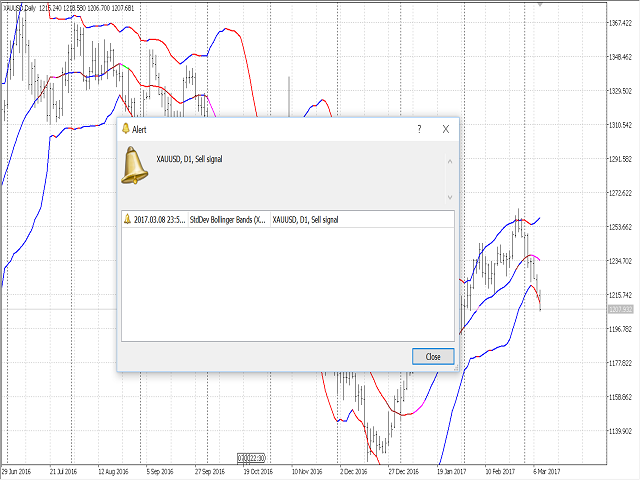
The standard Bollinger Bands indicator has been improved by integrating additional indications from the Standard Deviation indicator (StdDev), which gives an additional filter for confirming trading signals. In addition, the color of the indicator's lines shows the beginning of a trend, its development and exhaustion. This indicator has a signal block that notifies the trader of the beginning of the trend on any time frame to which it is attached.
Settings
- Type of messages - select the type of notifications.
- Moving Average period - the period of Moving Averages
- Shift of bars - shift of bars
- Moving Average deviation - deviation of the Moving Averages
- Type of price - applied price
- Timeframe - timeframe
- Accuracy of price - precision of the values
How to trade
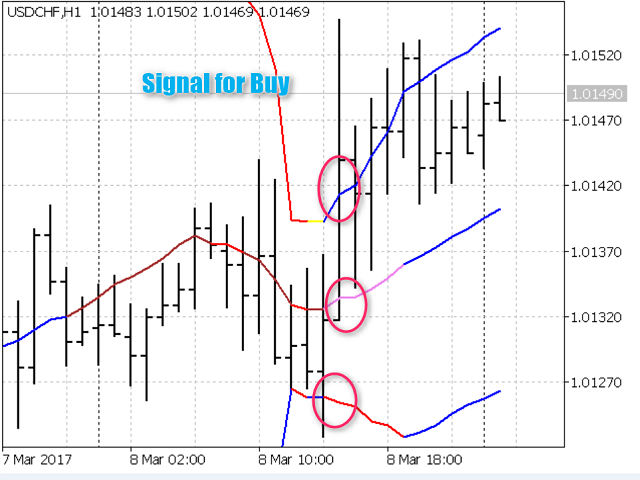
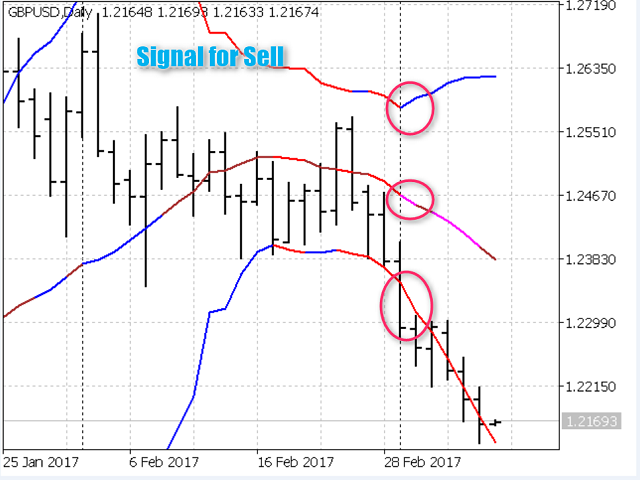
The trading signal is formed at the moment of breakout and closing of the price above the upper line or below the lower line of Bollinger Bands with simultaneous opening of both indicator lines. If there is a breakout of the upper channel of Bollinger Bands - it should be considered as a start of a new bullish trend, if the price closes below the lower band, a sign of the beginning of a downtrend. Narrowing of the upper line after opening with an upward trend indicates the beginning of exhaustion of the impulse price movement. The growth of the upper band during a downtrend indicates the exhaustion of the impulse price movement. During a trend movement, there can be several accelerations and impulse exhaustion. The most interesting moment to start trading is the period of trend change, and not its last damping in the fifth Elliott wave.
The indicator is self-sufficient trading system. It is recommended to use it as a filter of trading signals in a software package consisting of the following products:











ユーザーは評価に対して何もコメントを残しませんでした