Trade Time Master
- インディケータ
- INTRAQUOTES
- バージョン: 1.21
- アップデート済み: 2 5月 2024
- アクティベーション: 5
Enhance your trading precision with our revolutionary product, Trade Time Master Pro. This indicator provides unique insights into the duration of your active trades, offering a comprehensive view of their time in Days, Hours, Minutes, and Seconds.
Indicator Features:
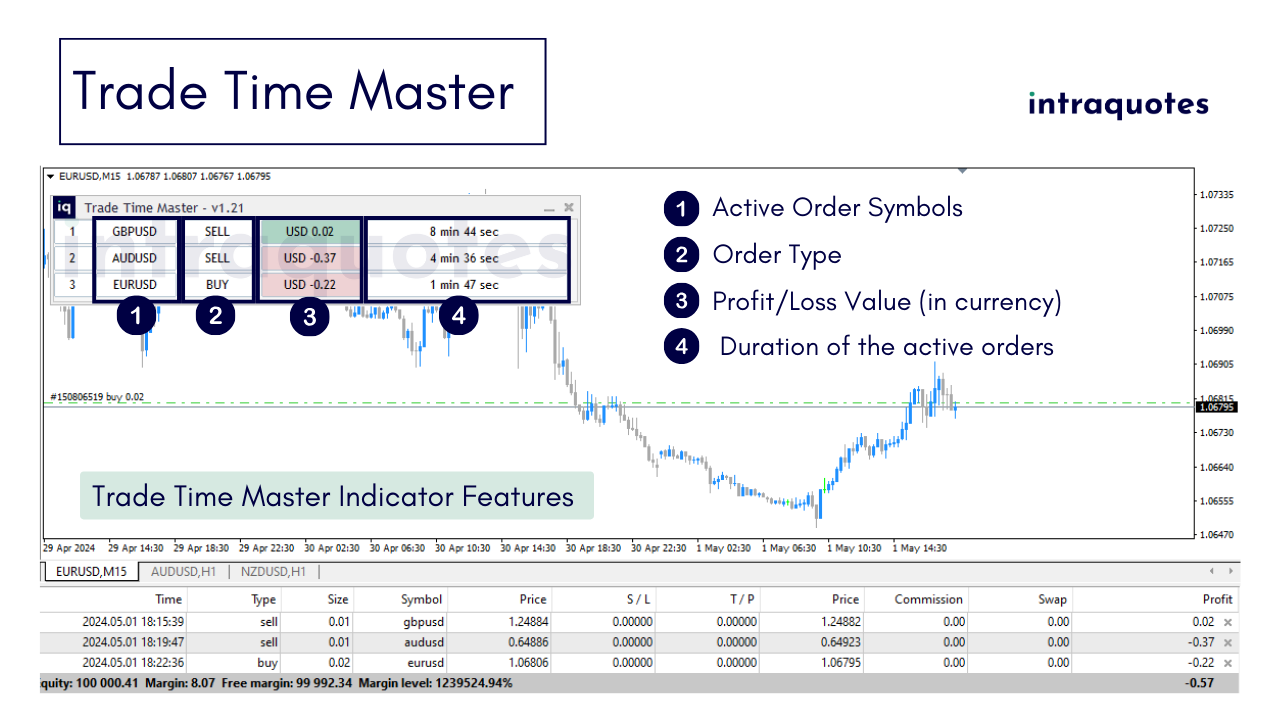
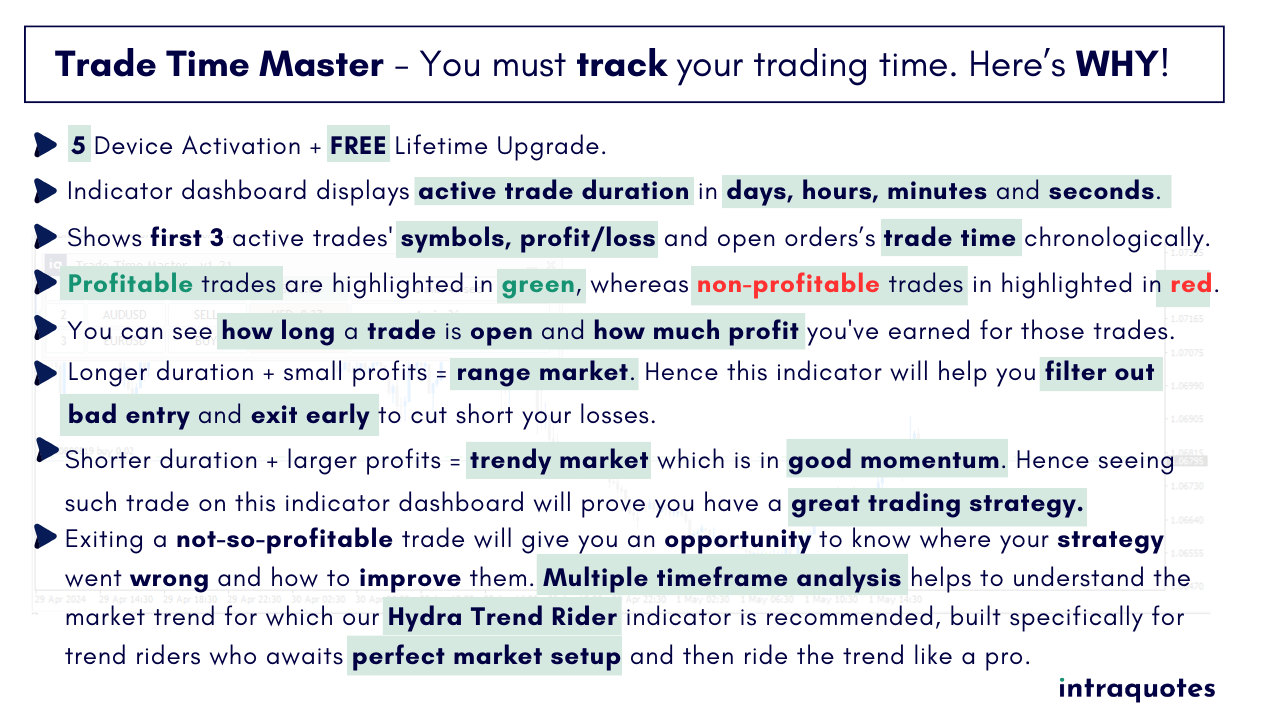
Time Display:- Indicator shows first 3 active trades (buy/sell trades) time duration in Days, Hours, Minutes, Seconds.
- Time duration means how long the order is active in the market, how long the order is running.
- Indicator shows Instrument symbol, profit/loss, trading serial number chronologically.
- Trade Duration Insights: Get the power of monitoring the time duration of your first sight.
- 3 active trades (buy/sell) in a clear and concise format. Understand how long your orders have been active in the market with precision.
Order Activity Display:
The indicator displays Instrument symbols, profit/loss, and trading serial numbers chronologically, offering a comprehensive overview of your trading history.
Real-Time Data Refresh:
Stay up-to-date with your order activity as the indicator refreshes its data on the chart according to the ongoing order activity.
Enhance Your Trading Today:
Trade Time Master integrates seamlessly with your trading environment, providing valuable insights into the duration of your active trades. For any queries or assistance, contact our dedicated support team.
Indicator Settings:
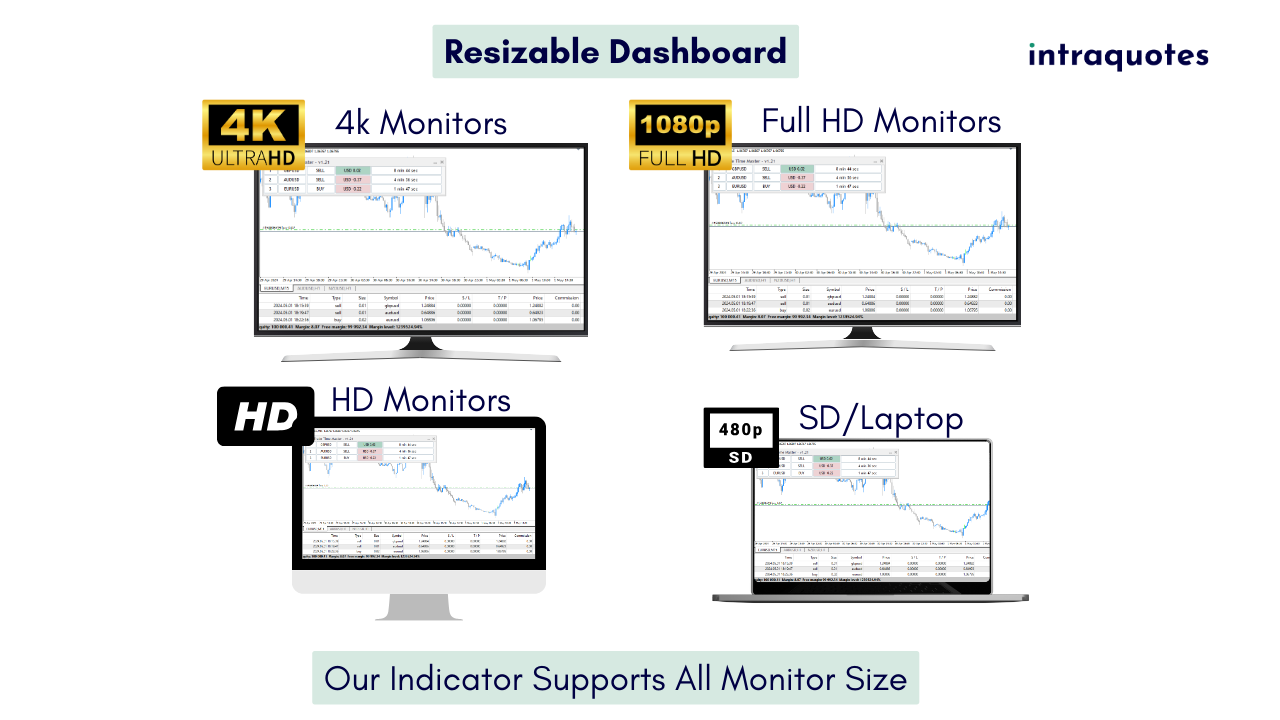
Size of the indicator:
- Default (SD)
- 125% (HD)
NOTE: Indicator works best with all the default symbols available in Metatrader and with the broker. Indicator is incompatible with custom symbols.
Indicator Strategy:
The Trade Time Master indicator serves as a valuable tool for filtering out sluggish trades and gauging trade quality. For instance, in intraday trading, if a trade persists for more than 3-4 hours and yields only 3 pips, it strongly suggests that the trade was initiated during a range-bound market. This indicates that the market remains stagnant within a range, with little movement in price.
Contact us:
For any issues, bug reports, or suggestions, feel free to contact us, comment on the product page, or DM us. Your feedback is crucial for an exceptional experience.
Service Limitation:
It is requested that download must be refrained from if the buyer is from India, Bangladesh, or Pakistan, as developer support for these regions is unavailable due to legal restrictions.
Risk Disclosure:
Our indicator doesn't guarantee future profits or losses. Trade responsibly, understanding that IntraQuotes or program developer is not liable for any incurred losses or the precision of signals. Our product serves as visual guidance, adding value to informed trading decisions.
Copyright © INTRAQUOTES a brand of Taracode International.
Related Topics:
Trade Duration Analysis, Order Activity Monitoring, Trading Precision, Active Trade Duration, Lifetime Trading Insights, trend following, trend reversal, candlestick chart, indicator dashboard,mt4,metatrader4, current trade duration.


ユーザーは評価に対して何もコメントを残しませんでした