PZ Swing Trading MT5
- インディケータ
- PZ TRADING SLU
- バージョン: 7.0
- アップデート済み: 18 7月 2024
- アクティベーション: 20
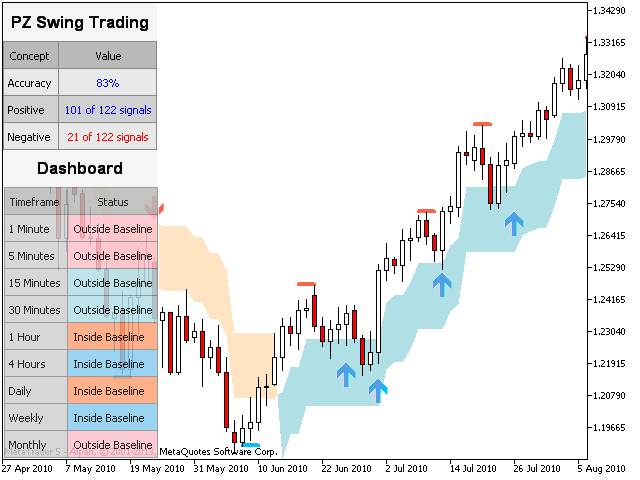
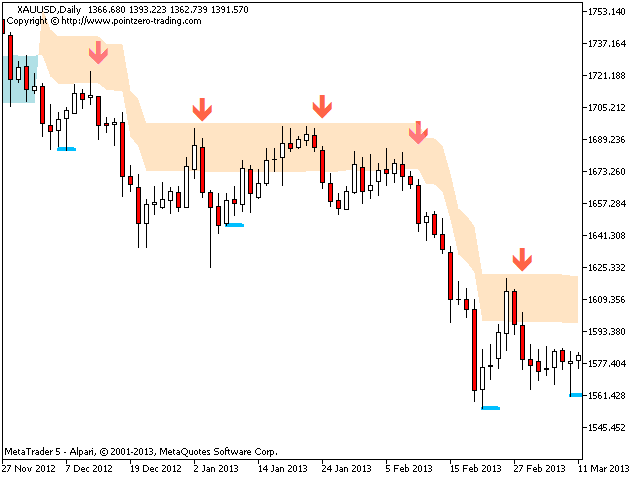
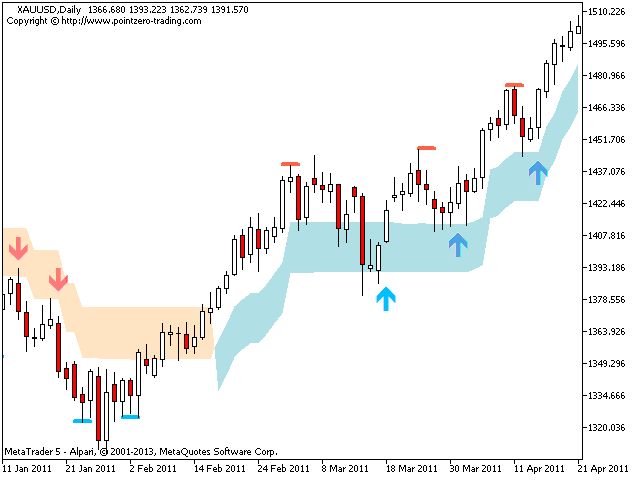
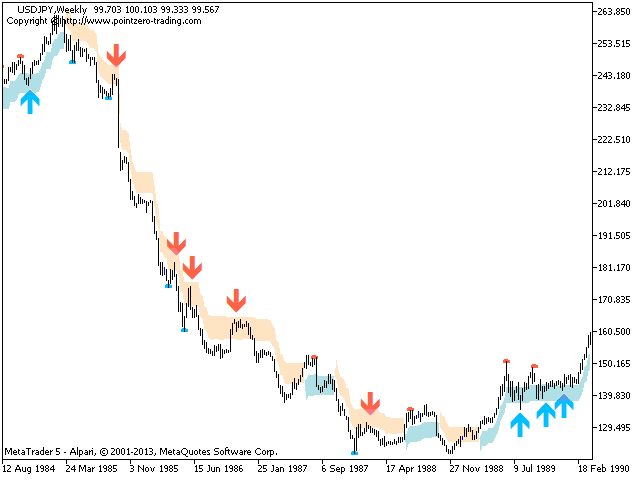
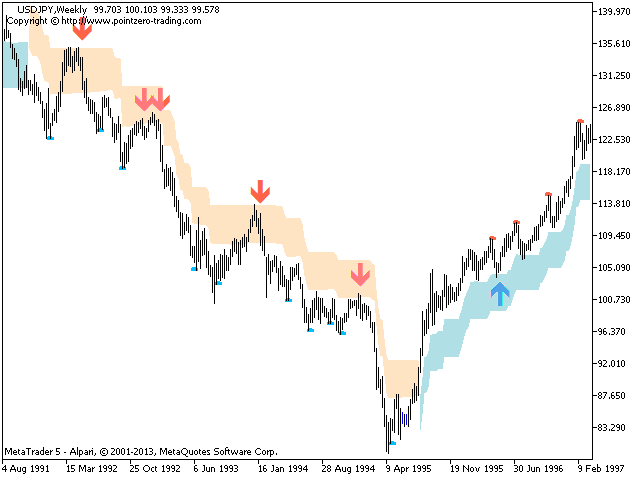
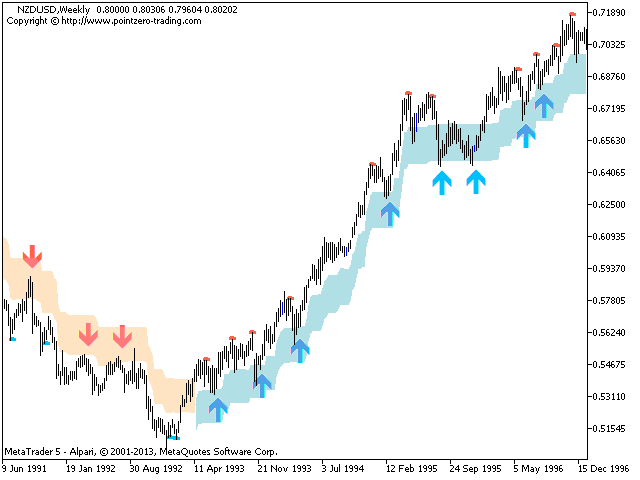
スイングトレーディングは、トレンドの方向のスイングと可能な反転スイングを検出するように設計された最初のインジケーターです。トレーディングの文献で広く説明されているベースラインスイングトレーディングアプローチを使用します。インディケータは、いくつかの価格と時間のベクトルを調査して、全体的なトレンドの方向を追跡し、市場が売られ過ぎまたは買われ過ぎて修正の準備ができている状況を検出します。
[ インストールガイド | 更新ガイド | トラブルシューティング | よくある質問 | すべての製品 ]
- むち打ちを起こさずに市場スイングの利益
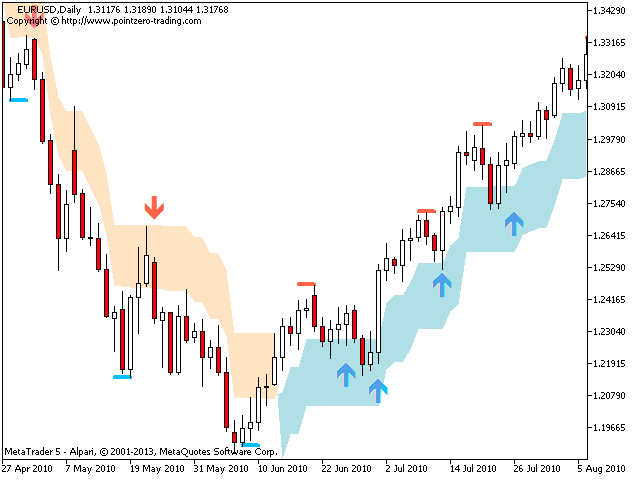
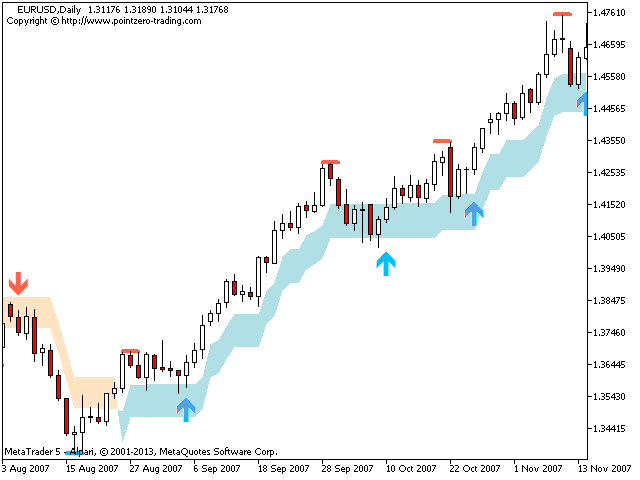
- インジケーターは常にトレンドの方向を表示します
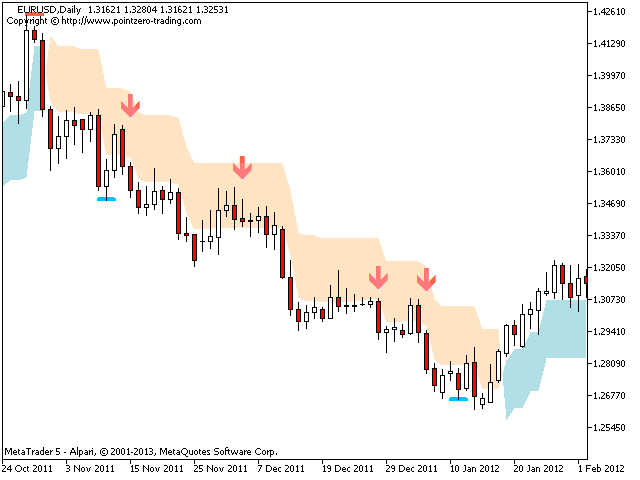
- 色付きの価格帯は機会のベースラインを表します
- 色付きのダッシュは、可能な反転スイングを表します
- この指標は、独自の品質とパフォーマンスを分析します
- 複数時間枠のダッシュボードを実装します
- カスタマイズ可能なトレンドおよびスイング期間
- 電子メール/サウンド/プッシュアラートを実装します
- インジケータは再描画またはバックペインティングではありません
Swing Tradingとは
Swing Tradingは、1日から1週間以内にセキュリティの利益を獲得しようとする取引のスタイルですが、一部の取引は最終的にはより長く生き続けることができます。スイングトレーダーはテクニカル分析を使用して弱さを買い、強さを売り、これらの機会が起こるのを待つ忍耐を持っています
機会ベースライン
履歴データに関する多くの調査により、スイングトレーディングに適した市場は、平均真の範囲を使用して計算された色付きのバンドでチャートに描かれているベースライン価格帯を上下に取引する傾向があることが証明されています。ベースラインはスイングトレーダーが使用します。この戦略では、正常を購入してマニアを売ったり、正常を短絡させてうつ病をカバーしたりします。枯渇パターンがない場合、スイングトレーダーは、株価が上昇しているときはベースラインで長くなり、株価が下降しているときはベースラインで短くなります。
Swingトレーダーは、1回のトレードでホームランを打つことを望んでいません。彼らは正確にその底で株を買い、その上で正確に売る完璧なタイミングを心配していません。完璧な取引環境では、在庫がベースラインに達するのを待ってから動きを確認します。
現在またはそれ以上の時間枠で強い上昇トレンドまたは下降トレンドが発生している場合、ストーリーはより複雑になります。トレーダーは、株価がベースラインを下回ったときに逆説的に長くなり、株価が上昇トレンドに戻るのを待つか、ベースラインより上に刺された株をショートさせ、長いトレンドが下がった場合に下落するのを待ちます。このため、インジケーターには反転が色付きのダッシュとして表示されます。
入力パラメータ
- トレンド期間-このパラメーターは、トレンドの変化に対する感度を制御します。大きなトレンド期間は、キャプチャされるより長いトレンドにつながります。トレンド期間が短いと、キャプチャされるトレンドが短くなりますが、トレンドの変化はより速く認識されます。
- ベースライン期間-このパラメーターは、ベースラインの感度を制御します。ベースラインの期間は、常にトレンド期間よりも短くする必要があります。より大きな機会帯域を使用して取引するにはそれを増やし、小さくするには小さくします。
- スイングシグナルの表示-価格がベースラインに戻ってブレークアウトしたときに矢印を表示するには、このパラメーターを有効にします。
- 修正の表示-トレンドの修正が開始されたときに色付きのダッシュを表示するには、このパラメーターを有効にします。
- ダッシュボードを表示する-このパラメーターを有効にすると、チャート上にマルチタイムフレームダッシュボードが表示されます。
- 統計の表示-このパラメーターを有効にすると、統計ダッシュボードがチャートに表示されます。
- 描画設定-矢印と反転ダッシュの独自の色とサイズを選択します。
- アラート-パターンの表示/電子メール/プッシュ/サウンドアラートを有効にします。
サポートと質問
ヘルプデスクを使用して、質問やタイムリーなサポートを受けてください。 help@pointzero-trading.comにメールを書いてください。 著者
ArturoLópezPérez、個人投資家および投機家、ソフトウェアエンジニア、Point Zero Trading Solutionsの創設者。

I like it. I prefer it on longer time frames and as Arturo says, use an oscillator to verify signals; which will further improve the base line efficiency score (frequently in the region of 80%).
Note: This is the first review since the recent update Feb 2019.
26/04/21: Indicator has been updated. Appreciate the continued support for this product.