• 概要
  • レビュー (19)
  • コメント (49)
  • 最新情報

FX Volume MT5

4.93

FXのボリュームで真のエッジを得る:究極の出来高指標

FX Volumeは、インサイダーの視点から真の市場センチメントを明らかにする最初で唯一の出来高指標です。機関投資家やブローカーがどのようなポジションをとっているかについての独自の洞察を提供することで、FX Volumeは、通常大手にのみ許される先見の明をもって取引することを可能にします。COTレポートの遅れとはおさらばです。FX Volumeは、この重要な情報をチャート上で即座に提供し、より迅速でスマートな取引判断を可能にします。


FX Volumeがあなたの取引に不可欠な理由

FX Volumeを使用すると、独自の市場データに比類なくアクセスできるため、一般的な出来高指標では得られない洞察力を得ることができます。チャート上で直接追跡できる内容は以下の通りです:

  • ポジション比率:市場センチメントを明確に把握するために、通貨間のロング・ショート比率をご覧ください。
  • 比率の変化:選択した時間枠におけるロングポジションの変化率を表示します。
  • 総取引量:通貨全体の総取引量(ロングとショート)をリアルタイムで追跡します。
  • 詳細なロングとショートの取引量:各通貨の売買量を正確に把握できます。
  • ネットロングボリューム:ロングポジションとショートポジションの差を見て、ネットセンチメントを測定します。
  • ネットロングの変化率:ネットロングのセンチメントの変化をパーセンテージで把握し、素早く比較できます。
  • 出来高と価格の相関関係:出来高が価格にどのように影響するかを追跡し、潜在的な転換点を見つけます。


FX Volumeの独自データへのアクセス方法

  1. お使いの端末の許可URLにURL https://stein.investments
  2. SI Connectを別のチャートにインストールして実行すると、データが取り込まれ、メインチャートで表示できるようになります。


重要なリンク


FX出来高が強力な理由

FX市場は分散化されており、従来の出来高指標では全体像を把握することはできません。2018年10月以降、当社は多様なグローバル・ソースからの実際の取引データを分析し、記録しています。このデータは継続的にモニターされ、最も重要な通貨、そして金までをカバーする読みやすいインデックスに編集されています。将来的には、指数やコモディティなどに関する洞察を提供するために、このツールを拡張することを目指しています。


FX出来高の仕組み

当社のデータは、「大口プレーヤー」の視点から市場を表示し、個人トレーダーが見逃す潜在的な反転や機会を見つけるのに役立ちます:

  1. お客様が注文を出すと、ブローカーはその注文を反対側に出すか、または機関投資家にルーティングし、完全なポジションを形成します。
  2. 当社の匿名データプロバイダーは、これらのライブポジションを共有し、さまざまなブローカーにわたるリテールトレーダーの取引量トレンドを示します。
  3. このデータにより、個人トレーダーのバイアスを観察し、実際の市場の動きと一致しているかどうかを調べることができる。多くの場合、そうではありません。
  4. FX Volumeは、このデータを「逆張り」の視点で解釈し、リテール・トレーダーのポジショ ンに基づいて主要プレーヤーがどのように行動するかを示す。例えば、リテールが80%ロングなら、FX Volumeは機関投資家の視点から80%ショートのスタンスを表示し、潜在的な市場の方向性を驚くほど正確に明らかにします。


FX Volumeの多彩な機能

  • カスタマイズ可能な分析期間:あらゆる時間枠の取引量を比較できるため、常に必要な正確なビューを得ることができます。
  • 履歴データオプション:様々な履歴ラインと時間枠から選択できるため、分析を集中させ、明確にすることができます。
  • マルチインスタンス機能:1つのチャートに複数のFX出来高インスタンスを組み合わせて、包括的な市場概観をご覧いただけます。
  • 広範なアラートシステム:重要なパラメータやしきい値に基づいたアラートを受け取ることで、あらゆる重要な変化を常に把握することができます。
  • スタイリッシュで適応性の高いビジュアル:設定に合わせて色やスタイルをカスタマイズして、インディケータを自分好みのものにしましょう。
  • 便利なスケジューリング:アラートを受信するタイミングをコントロールし、お客様独自の取引スケジュールに合わせることができます。


    ご不明な点がございましたら、お気軽にお問い合わせください。


    限定トレーディング・コミュニティの一員に!

    購入後、スクリーンショットを共有すると、500人以上のメンバーで構成されるプライベート・トレーディング・グループへご招待いたします。


    あなたのトレーディングを向上させる準備はできていますか?

    FX Volumeは、「ビッグプレーヤー」の目を通してマーケットを紹介することで、あなたに競争力を与えます。今すぐ参加して、有益な情報に基づいた取引のための貴重なアドバンテージを手に入れましょう。


    よろしくお願いします、

    ダニエルとアラン


    レビュー 19
    raulovalle
    90
    raulovalle 2023.12.23 22:34 
     

    Hello ... I bought the FX Volume and I must have a fact to add me to the telegram or it is the same telegram they use in general.

    Oliver Henry
    613
    Oliver Henry 2023.07.24 22:20 
     

    Very good indicator and totally unique on the retail forex market. The insight a trader can get from this is a real edge for trading. The support is also very good as are the daily updates that are published on the chat group.

    bandelero
    454
    bandelero 2023.06.16 16:15 
     

    I have now closed the second week of trading with FX Power and FX Volume with net gain of 2.7%. I am really pleased how the indicators gives me a quick overview of the market and help me to choose the relevant currency to trade for the day.

    おすすめのプロダクト
    MT4版  |  FAQ Owl Smart Levels Indicator は、 Bill Williams の高度なフラクタル、市場の正しい波構造を構築する Valable ZigZag、エントリの正確なレベルをマークする Fibonacci レベルなどの一般的な市場分析ツールを含む 1 つのインジケーター内の完全な取引システムです。 利益を得るために市場と場所に。 戦略の詳細な説明 インジケータを操作するための指示 顧問-取引助手 プライベートユーザーチャット ->購入後に私に書いて、私はプライベートチャットにあなたを追加し、あなたはそこにすべてのボーナスをダウンロードすることができます 力はシンプルさにあります! Owl Smart Levels 取引システムは非常に使いやすいので、専門家にも、市場を勉強し始めて自分で取引戦略を選択し始めたばかりの人にも適しています。 戦略と指標に秘密の数式や計算方法が隠されているわけではなく、すべての戦略指標は公開されています。 Owl Smart Levels を使用すると、取引を開始するためのシグナルをすばやく確認し、注文を出すため
    Noize Absorption Index - is the manual trading system that measures the difference of pressure between bears forces and bulls forces. Green line - is a noize free index that showing curent situation. Zero value of index shows totally choppy/flat market.Values above zero level shows how powerfull bullish wave is and values below zero measures bearish forces.Up arrow appears on bearish market when it's ready to reverse, dn arrow appears on weak bullish market, as a result of reverse expectation.
    Your Trend Friend
    Luigi Nunes Labigalini
    5 (1)
    The trend is your friend! Look at the color of the indicator and trade on that direction. It does not  repaint. After each candle is closed, that's the color of the trend. You can focus on shorter faster trends or major trends, just test what's most suitable for the symbol and timeframe you trade. Simply change the "Length" parameter and the indicator will automatically adapt. You can also change the color, thickness and style of the lines. Download and give it a try! There are big movements
    Trading Utility for Forex Currency Pairs Only not for Gold  Functions Auto Lot Calculation based on Risk Auto stoploss  Auto TakeProfit Breakeven Auto Close Half % Close in percentage with respect to the PIPs Pending Orders BuyLimit Sell Limit with distances BuyStop Sell Stop    with distances Trading Informations Risk in percentage For Multiple trades Combine Takeprofit and Combine Stoplosses
    プレミアムレベルは、正しい予測の精度が80%を超える独自の指標です。 この指標は、最高のトレーディングスペシャリストによって2か月以上テストされています。 あなたが他のどこにも見つけられない作者の指標! スクリーンショットから、このツールの正確さを自分で確認できます。 1は、1キャンドルの有効期限を持つバイナリーオプションの取引に最適です。 2はすべての通貨ペア、株式、商品、暗号通貨で機能します 手順: 赤い矢印が表示されたらすぐにダウントレードを開き、青い矢印が表示されたら閉じます。青い矢印の後に開くこともできます。 試してテストしてください!推奨設定はデフォルトです! 日足チャートで最高の精度を示します! インディケータは、2600 Pipsの収益性に対して、約10Pipsという非常に小さなマージンを使用します。
    Mine Farm is one of the most classic and time-tested scalping strategies based on the breakdown of strong price levels. Mine Farm is the author's modification of the system for determining entry and exit points into the market... Mine Farm - is the combination of great potential with reliability and safety. Why Mine Farm?! - each order has a short dynamic Stop Loss - the advisor does not use any risky methods (averaging, martingale, grid, locking, etc.) - the advisor tries to get
    Was: $249  Now: $99   Market Profile defines a number of day types that can help the trader to determine market behaviour. A key feature is the Value Area, representing the range of price action where 70% of trading took place. Understanding the Value Area can give traders valuable insight into market direction and establish the higher odds trade. It is an excellent addition to any system you may be using. Inspired by Jim Dalton’s book “Mind Over Markets”, this indicator is designed to suit the
    数列の一つに「森林火災数列」があります。これは、最も美しい新しいシーケンスの 1 つとして認識されています。その主な特徴は、このシーケンスが線形トレンドを回避することです。最短のものであってもです。この指標の基礎を形成したのはこのプロパティです。 財務時系列を分析する場合、この指標は可能なすべての傾向オプションを拒否しようとします。そして失敗した場合にのみ、トレンドの存在を認識し、適切なシグナルを発します。このアプローチにより、新しいトレンドの始まりの瞬間を正しく判断できます。ただし、偽陽性の可能性もあります。それらの数を減らすために、このインジケーターに追加のフィルターが追加されました。新しいバーが開くとシグナルが生成されます。いずれの場合も再描画は発生しません。 指標パラメータ: Applied Price   - 適用価格定数; Period Main   - インディケータのメイン期間、その有効な値は 5 ~ 60 です。 Period Additional   - 追加の期間。このパラメーターの有効な値は 5 ~ 40 です。 Signal Filter   - 追加の信号
    The Penta-O is a 6-point retracement harmonacci pattern which usually precedes big market movements. Penta-O patterns can expand and repaint quite a bit. To make things easier this indicator implements a twist: it waits for a donchian breakout in the right direction before signaling the trade. The end result is an otherwise repainting indicator with a very reliable trading signal. The donchian breakout period is entered as an input. [ Installation Guide | Update Guide | Troubleshooting | FAQ | A
    SolarTrade Suite 金融指標: Jupiter 市場指標 - 金融市場の世界で信頼できるガイド! これは、革新的で高度なアルゴリズムを使用して値を計算するトレンド指標であり、見た目にも美しいデザインです。 この指標の読みは非常に簡単に理解できます。青色は買い、赤色は売りです。 説明の下部にある SolarTrade Suite シリーズの他の製品をご覧ください。 投資と金融市場の世界を自信を持ってナビゲートしたいですか? SolarTrade Suite 金融指標: Jupiter 市場指標は、情報に基づいた投資決定を行い、利益を増やすのに役立つように設計された革新的なソフトウェアです。 SolarTrade Suite 金融指標: Jupiter 市場指標の利点: - 正確な予測: 当社の指標は、高度なアルゴリズムと分析方法を使用して、市場の動きを正確に予測します。 資産の売買に最適なタイミングに関するシグナルを受け取ります。 - ユーザーフレンドリーなインターフェース: 直感的なインターフェースにより、プログラムを簡単にマスターし、インス
    これは、価格ラベル付きのAdvanced ZigZagDynamic および/または ExtendedFractals インジケーターの極値に基づくサポートおよびレジスタンスレベルのMTFインジケーターです(無効にすることができます)。 MTFモードでは、より高いTFを選択できます。デフォルトでは、レベルはZigZagインジケータードットに基づいて生成されます。フラクタルインジケータードットは、ZigZagと一緒に、またはその代わりに使用することもできます。使用を簡素化し、CPU時間を節約するために、計算はバーの開口部ごとに1回実行されます。 パラメーター: ForcedTF-レベル計算のチャート時間枠(現在の時間枠と等しいか、それを超える場合があります) MinPipsLevelWidth-ポイント単位の最小レベル幅(非常にタイトなレベルに使用) Use ZigZag Extremums points -ZigZagピークを使用してサポート/抵抗レベルを計算することを有効/無効にします Fixed pips range -ジグザグインジケーターを計算するための最小値と最大値の間の距離
    The Volume by Price Indicator for MetaTrader 5 features Volume Profile and Market Profile TPO (Time Price Opportunity). Volume and TPO histogram bar and line charts. Volume Footprint charts. TPO letter and block marker collapsed and split structure charts. Static, dynamic and flexible range segmentation and compositing methods with relative and absolute visualizations. Session hours filtering and segment concatenation with Market Watch and custom user specifications. Graphical layering, positio
    Improved version of the free HMA Trend indicator (for MetaTrader 4) with statistical analysis. HMA Trend is a trend indicator based on the Hull Moving Average (HMA) with two periods. HMA with a slow period identifies the trend, while HMA with a fast period determines the short-term movements and signals in the trend direction. The main differences from the free version: Ability to predict the probability of a trend reversal using analysis of history data. Plotting statistical charts for analyz
    Volality Index scalper indicator  Meant for Volality pairs such as Volality 10, 25, 50, 75 and 100 The indicator works on all timeframes from the 1 minute to the monthly timeframe the indicator is non repaint the indicator has 3 entry settings 1 color change on zero cross 2 color change on slope change 3 color change on signal line cross Orange line is your sell signal Blue line is your buy signal.
    インディケータは現在のクオートを作成し、これを過去のものと比較して、これに基づいて価格変動予測を行います。インジケータには、目的の日付にすばやく移動するためのテキスト フィールドがあります。 オプション: シンボル - インジケーターが表示するシンボルの選択; SymbolPeriod - 指標がデータを取る期間の選択; IndicatorColor - インジケータの色; HorisontalShift - 指定されたバー数だけインディケータによって描画されたクオートのシフト; Inverse - true は引用符を逆にします。false - 元のビュー。 ChartVerticalShiftStep - チャートを垂直方向にシフトします (キーボードの上下矢印)。 次は日付を入力できるテキストフィールドの設定で、「Enter」を押すとすぐにジャンプできます。
    Renko Gold
    Ignacio Agustin Mene Franco
    Renko Gold! clearly indicates the floors and ceilings where it goes from 4 lines, the line below that marks the floor in green confirming with the thinnest line clarifies the purchase entry, the same is for sale, the top line marks the ceiling and the thinnest red line marks the sale, This indicator works for all temporalities! For Forex and Synthetic Indices markets! It also works for crypto markets! Good profit! World Investor.
    Do you, like me, like to trade with the trend? Then this indicator will help you! Rainbow Trend is a trend indicator, which uses several Moving Averages on the chart. It measures different trend strenght zones for different periods: very long term, long term, mid term, short term and very short term. Each zone has its color, and it is possible to have sound alert when the prices leaves a zone and enters another. Its configuration is very simple. If you find any bug or have any suggestions, co
    Basic Support and Resistance   インジケータは、テクニカル分析を強化するために必要なソリューションです。このインジケータを使用すると、チャートにサポートレベルとレジスタンスレベルを投影できます/ mt4バージョン 機能 フィボナッチレベルの統合: サポートと抵抗レベルとともにフィボナッチレベルを表示するオプションを使用すると、私たちの指標は市場行動と逆転領域の可能性についてさらに深い洞察を提供します。 パフォーマンスの最適化: 各バーの開口部のみで拡張ラインを更新するオプションを使用すると、インジケータは、サポートレベルと抵抗レベルの精度を犠牲にすることなく最適なパフォーマンスを保証します。 入力 メイン設定 Timeframe:  この入力を通じて、より高い時間枠のサポートラインとレジスタンスラインをチャート上に表示することを選択できます。 Support/Resistance Strength [Number of Bars]:   この入力を使用して、サポートと抵抗の強度を決定できます。数が高いほど、サポート/抵抗がより強くなります。
    The Riko Trend indicator is a revolutionary trend trading and filtering solution with all the important features of a trend tool built into one tool! The Riko Trend indicator is good for any trader, suitable for any trader for both forex and binary options. You don’t need to configure anything, everything is perfected by time and experience, it works great during a flat and in a trend. The Riko Trend indicator is a technical analysis tool for financial markets that reflects the current price
    トレンドキャッチャー: アラートインジケーター付きのトレンドキャッチャーストラテジーは、市場トレンドやポテンシャルなエントリーポイントやエグジットポイントを特定するのに役立つ多目的な技術分析ツールです。動的なトレンドキャッチャーストラテジーを備えており、市場状況に適応してトレンドの方向を明確に視覚化します。トレーダーは、自身の好みやリスク許容度に合わせてパラメーターをカスタマイズできます。このインジケーターはトレンドの識別を支援し、ポテンシャルなリバーサルをシグナルし、トレイリングストップのメカニズムとして機能し、市場への迅速な対応のためのリアルタイムアラートを提供します。 特徴: - トレンドの識別:上昇トレンドと下降トレンドをシグナルします。 - トレンドのリバーサル:ローソク足の色が上昇から下降に変わった場合やその逆の場合に、ポテンシャルなリバーサルを警告します。 - リアルタイムアラート:新しいトレンドの識別に対するアラートを生成します。 推奨事項: - 通貨ペア:EURUSD、AUDUSD、XAUUSDなど... - タイムフレーム:H1。 - アカウン
    FREE
    Fibo Daily Channel Indicator The  Indicator is a powerful tool for traders, providing precise daily support and resistance levels based on Fibonacci retracement and extension calculations. This indicator automatically draws key pivot points (PP, R1, R2, S1, S2) as well as additional extension levels (R3, R4, S3, S4), helping traders identify potential reversal and breakout zones with ease. It includes customizable alerts and push notifications, allowing traders to receive updates whenever the pr
    US30NinjaMT5
    Satyaseelan Shankarananda Moodley
    US30 Ninja is a 5 minute scalping indicator that will let know you when there is a trade set up (buy or sell). Once the indicator gives the trade direction, you can open a trade and use a 30 pip stop loss and a 30 pip to 50 pip take profit. Please trade at own own risk. This indicator has been created solely for the US30 market and may not yield positive results on any other pair. 
    This indicator displays pivot points in the chart, including historical vales, and supports many calculation modes for Pivot Points and S/R levels. [ Installation Guide | Update Guide | Troubleshooting | FAQ | All Products ] It plots historical levels for backtesting purposes It allows you to select the reference timeframe It implements different Pivot Point calculation modes It implements different SR calculation modes It implements customizable colors and sizes Calculation Modes The indi
    PipFinite Trend PRO MT5
    Karlo Wilson Vendiola
    4.84 (546)
    Breakthrough Solution For Trend Trading And Filtering With All Important Features Built Inside One Tool! Trend PRO's smart algorithm detects the trend, filters out market noise and gives entry signals with exit levels. The new features with enhanced rules for statistical calculation improved the overall performance of this indicator. Important Information Revealed Maximize the potential of Trend Pro, please visit www.mql5.com/en/blogs/post/713938 The Powerful Expert Advisor Version Automa
    Magic Finger can help you identify trends and trading opportunities clearly. The finger points to the open position signal, and the discoloration line is confirmed by the trend. If you are a day trader, you can choose to trade during a period of active trading, referring to the discoloration line as the basis for the next order, finger signal as a filter. If you are a trend trader, you can choose a period above H1, wait for the appearance of the finger signal in the key price area, and enter t
    インジケーターについて このインジケーターは、金融商品の終値に対するモンテカルロシミュレーションに基づいています。モンテカルロ法とは、以前の観測結果に基づくランダムな数値を使用して、さまざまな結果の確率をモデル化するための統計的手法です。 どのように機能しますか? このインジケーターは、歴史的データに基づき、時間の経過とともにランダムに価格が変動する複数の価格シナリオを生成します。各シミュレーション試行は、 終値 の変動を考慮するためのランダム変数を使用し、与えられた期間における将来の市場変動を効果的に模倣します。 モンテカルロシミュレーションの利点 - モンテカルロシミュレーションは、複数の将来のシナリオに対して戦略をテストすることで、さまざまなトレード戦略のリスクを分析するのに役立ちます。 - 稀な極端なイベント(テールリスク)を含むさまざまな市場状況で戦略のパフォーマンスを把握することができます。 - 単一の予測に依存するのではなく、モンテカルロ法は関連する確率を伴う潜在的な結果の範囲を提供します。これにより、利益や損失の可能性を理解するのに役立ちます。 モンテカルロ
    まず第一に、この取引インジケーターは再描画されず、再描画されず、遅延しないことを強調する価値があります。これにより、手動取引とロボット取引の両方に理想的なものになります。 ユーザーマニュアル:設定、入力、戦略。 アトミックアナリストは、価格の強さとモメンタムを利用して市場でより良いエッジを見つけるためのPA価格アクションインジケーターです。ノイズや誤ったシグナルを除去し、取引ポテンシャルを高めるための高度なフィルターを備えています。複雑なインジケーターの複数のレイヤーを使用して、アトミックアナリストはチャートをスキャンし、複雑な数学的計算をシンプルなシグナルと色に変換します。これにより、どのような初心者トレーダーでも理解して使用し、一貫した取引の決定を行うことができます。 「アトミックアナリスト」は、新規および経験豊富なトレーダー向けにカスタマイズされた包括的な取引ソリューションです。プレミアムインジケーターとトップノッチの機能を1つの取引戦略に組み合わせ、すべてのタイプのトレーダーにとって汎用性のある選択肢にします。 デイリートレーディングとスキャルピング戦略:高速で正確な
    まず第一に、この取引ツールはノンリペイント、ノンリドロー、ノンラグの指標であり、プロの取引に理想的ですことを強調する価値があります。 オンラインコース、ユーザーマニュアル、デモ。 スマートプライスアクションコンセプトインジケーターは、新米から経験豊富なトレーダーまで、非常 に強力なツールです。Inner Circle Trader AnalysisやSmart Money Concepts Trading Strategiesなど、20以上の有用な指標を1つに組み合わせています。このインジケーターはスマートマネーコンセプトに焦点を当て、大手機関の取引方法を提供し、彼らの動きを予測するのに役立ちます。 特に、流動性分析に優れており、機関がどのように取引しているかを理解しやすくしています。市場のトレンドを予測し、価格の動きを慎重に分析するのに優れています。機関の戦略とトレードを合わせることで、市場の動向についてより正確な予測ができます。このインジケーターは多目的であり、市場構造を分析し、重要な注文ブロックを特定し、さまざまなパターンを認識するのに優れています。 このインジ
    ICT Kill zone and Macros Indicator mark and display the following zone times on the chart: Kill zones   Kill zone Forex Asian London Open New York Open London Close Central Bank Dealing range Kill zone Indices Asian London Open New York AM New York Lunch New York PM Power Hour Macros London 1 London 2 New York Am 1 New York AM 2 New York Lunch New York PM 1 New York PM 2 Silver bullet London Open New York AM New York PM Sessions Asian London New York Chart The display of  Kill zone ,
    Laguerre SuperTrend Clouds   adds an Adaptive Laguerre averaging algorithm and alerts to the widely popular SuperTrend indicator. As the name suggests,   Laguerre SuperTrend Clouds (LSC)   is a trending indicator which works best in trendy (not choppy) markets. The SuperTrend is an extremely popular indicator for intraday and daily trading, and can be used on any timeframe. Incorporating Laguerre's equation to this can facilitate more robust trend detection and smoother filters. The LSC uses the
    このプロダクトを購入した人は以下も購入しています
    TPSpro TREND PRO は 、市場を自動的に分析し、トレンドとその各変化に関する情報を提供し、再描画せずに取引にエントリーするためのシグナルを提供するトレンド指標です。 インジケーターは各ローソク足を使用し、個別に分析します。上向きまたは下向きのさまざまな衝撃を指します。通貨、仮想通貨、金属、株、指数の取引への正確なエントリーポイント! バージョンMT5                   インジケーターの完全な説明     RFI LEVELS インジケーター と併用することをお勧めします。 主な機能: レンダリングなしで正確な入力信号! シグナルが表示されると、それは関連性を維持します。これは、シグナルを提供してからそれを変更し、その結果、入金された資金が失われる可能性があるリドローインジケーターとの重要な違いです。より高い確率と精度で市場に参入できるようになりました。矢印が表示された後、ターゲットに到達する (利益確定) か反転シグナルが表示されるまで、ローソク足に色を付ける機能もあります。 STOP-LOSS/TAKE-PROFITゾーンの表示 エントリーポイン
    指示する     ロシア     -        utilizar con   el indicador の ESP 推奨事項 -   TPSpro トレンド プロフェッショナル版 -   MT5のバージョン 最も重要なことは、将来においても最も重要なことです。 機能のプリンシパル: ゾーンのほとんどは、ベンダーとコンプラドールによってアクティブ化されます。 状況を直感的に把握できるよう、初期の衝動を修正します。 LOGIC AI: MUESTRA zonas (círculos) parabuscar puntos de entrada cuando se activa una plantilla 視覚的に優れた視覚効果があり、最も重要な機能がすべて揃っていることに注意してください。 優れたニベレス/ゾーンの視覚化 (modo MTF) 世界で最も人気のある場所/ゾーンです。これを使用するのに最適な方法です (   TPSproTREND PRO   )。 アルゴリズム プロフェッショナル セパラド パソ ア パソ パラ オペラ それは、オペラハウスやコントラ・デ・エラの指導におい
    IVISTscalp5
    Vadym Zhukovskyi
    5 (6)
    iVISTscalp5インジケーターをご紹介します。このインジケーターは、トレーディングにおいて独自でありながら効果的です。時間データに基づくこのインジケーターは、多年にわたる経験と金融市場の深い分析の結果です。iVISTscalp5インジケーターは、手動トレーディングにとって優れたツールです。便利さ、簡単さ、可視化 - すべての複雑さが内部に隠されています。私たちは、iVISTscalp5インジケーターの設定と使用を最大限に簡素化しました。このインジケーターは、MT5ターミナルにあるすべての金融商品に適しています。 稼働時間は、4時から20時(UTC+3)です。 iVISTscalp5インジケーターメニュー(スクリーンショット1を参照): History - 引用を計算する週数 dT_min - 時間間隔の選択(分) TFline - 水平ボリュームの作成(時間枠) BARSline - 水平ボリュームの作成(バー数) TFtrend1 - デイリーチャンネルの作成(時間枠) BARStrend1 - デイリーチャンネルの作成(バー数) TFtrend2 - 週次チャンネルの作成(時
    note: this indicator is for METATRADER4, if you want the version for METATRADER5 this is the link:  https://www.mql5.com/it/market/product/108106 TRENDMAESTRO ver 2.4 TRENDMAESTRO recognizes a new TREND in the bud, he never makes mistakes. The certainty of identifying a new TREND is priceless. DESCRIPTION TRENDMAESTRO identifies a new TREND in the bud, this indicator examines the volatility, volumes and momentum to identify the moment in which there is an explosion of one or more of these data a
    TPA True Price Action indicator reveals the true price action of the market makers through 100% non-repainting signals strictly at the close of a candle! TPA shows entries and re-entries, every time the bulls are definitely stronger than the bears and vice versa. Not to confuse with red/green candles. The shift of power gets confirmed at the earliest stage and is ONE exit strategy of several. There are available now two free parts of the TPA User Guide for our customers. The first "The Basics"
    The AT Forex Indicator MT5 is a sophisticated trading tool designed to provide traders with a comprehensive analysis of multiple currency pairs. This powerful indicator simplifies the complex nature of the forex market, making it accessible for both novice and experienced traders. AT Forex Indicator uses advanced algorithms to detect trends, patterns and is an essential tool for traders aiming to enhance their forex trading performance. With its robust features, ease of use, and reliable signal
    Bill Williams Advanced is designed for automatic chart analysis using Bill Williams' "Profitunity" system. The indicator analyzes four timeframes at once. Manual (Be sure to read before purchasing) Advantages 1. Automatically analyzes the chart using the "Profitunity" system of Bill Williams. The found signals are placed in a table in the corner of the screen. 2. Equipped with a trend filter based on the Alligator indicator. Most of the system signals are recommended to be used only accordi
    今、147ドル(いくつかの更新後に499ドルに増加します) - 無制限のアカウント(PCSまたはMac) RelicusRoad ユーザー マニュアル + トレーニング ビデオ + プライベート Discord グループへのアクセス + VIP ステータス 市場の新しい見方 RelicusRoad は、外国為替、先物、暗号通貨、株式、および指数の世界で最も強力な取引インジケーターであり、トレーダーに収益を維持するために必要なすべての情報とツールを提供します。初心者から上級者まで、すべてのトレーダーが成功するためのテクニカル分析と取引計画を提供します。これは、将来の市場を予測するのに十分な情報を提供する重要な取引指標です。意味をなさないチャート上のいくつかの異なる指標ではなく、完全な解決策を信じています.これは、信号、矢印 + 価格アクション情報を表示するオールインワンのインジケーターで、他に類を見ない非常に正確です。 強力な AI に基づいて、RelicusRoad は不足している情報とツールを提供して、あなたを教育し、トレーディングのプロ、成功したトレーダーにします。
    Elliott Wave Trend was designed for the scientific wave counting. This tool focuses to get rid of the vagueness of the classic Elliott Wave Counting using the guideline from the template and pattern approach. In doing so, firstly Elliott Wave Trend offers the template for your wave counting. Secondly, it offers Wave Structural Score to assist to identify accurate wave formation. It offers both impulse wave Structural Score and corrective wave Structure Score. Structural Score is the rating to sh
    Fibonacci retracement is a method of technical analysis for determining support and resistance levels. The TSO Fibonacci Chains Indicator is different from a simple Fibonacci Retracements indicator in that it provides the targets for each retracement level. In other words, there is an Extension Level (D) for every Retracement Level (C). In addition, if an Extension Level is reached, then a new Fibonacci setup is created automatically. These consecutive Fibonacci setups create a chain that reveal
    Happy entries
    Godwill Fortune Otieno Juma
    The  product gives optimized entries for 3min ,1 hr and day timeframes  Does well with indices  ASIAN- HK50 AND CHINA A50 USA-US30,US100,US500 GER40 ,UK100 For stocks trade with the day timeframes Happy Entry employs advanced algorithms and real-time data analysis to identify optimal entry points with unprecedented accuracy. Its adaptive nature allows it to seamlessly adjust to changing market conditions, ensuring you never miss out on profitable opportunities. Whether you're a beginner or sea
    これはほぼ間違いなく、MetaTraderプラットフォームで見つけることができる最も完全な調和価格形成自動認識インジケーターです。 19種類のパターンを検出し、フィボナッチプロジェクションをあなたと同じように真剣に受け止め、潜在的逆転ゾーン(PRZ)を表示し、適切なストップロスとテイクプロフィットレベルを見つけます。 [ インストールガイド | 更新ガイド | トラブルシューティング | よくある質問 | すべての製品 ] 19の異なる調和価格形成を検出します プライマリ、派生および補完フィボナッチ投影(PRZ)をプロットします 過去の価格行動を評価し、過去のすべてのパターンを表示します この指標は、独自の品質とパフォーマンスを分析します 適切なストップロスとテイクプロフィットのレベルを表示します ブレイクアウトを使用して適切な取引を通知します すべてのパターン比をグラフにプロットします 電子メール/音声/視覚アラートを実装します スコット・M・カーニーの本に着想を得て、この指標は最も純粋で急を要するトレーダーのニーズを満たすように設計されています。ただし、トレードを
    This indicator belongs to the family of channel indicators. These channel indicator was created based on the principle that the market will always trade in a swinging like pattern. The swinging like pattern is caused by the existence of both the bulls and bears in a market. This causes a market to trade in a dynamic channel. it is designed to help the buyer to identify the levels at which the bulls are buying and the bear are selling. The bulls are buying when the Market is cheap and the bears a
    The indicator is designed to close positions on the market in time. For example: to take profits ahead of schedule if the price has not reached TakeProfit, and the market is turning around. The indicator analyzes the momentum, not the trend. He does not give any information about the trend. The indicator is well suited for finding divergence. The Ershov 38 Parrots indicator dynamically adjusts to the market and detects price movement impulses of medium and high amplitude. It almost does not rea
    WHY IS OUR FXACCCURATE LS MT5 THE PROFITABLE ? PROTECT YOUR CAPITAL WITH RISK MANAGEMENT Gives entry, stop and target levels from time to time. It finds Trading opportunities by analyzing what the price is doing during established trends. POWERFUL INDICATOR FOR A RELIABLE STRATEGIES We have made these indicators with a lot of years of hard work. It is made at a very advanced level. Established trends provide dozens of trading opportunities, but most trend indicators completely ignore them!
    "Sentiments of traders" in the financial markets is a topic that has been of interest to us for a long time. In time, we could not find the right formula to define these sentiments. We went through many stages in the search for the right methodology - from taking data from external sources to calculate open positions of buyers and sellers to calculating tick volumes, but still we were not satisfied with the results. The calculation of open positions of buyers and sellers from external sources ha
    The most crucial price level in any "Volume Profile" is the "Point of Control" . Is the price level with the highest traded volume. And mainly, is the level where the big guys start there their positions, so it's an accumulation/distribution level for smart money. The idea of the indicator arose after the "MR Volume Profile Rectangles" indicator was made. When creating the "MR Volume Profile Rectangles" indicator, we spent a lot of time comparing the volumes with those from the volume profil
    The most crucial price level in any "Volume Profile" is the "Point of Control" . Is the price level with the highest traded volume. And mainly, is the level where the big guys start there their positions, so it's an accumulation/distribution level for smart money. The idea of the indicator arose after the "MR Volume Profile Rectangles" indicator was made. When creating the "MR Volume Profile Rectangles" indicator, we spent a lot of time comparing the volumes with those from the volume profil
    Flow Bookmap
    Thalles Nascimento De Carvalho
    Flow Bookmap: 市場のフローを視覚化し、あなたの取引を守る ️ 買い手と売り手に関する正確な情報で市場を支配したいですか? Flow Bookmapは、市場の動向を深く理解したいトレーダーのための究極のツールです。注文フローのデータをMT5チャートの直感的なインターフェースに変換し、迅速で安全な意思決定のために重要な関心領域を強調表示します。 仕組み Flow Bookmapは、市場での買い手と売り手の相互作用を解釈し、重要な不均衡(imbalances)を強調表示します: 買い手が支配的な場合、売り手がより有利な条件で価格を調整できるため、価格は下がる傾向があります。 売り手が支配的な場合、価格は反対の論理で上昇する傾向があります。 さらに、このインジケーターはリアルタイムでデータを収集しながら、グラフに直接情報をプロットします。つまり、インジケーターは計算が終了するにつれて、不均衡ゾーンや買い手と売り手の相互作用を構築し、発生している市場の状態を動的かつ正確に視覚化します。大きな関心を持つ価格帯は、グラフ上の防御ゾーンとして機能し、取引を保護します。
    MetaForecast M5
    Vahidreza Heidar Gholami
    5 (2)
    MetaForecastは、価格データのハーモニクスに基づいて、どんな市場の未来を予測し視覚化します。市場が常に予測可能ではありませんが、価格にパターンがある場合、MetaForecastは可能な限り正確な未来を予測できます。他の類似製品と比較して、MetaForecastは市場のトレンドを分析することでより正確な結果を生成することができます。 入力パラメータ Past size (過去のサイズ) MetaForecastが将来の予測を生成するために使用するバーの数を指定します。モデルは選択したバー上に描かれた黄色の線で表されます。 Future size (将来のサイズ) 予測すべき将来のバーの数を指定します。予測された将来は、ピンクの線で表示され、その上に青い回帰線が描かれます。 Degree (程度) この入力は、MetaForecastが市場で行う分析のレベルを決定します。 Degree 説明  0 Degree 0の場合、価格の全てのピークや谷、そして詳細をカバーするために、「Past size」の入力に大きな値を使用することが推奨されています。  1 (推奨) Degr
    Gannスクエアインジケーターは、W.D. Gannによって執筆された「市場予測のための数学的な式」の記事に基づく強力な市場分析ツールです。このツールは、解析に数学的な概念を応用し、Gann理論に基づいています。それは、144、90、52のスクエアや9のスクエアなど、Gannの関連テクニックの要素を取り入れています。さらに、の方法を組み込んでおり、9のスクエアとその関連性についてのチャネルやスターパターンに焦点を当てています。 ユーザーマニュアルと使用方法: このインジケーターを使用する前に、ユーザーマニュアルを読んで疑問点を解決するためにお問い合わせいただくことをお勧めします。ユーザーマニュアルの完全版は、当社のウェブサイトで入手できます。 MT5の完全版は購入できますし、MT4の無料版も試すことができます。両方のバージョンへのリンクを提供していますので、ご利用ください。 主な機能と機能: Gannスクエアインジケーターは、市場分析のための完全なツールセットを提供し、幾何学的な概念とGann理論に基づいて的確な判断を行う手助けをします。以下に主な機能を示します。 9のスクエアの分析:
    Golden Spikes Detector
    Batsirayi L Marango
    2.67 (3)
    Golden Spikes Detector This indicator is based on an advanced strategy primarily for trading spikes on Boom and Crash Indices. Complex algorithms were implemented to detect high probability entries only. It alerts on potential Buy and Sell entries. To trade spikes on the Deriv or Binary broker, only take Buy Boom and Sell Cash alerts. It was optimised to be loaded on 5-minute timeframe although multiple timeframe analysis is done in the background. Features ·             Desktop pop up and sound
    収益性の高い取引機会を簡単に特定するのに役立つ強力な外国為替取引インジケーターをお探しですか?ビースト スーパー シグナル以外に探す必要はありません。 この使いやすいトレンドベースのインジケーターは、市場の状況を継続的に監視し、新しいトレンドを検索したり、既存のトレンドに飛びついたりします。ビースト スーパー シグナルは、すべての内部戦略が一致し、互いに 100% 合流したときに売買シグナルを発するため、追加の確認は不要です。シグナル矢印アラートを受け取ったら、単に売買します。 購入後、プライベート VIP グループに追加されるようにメッセージを送ってください! (完全な製品購入のみ)。 購入後、最新の最適化されたセット ファイルについてメッセージを送ってください。 MT4版は こちらから。 Beast Super Signal EA は こちらから 入手できます。 コメント セクションをチェックして、最新の結果を確認してください。 ビースト スーパー シグナルは、1:1、1:2、または 1:3 のリスクと報酬の比率に基づいて、エントリー価格、ストップ
    "Piranha" - an autonomous trading system that determines overbought and oversold levels on the chart. Red and blue zones represent overbought and oversold levels respectively. Entry points are marked with arrows: a downward arrow in the red zone for "sell" and an upward arrow in the blue zone for "buy". The Take profit level is indicated by the green moving average. Key features: Adjusting the Take profit level as the green moving average changes position. Averaging ability when a new market e
    Currently Price  20% OFF  ( for unlimited use ) Indicator   USER MANUAL , trade setups, solving issues, etc :  Direct Download Here     (  for users only  ) Hello World! Introducing.. SMCpro tool and Indicator for  MetaTrader 5 , a cutting-edge feature designed to revolutionize your trading experience. With innovative ICT Smart Money Concept, you gain unparalleled insight into market dynamics, empowering you to make informed trading decisions like never before. SMC Indicator built on th
    Introduction to Fractal Pattern Scanner Fractal Indicator refers to the technical indicator that makes use of the fractal geometry found in the financial market. Fractal Pattern Scanner is the advanced Fractal Indicator that brings the latest trading technology after the extensive research and development work in the fractal geometry in the financial market. The most important feature in Fractal Pattern Scanner is the ability to measure the turning point probability as well as the trend probabil
    Native Channels
    BeeXXI Corporation
    5 (1)
    This indicator recognizes all support and resistance levels. A number of unique high-performance techniques have been applied, which made the existence of this indicator possible. All formed channels are naturally visible: horizontal linear linear parabolic cubic (Polynomial 3 degrees - Wave) This is due to a bundle of approximating channels. The formed channels form "standing waves" in a hierarchical sequence. Thus, all support and resistance levels are visible. All parameter management is
    Imbalance DOM Pro
    Thalles Nascimento De Carvalho
    5 (1)
    Imbalance DOM Pro:注文帳の不均衡でトレードを強化 MT5で注文帳にアクセスできますか?トレードを新たなレベルに引き上げたいですか? 注文フローを基に意思決定を行っているトレーダーであれば、Imbalance DOM Proはあなたの分析を変革します。スキャルパーや短期トレーダー向けに設計されたこのツールは、注文帳の不均衡を特定し、迅速かつ正確な取引のための貴重な機会を提供します。 小さな価格変動でのチャンスを捉える Imbalance DOM Proは、価格の小さな動きをキャッチしたいトレーダーに最適なツールです。高度な計算により、このインジケーターは注文帳の不均衡を解釈し、素早いエントリーとエグジットのための重要なインサイトを提供します。 重要:MT5で注文帳が利用できることを確認してください Imbalance DOM Proを使用する前に、あなたのブローカーがMT5で注文帳にアクセスできることを確認してください。このインジケーターはリアルタイムデータに依存しているため、MT5は注文帳の履歴を保存しません。そのため、Imbalance
    Introduction to X3 Chart Pattern Scanner X3 Cherart Pattern Scanner is the non-repainting and non-lagging indicator detecting X3 chart patterns including Harmonic pattern, Elliott Wave pattern, X3 patterns, and Japanese Candlestick patterns. Historical patterns match with signal patterns. Hence, you can readily develop the solid trading strategy in your chart. More importantly, this superb pattern scanner can detect the optimal pattern of its kind. In addition, you can switch on and off individu
    How to use Pair Trading Station Pair Trading Station is recommended for H1 time frame and you can use it for any currency pairs. To generate buy and sell signal, follow few steps below to apply Pair Trading Station to your MetaTrader terminal. When you load Pair Trading Station on your chart, Pair Trading station will assess available historical data in your MetaTrader platforms for each currency pair. On your chart, the amount of historical data available will be displayed for each currency pai
    作者のその他のプロダクト
    カスタム・アラートで市場の動きを先取り:究極のマルチマーケットスキャナー カスタム・アラートは、複数の市場において可能性の高いセットアップを簡単に特定できる、強力なオールインワン・マーケット・モニタリング・ツールです。 主要8通貨(USD、CAD、GBP、EUR、CHF、JPY、AUD、NZD)、金(XAU)、最大7つの主要指数(US30、UK100、WTI、Bitcoinを含む)をカバーするCustom Alertsは、幅広い資産の重要なシフトを常にアップデートします。 このツールは、高度な FXパワー、FXボリューム、IXパワー・インジケータの データをシームレスに統合し、重要なマーケット・イベントに関するリアルタイム・アラートをお届けします。 カスタムアラートにより、常にチャートを注視することなく、潜在的な取引に対応することができます。 カスタム・アラートの主な利点 複数の市場をカバー:通貨、株価指数、コモディティ、暗号通貨を一元的に把握。 リアルタイムのイベント・アラート:重要な市場変化に関する通知で、重要な動きを見逃しません。 完全なカスタマイズ:お客様独自の取引スタイ
    究極の通貨強度計「FXパワーNG」の実力をフルに引き出す FX Powerは8年以上にわたり、信頼性の高い正確な通貨強度分析で世界中のトレーダーに力を与えてきました。 そして今、FXパワーNGはこの信頼できるツールを次のレベルに引き上げ、比類のない精度、カスタマイズ性、そして洞察力をあなたの取引にもたらす高度な機能を提供します。 FX Power NGが真剣なトレーダーの必需品である理由とは? FX Power NGは、初代FX Powerでご好評いただいたすべての機能をベースに、重要な追加と改良を加えています: 金強度分析(XAU):通貨ペアとともに金の強さを追跡し、より広範な市場洞察を得ることができます。 洗練された計算:すべての分析において、より正確で信頼性の高い結果が得られます。 カスタマイズ可能な分析期間:日中から長期的な洞察まで、取引戦略に合わせて分析期間を調整できます。 高度なマルチインスタンス設定:複数の時間枠や戦略の分析に最適な、包括的なビューのために複数のインスタンスを実行します。 グラフィックの無制限カスタマイズ:各チャートの色やスタイルを取引環境に合わせ
    FX Volume
    Daniel Stein
    4.58 (33)
    FXのボリュームで真のエッジを得る:究極の出来高指標 FX Volumeは、インサイダーの視点から真の市場センチメントを明らかにする最初で唯一の出来高指標です。機関投資家やブローカーがどのようなポジションをとっているかについての独自の洞察を提供することで、FX Volumeは、通常大手にのみ許される先見の明をもって取引することを可能にします。COTレポートの遅れとはおさらばです。FX Volumeは、この重要な情報をチャート上で即座に提供し、より迅速でスマートな取引判断を可能にします。 FX Volumeがあなたの取引に不可欠な理由 FX Volumeを使用すると、独自の市場データに比類なくアクセスできるため、一般的な出来高指標では得られない洞察力を得ることができます。チャート上で直接追跡できる内容は以下の通りです: ポジション比率:市場センチメントを明確に把握するために、通貨間のロング・ショート比率をご覧ください。 比率の変化:選択した時間枠におけるロングポジションの変化率を表示します。 総取引量:通貨全体の総取引量(ロングとショート)をリアルタイムで追跡します。 詳細なロン
    究極の通貨強度計「FXパワーNG」の実力をフルに引き出す FX Powerは8年以上にわたり、信頼性の高い正確な通貨強度分析で世界中のトレーダーに力を与えてきました。 そして今、FXパワーNGはこの信頼できるツールを次のレベルに引き上げ、比類のない精度、カスタマイズ性、そして洞察力をあなたの取引にもたらす高度な機能を提供します。 FX Power NGが真剣なトレーダーの必需品である理由とは? FX Power NGは、初代FX Powerでご好評いただいたすべての機能をベースに、重要な追加と改良を加えています: 金強度分析(XAU):通貨ペアとともに金の強さを追跡し、より広範な市場洞察を得ることができます。 洗練された計算:すべての分析において、より正確で信頼性の高い結果が得られます。 カスタマイズ可能な分析期間:日中から長期的な洞察まで、取引戦略に合わせて分析期間を調整できます。 高度なマルチインスタンス設定:複数の時間枠や戦略の分析に最適な、包括的なビューのために複数のインスタンスを実行します。 グラフィックの無制限カスタマイズ:各チャートの色やスタイルを取引環境に合わせ
    カスタム・アラートで市場の動きを先取り:究極のマルチマーケットスキャナー カスタム・アラートは、複数の市場において可能性の高いセットアップを簡単に特定できる、強力なオールインワン・マーケット・モニタリング・ツールです。 主要8通貨(USD、CAD、GBP、EUR、CHF、JPY、AUD、NZD)、金(XAU)、最大7つの主要指数(US30、UK100、WTI、Bitcoinを含む)をカバーするCustom Alertsは、幅広い資産の重要なシフトを常にアップデートします。 このツールは、高度な FXパワー、FXボリューム、IXパワー・インジケータの データをシームレスに統合し、重要なマーケット・イベントに関するリアルタイム・アラートをお届けします。 カスタムアラートにより、常にチャートを注視することなく、潜在的な取引に対応することができます。 カスタム・アラートの主な利点 複数の市場をカバー:通貨、株価指数、コモディティ、暗号通貨を一元的に把握。 リアルタイムのイベント・アラート:重要な市場変化に関する通知で、重要な動きを見逃しません。 完全なカスタマイズ:お客様独自の取引スタイ
    FXレベルの発見:取引成功のための究極の支持線・抵抗線指標 FX Levelsは単なるサポート&レジスタンス・インディケーターではありません。通貨ペア、株価指数、株式、コモディティなど、あらゆる取引シンボルにおいて、正確性、信頼性、シームレスな機能性を求める真剣なトレーダーにとって、画期的なインジケーターです。実績のあるLighthouseメソッドをベースに、ダイナミックでリアルタイムな適応性を強化したFX Levelsは、市場の反転ポイントをチャート上に表示し、正確な利益目標の設定やトレードエントリーの最適化に最適です。 FX Levelsを選ぶ理由 Stein Investmentsのチームは、ブローカーとその様々なデータフィードに関する長年の経験を活かし、FX Levelsを精度と一貫性において傑出したものにしました。異なるブローカー間でほぼ100%同一のレベルを持つFX Levelsは、他のインジケーターにはない比類ないレベルの信頼性を提供します。FX Levelsの細部へのこだわりは、お客様の期待に応えるだけでなく、サポートとレジスタンス分析へのアプローチ方法を変える
    FXレベルの発見:取引成功のための究極の支持線・抵抗線指標 FX Levelsは単なるサポート&レジスタンス・インディケーターではありません。通貨ペア、株価指数、株式、コモディティなど、あらゆる取引シンボルにおいて、正確性、信頼性、シームレスな機能性を求める真剣なトレーダーにとって、画期的なインジケーターです。実績のあるLighthouseメソッドをベースに、ダイナミックでリアルタイムな適応性を強化したFX Levelsは、市場の反転ポイントをチャート上に表示し、正確な利益目標の設定やトレードエントリーの最適化に最適です。 FX Levelsを選ぶ理由 Stein Investmentsのチームは、ブローカーとその様々なデータフィードに関する長年の経験を活かし、FX Levelsを精度と一貫性において傑出したものにしました。異なるブローカー間でほぼ100%同一のレベルを持つFX Levelsは、他のインジケーターにはない比類ないレベルの信頼性を提供します。FX Levelsの細部へのこだわりは、お客様の期待に応えるだけでなく、サポートとレジスタンス分析へのアプローチ方法を変える
    IX Powerのご紹介 - あなたの取引精度をさらに高める究極のツールです! IX Powerは、FX Powerと同じ精度で設計されており、指数や株式からコモディティ、ETF、暗号通貨まで、あらゆる取引シンボルをマスターすることができます。短期、中期、長期のトレンドに対する正確な洞察で、あなたのトレードを向上させましょう。 IXパワーを選ぶ理由 IX Powerを使えば、タイミングが鋭くなり、よりスマートで迅速な取引判断が可能になります。スキャルピングでもスイングトレードでも、IX Powerはあなたの一挙手一投足に即座に実用的なデータを提供します。IX Powerの革新的なパワーを体験している多くのトレーダーの仲間入りをしてください! IX Powerの主な特徴 100%正確な非リペイント結果:ターミナルで利用可能なすべての取引シンボルについて、一貫性のある信頼できるデータを入手できます。 カスタマイズ可能な強さ分析:あらかじめ設定された期間から選択することも、独自の期間を作成することもできます。 柔軟な通知:Eメール、メッセージ、モバイルアラートなど、カスタマイズ可能
    IX Powerのご紹介 - あなたの取引精度をさらに高める究極のツールです! IX Powerは、FX Powerと同じ精度で設計されており、指数や株式からコモディティ、ETF、暗号通貨まで、あらゆる取引シンボルをマスターすることができます。短期、中期、長期のトレンドに対する正確な洞察で、あなたのトレードを向上させましょう。 IXパワーを選ぶ理由 IX Powerを使えば、タイミングが鋭くなり、よりスマートで迅速な取引判断が可能になります。スキャルピングでもスイングトレードでも、IX Powerはあなたの一挙手一投足に即座に実用的なデータを提供します。IX Powerの革新的なパワーを体験している多くのトレーダーの仲間入りをしてください! IX Powerの主な特徴 100%正確な非リペイント結果:ターミナルで利用可能なすべての取引シンボルについて、一貫性のある信頼できるデータを入手できます。 カスタマイズ可能な強さ分析:あらかじめ設定された期間から選択することも、独自の期間を作成することもできます。 柔軟な通知:Eメール、メッセージ、モバイルアラートなど、カスタマイズ可能
    FX Trend
    Daniel Stein
    4.8 (94)
    常に利益を出し続ける5つ星FXトレーダーになりたいですか? 購入時のスクリーンショットを送信して、専用トレーディングチャットへの個人的な招待を受ける FXトレンド は、すべての時間枠のトレンド方向、期間、強度、その結果のトレンド評価をリアルタイムで表示します。 トレンドがどの方向に動いているか、どのくらい続いているか、どのくらい強力かが一目瞭然です。 これらにより初心者、上級者およびプロのトレーダーにとって使いやすいトレンド取引システムとなって います 。 分析機能 全時間軸のリアルタイムトレンド分析 すべてのタイムフレームで同一の計算結果 時間枠を個別に設定することが可能 トレンドの計算パラメータをカスタマイズ可能 グラフィック機能 コンパクトモード、詳細モード、ダッシュボードモードをワンクリックで切り替え可能 コンパクトモードでは、基本的なトレンド情報を縮小パネルで表示します。 詳細モードでは、基礎となるシンボルの詳細なトレンド分析が可能です。 ダッシュボードモードは、すべてのメジャー銘柄やお気に入りの取引銘柄をカバーします。 パネル内でワンクリックするだけで、すべて
    Taurus MT5
    Daniel Stein
    5 (1)
    Taurusは、当社独自の実際の取引量データを活用し、すでに効果的であったMean Reversion戦略を改良するための献身的な努力の頂点を象徴しています。各シンボルを独自のベストな設定で取引し、卓越したリスク・リワード・レシオとバランスの取れたストレスのない取引体験をユーザーに提供します。 主要データ 独自のリアル出来高データに基づく平均回帰戦略 グリッド、マーチンゲール、平均化を使用しない本格的なリスク管理 28の主要なFXシンボルすべてを、それぞれの最適な設定で処理 シンボルごとに最大1トレード、常にストップロスを固定 すべてのトレーダーに適した、取引ごとに100%調整可能なリスク 100%FIFO対応 100%プロップファーム対応 リンク タウラスFAQ - クリック Taurus Chat - クリック 取引シグナル - クリック テクニカル要件 1.お願い 以下のURL をターミナルのプロパティで許可されたURLのリストに 追加して ください。 - 出来高データ用 -> https://stein.investments - ニュースモジュール -> h
    FX Trend MT5
    Daniel Stein
    4.63 (32)
    常に利益を出し続ける5つ星FXトレーダーになりたいですか? 購入時のスクリーンショットを送信して、専用トレーディングチャットへの個人的な招待を受ける FXトレンド は、すべての時間枠のトレンド方向、期間、強度、その結果のトレンド評価をリアルタイムで表示します。 トレンドがどの方向に動いているか、どのくらい続いているか、どのくらい強力かが一目瞭然です。 これらにより初心者、上級者およびプロのトレーダーにとって使いやすいトレンド取引システムとなって います 。 分析機能 全時間軸のリアルタイムトレンド分析 すべてのタイムフレームで同一の計算結果 時間枠を個別に設定することが可能 トレンドの計算パラメータをカスタマイズ可能 グラフィック機能 コンパクトモード、詳細モード、ダッシュボードモードをワンクリックで切り替え可能 コンパクトモードでは、基本的なトレンド情報を縮小パネルで表示します。 詳細モードでは、基礎となるシンボルの詳細なトレンド分析が可能です。 ダッシュボードモードは、すべてのメジャー銘柄やお気に入りの取引銘柄をカバーします。 パネル内でワンクリックするだけで、すべて
    常に利益を上げる5つ星FXトレーダーになりたいですか? 1. シンプルな取引   システムと   2020年のメジャーストラテジーアップデートの   基本説明を読む 2.   購入時のスクリーンショットを送信して、専用取引チャットへの個人的な招待を受ける このトレードマネージャーは 、 全自動取引管理を使用したいすべての FXトレンド ユーザーにとって理想的な追加機能です。 手動で開いた取引を直ちに検出し、FXトレンドのトレンドラインに沿って自動的にストップを管理 します。 お客様のトレードは、トレードマネージャーのプロパティで設定された固定計算設定に基づいて管理されています。 適切なEAマジックナンバーを設定することで、これらのEA注文をあなたの個人的なトレンド取引スタイルに従って管理することができます。 有効な注文の自動検出 イニシャルストップの自動設定 トレーリングストップの自動化 Expert Advisorsの注文の自動検出 アクティブなExpert Advisor注文の自動管理 カウンタートレンドのトレードのためのセキュリティ・ストップロス ブレークイーブ
    常に利益を上げる5つ星FXトレーダーになりたいですか? 1. シンプルな取引 システムと 2020年のメジャーストラテジーアップデートの 基本説明を読む 2. 購入時のスクリーンショットを送信して、専用取引チャットへの個人的な招待を受ける このトレードマネージャーは 、 全自動取引管理を使用したいすべての FXトレンド ユーザーにとって理想的な追加機能です。 手動で開いた取引を直ちに検出し、FXトレンドのトレンドラインに沿って自動的にストップを管理 します。 お客様のトレードは、トレードマネージャーのプロパティで設定された固定計算設定に基づいて管理されています。 適切なEAマジックナンバーを設定することで、これらのEA注文をあなたの個人的なトレンド取引スタイルに従って管理することができます。 有効な注文の自動検出 イニシャルストップの自動設定 トレーリングストップの自動化 Expert Advisorsの注文の自動検出 アクティブなExpert Advisor注文の自動管理 カウンタートレンドのトレードのためのセキュリティ・ストップロス ブレークイーブン・ストップロ
    Taurusは、当社独自の実際の取引量データを活用し、すでに効果的であったMean Reversion戦略を改良するための献身的な努力の頂点を象徴しています。各シンボルを独自のベストな設定で取引し、卓越したリスク・リワード・レシオとバランスの取れたストレスのない取引体験をユーザーに提供します。 主要データ 独自のリアル出来高データに基づく平均回帰戦略 グリッド、マーチンゲール、平均化を使用しない本格的なリスク管理 28の主要なFXシンボルすべてを、それぞれの最適な設定で処理 シンボルごとに最大1トレード、常にストップロスを固定 すべてのトレーダーに適した、取引ごとに100%調整可能なリスク 100%FIFO対応 100%プロップファーム対応 リンク タウラスFAQ - クリック Taurus Chat - クリック 取引シグナル - クリック テクニカル要件 1.お願い 以下のURL をターミナルのプロパティで許可されたURLのリストに 追加して ください。 - 出来高データ用 -> https://stein.investments - ニュースモジュール -> h
    Visit our all-new   Stein Investments Welcome Page   to get the latest information, updates and trading strategies. Do you want to become a constantly profitable 5-star forex trader? Then  get our Stein Investments trading tools  and send us a screenshot to get your personal invitation to our exclusive trading chat with 500+ members. Crosshair is a fantastic tool that simplifies our chart analysis by bringing the price candles perfectly in line with the indicator values in the subwindows.
    Visit our all-new   Stein Investments Welcome Page   to get the latest information, updates and trading strategies. Do you want to become a constantly profitable 5-star forex trader? Then  get our Stein Investments trading tools  and send us a screenshot to get your personal invitation to our exclusive trading chat with 500+ members. Crosshair is a fantastic tool that simplifies our chart analysis by bringing the price candles perfectly in line with the indicator values in the subwindows. You
    SI Connectは、FX VolumeやSIEAの取引システムを利用するために、当社のサーバーへの接続を確立するユーティリティです。 SI Connectを使用するために端末を準備する技術的な手順 Web リクエストを許可し、[ Terminal Options ] -> [Subcategory Expert Advisors ] で許可された URL のリストに https://stein.investments を挿入してください。 ターミナルごとに1つのEAインスタンスを実行する必要がありますが、当社のデータセンターから最新のデータを取得するため、バックグラウンドで常に実行する必要があります。 ご質問がある場合は、プライベートメッセージを送信してください。
    FREE
    FX取引で成功するための鍵は、規律、忍耐力、そして私たちが独自に開発したリアルな取引量分析のような明確なエッジです。 これは私たちの10年間のFX取引の経験であり、これらの重要な要素はすべてStein Investments Expert Advisor(SIEA)シリーズにまとめられています。 SIEA ZEN は、非常にバランスのとれたリスク・リターン比を提供し、すべての市場の状況を容易に生き抜くことができます-コロナ、ブレグジットなどの最も重大なものでさえも。 このシステムの堅牢性は、素晴らしいパフォーマンスに加えて、ユーザーにとってより重要な「安心感」をもたらします。それが、私たちが「ZEN」と呼ぶ理由です。 MT4では、ストラテジーテスターでマルチシンボルのストラテジーを実行することができません。現実的なリアルティックのマルチシンボルのバックテストを実行するには、 SIEA MT5 バージョンの使用をお勧めします。 FAQ(よくある質問)、バックテストレポート、正しいDST/GMT設定のためのヒントなどの詳細情報は、 SIEA FAQ をご覧ください。
    SIEA PRO NG は、SIEA PROの次世代版であり、当社のこれまでのEAとは全く異なるものです。 表示価格は、SIEA PRO NGの市場ローンチのための 割引価格 です! リアルティックのマルチシンボル・バックテストを実行するには、 SIEA PRO NG MT5 バージョンをご利用ください。 主な特徴 平均回帰戦略を取引 5年間の当社独自のリアル出来高データに基づいています。 各取引には固定ストップロスとテイクプロフィットが付属 平均取引期間は48時間未満 個別微調整のための多くのオプション グリッド、マーチンゲールなし FIFO非対応 ライブシグナル -> https://www.mql5.com/en/signals/2124668 SIEA PRO NG は最良の通貨ペアのみを取引します。 他の通貨ペアは、5年間のテスト期間中に十分な利益を上げることができず、最終的な選択には至りませんでした。 もちろん、トレーダーはさらに取引シンボルを絞り込み、最高の統計データを持つものだけを取引することができます。 デフォルト設定は、 何百時間にも及ぶ研究開
    SIEA Zen
    Daniel Stein
    4 (4)
    FX取引で成功するための鍵は、規律、忍耐力、そして私たちが独自に開発したリアルな取引量分析のような明確なエッジです。 これは私たちの10年間のFX取引の経験であり、これらの重要な要素はすべてStein Investments Expert Advisor(SIEA)シリーズにまとめられています。 SIEA ZENは、非常にバランスのとれたリスク・リターン比を提供し、すべての市場の状況を容易に生き抜くことができます-コロナ、ブレグジットなどの最も重大なものでさえも。 このシステムの堅牢性は、素晴らしいパフォーマンスに加えて、ユーザーにとってより重要な「安心感」をもたらします。それが、私たちが「ZEN」と呼ぶ理由です。 FAQ(よくある質問)、バックテストレポート、正しいサマータイム設定のためのヒントなど、より詳しい情報は SIEA FAQ をご覧ください。 トレーディングスタイル SIEA ZENは、USD、CAD、EUR、CHF、GBP、AUD、NZD、JPYの8つの主要通貨をベースとした28の取引ペアすべてを取引します。 当社独自の出来高分析により、市場の不均衡とそ
    SIEA PRO NGは 、SIEA PROの次世代版であり、当社のこれまでのEAとは全く異なるものです。 表示価格は、SIEA PRO NGの市場導入に伴う 割引価格 です! 主な特徴 平均回帰戦略をトレード 当社独自の5年間の実数量データに基づく 各取引には固定ストップロスとテイクプロフィットが付きます。 平均取引時間は48時間未満 個別微調整のための豊富なオプション グリッド、マーチンゲールなし FIFO非対応 ライブシグナル -> https://www.mql5.com/en/signals/2124668 SIEA PRO NGは 最良の通貨ペアのみを取引します。 その他の通貨ペアは、5年間のテスト期間中に十分な利益を上げることができなかったため、最終的な選択となりました。 もちろん、トレーダーはさらに取引シンボルを絞り込み、最高の統計データを持つものだけを取引することができます。 デフォルト設定は、 何百時間にも及ぶ研究開発の結果 、最もバランスの取れた設定であると 我々は考えて いる。 提供されているパラメーターは、ほとんど説明不要のも
    フィルタ:
    indaplace2be
    39
    indaplace2be 2024.04.02 16:04 
     

    ユーザーは評価に対して何もコメントを残しませんでした

    sclaudio
    24
    sclaudio 2024.01.18 20:36 
     

    FX VOLUME : EXCELENTE INDICADOR, ESTOU MUITO FELIZ COM ELE ! OBRIGADO DANIEL.

    raulovalle
    90
    raulovalle 2023.12.23 22:34 
     

    Hello ... I bought the FX Volume and I must have a fact to add me to the telegram or it is the same telegram they use in general.

    Daniel Stein
    95118
    開発者からの返信 Daniel Stein 2023.12.23 22:38
    Hello raulovalle, I sent you an invitation via private message. Please check your inbox on mql5. Best regards and happy holidays, Daniel
    Oliver Henry
    613
    Oliver Henry 2023.07.24 22:20 
     

    Very good indicator and totally unique on the retail forex market. The insight a trader can get from this is a real edge for trading. The support is also very good as are the daily updates that are published on the chat group.

    Daniel Stein
    95118
    開発者からの返信 Daniel Stein 2023.07.24 22:28
    Thank you so much for your positive feedback. It's highly appreciated. 🙏
    bandelero
    454
    bandelero 2023.06.16 16:15 
     

    I have now closed the second week of trading with FX Power and FX Volume with net gain of 2.7%. I am really pleased how the indicators gives me a quick overview of the market and help me to choose the relevant currency to trade for the day.

    Daniel Stein
    95118
    開発者からの返信 Daniel Stein 2023.06.17 12:54
    Thank you so much for your wonderful feedback. 🙏
    Khuman Bakhramirad
    9472
    Khuman Bakhramirad 2023.05.18 13:15 
     

    its an amazing indicator, once you combine it with other tools its very good.

    Daniel Stein
    95118
    開発者からの返信 Daniel Stein 2023.05.18 13:23
    Thank you so much for your positive feedback. It's highly appreciated. 🙏
    Oliver Hesse
    1133
    Oliver Hesse 2022.09.22 21:26 
     

    ユーザーは評価に対して何もコメントを残しませんでした

    Daniel Stein
    95118
    開発者からの返信 Daniel Stein 2022.09.23 09:15
    Oh, Oliver, I'm so tired of your childish attitude, but you force me to clarify some things for the public. You bought some tools and NOT us or our company. This means we do NOT have to code anything you think is an improvement. Of course, we take care of bugs if we can reproduce them. Try it yourself by opening a blank new chart and try to reproduce the issue you think of it's a bug. If everything works on this new chart, it's a problem with the setup you created. That's what we explained so often.
    And then there are technical limitations of our current product series, which hundreds of other users can easily live with but not you. We know them and designed a new panel technique already available at FX Volume and will be available with the next generation of our other tools. You ignore that there are hundreds of other users besides you. A fundamental redesign of a productive tool is too risky, and that's why every creator, author and software company provides an entirely new version every now and then. So the "old" users are happy, and the new generation users are pleased with the new features. And everyone can switch or use both as they want. I doubt you'll ever understand that, but we honestly don't care. We had endless chats with you, and it's simply hopeless, so please accept that we, as a company, have our own plans for our customers and products. Our chat rules are fair and transparent, and doing marketing for other publishers is simply unacceptable. Besides that, everyone gets the help he needs, but it's clear that we don't have the time to offer individual coaching; hence we have the central Link Library with useful basic information for all users. If there are questions, users can drop them in the group, and other more experienced users or we answer. We're happy to have constantly profitable traders taking their trades solely based on our tools and sharing their knowledge with the crowd. If this isn't enough for you to get rich, we can't help you. Getting rich is a question of attitude and posting your "review" on all 4 product pages makes it even more evident that this is something personal because you don't get your will. Enjoy the audience. We're done with you.
    Robert Torres Jr
    1765
    Robert Torres Jr 2022.06.15 07:07 
     

    ユーザーは評価に対して何もコメントを残しませんでした

    Lester David Saldana Reyes
    335
    Lester David Saldana Reyes 2021.12.20 16:55 
     

    Muy bueno, hace pocas horas lo instalé y está dando buenos resultados, espero siga así. Estaré actualizando la información y datos. La respuesta del creador de este indicador es rápida.

    Nick167
    49
    Nick167 2021.05.22 00:27 
     

    I purchased Stein Investments tools for MT5, also FX Volume. And they make a good impression. I learn to use them effectively. I already have a few questions that I will gladly ask after adding me to the forum :) I know for sure that one more application would be useful, which would give signals on the basis of all the others, connecting them together. I mean calculating the most precise inputs and outputs based on FX Power, FX Volume and FX Trend. Perhaps it will be an improved version of Trade Manager? That's a question for Daniel :)

    Daniel Stein
    95118
    開発者からの返信 Daniel Stein 2021.05.24 10:43
    Hi Nick, I sent you the invitation to our group chat. In the Link Library of this chat, you'll find a link to the STS dashboard, a tool that summarizes the information of the individual indicators and alerts you based on your individual settings. Best regards, Daniel
    Alex East
    100
    Alex East 2021.02.19 17:58 
     

    I have been using FX Volume for around 4-5 months and I can not rate it highly enough. Along, with the rest of Stein's tools they were a real gamechanger for me after years of struggling to find an edge in the market and personally I feel that FX Volume is the most powerful of the lot. Customer service is superb - any issues at all and Daniel is always willing to help. Regular updates - the indicator just keeps on getting better. NB: Like with any indicator, Steins suite of tools are best used in conjuction with technical analysis. If used in this way they are extremely powerful.

    Luke Perrett
    3376
    Luke Perrett 2021.02.09 23:05 
     

    Amazing tool. Great insight into the market. Continually updating to get a closer edge. No crap telegram group. Great team behind all of Steins products. Find me a better product than this. Good luck. Keep up the amazing work Stein team, we need you!!

    Andre Gomes
    2801
    Andre Gomes 2021.02.06 20:05 
     

    Excellent tool. I cannot thank Daniel and Alain enough for building this amazing tool, which truly gives you and edge to trade forex markets.

    CaesarX
    334
    CaesarX 2021.01.10 09:28 
     

    FxVolume has become the most important tool at my disposal, I simply couldn't go without it

    Boriwan
    661
    Boriwan 2020.10.26 20:10 
     

    ユーザーは評価に対して何もコメントを残しませんでした

    Joshua Jeffries
    123
    Joshua Jeffries 2020.10.22 15:31 
     

    I have had this indicator now for the best part of 6 months. I find the insights extremely useful and has saved my skin a few times. Trades i would've normally taken nullified by this indicator. I find it great for swing trading as I can see the volume changing in real time and start to move in the direction i am anticipating. Used in conjunction with the other tools in the box you will find great results. The community is top notch and also run community projects for EA's and Dashboards, the subscription alone is worth that. There are several strategies to use the tools and suits every trader. We have low TF traders in the group M1-M5 and also people like me H1 - D1, and we all seem to be getting great results! For what you get, the price alone is absolutely a steal, it will add so much value to your trading i can't even describe. Since starting my account is up over 500% so yeah, speaks for itself. If you are interested in the closed thing you'll get to an institutional tool on MQL, well, this is it.

    The most useful info are

    LOTS

    Percentage of long trades

    Once you see these increasing for one pair, it is almost a sure thing the price is going to follow. The subscription is so cheap you can't not try it. I can't thank Daniel and the guys in the group enough!

    Stephan Grobler
    152
    Stephan Grobler 2020.08.29 12:58 
     

    Excellent tool!

    Aravind Kolanupaka
    8975
    Aravind Kolanupaka 2020.06.27 18:59 
     

    So many ways to use the data and confirm trades.

    RDI
    1482
    RDI 2020.04.01 22:04 
     

    Great Indicator . Thanks Daniel!!

    レビューに返信
    バージョン 4.82 2024.10.16
    Fixed alerts that were incorrectly turned off.
    バージョン 4.78 2024.09.28
    FX Volume 4.78 contains the following changes:

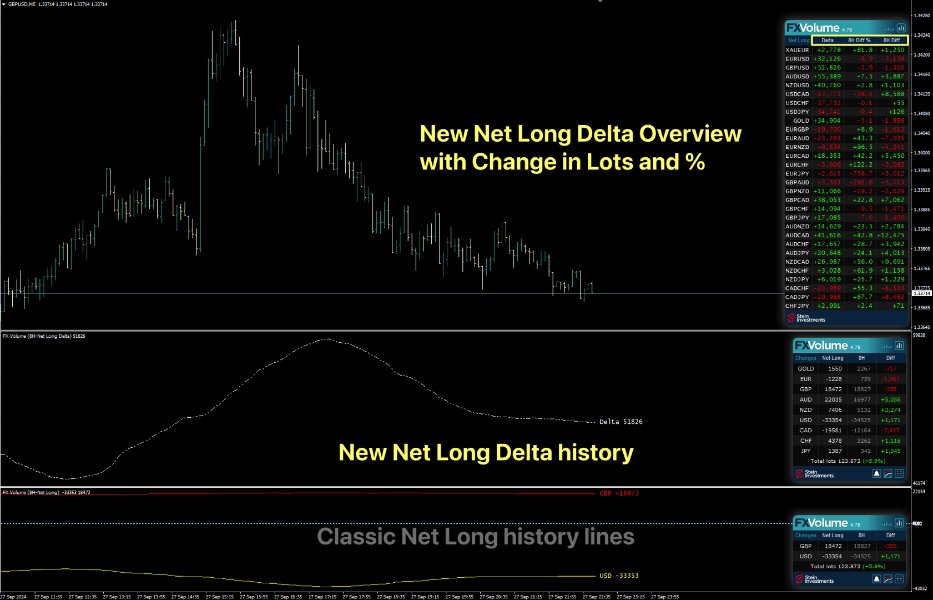
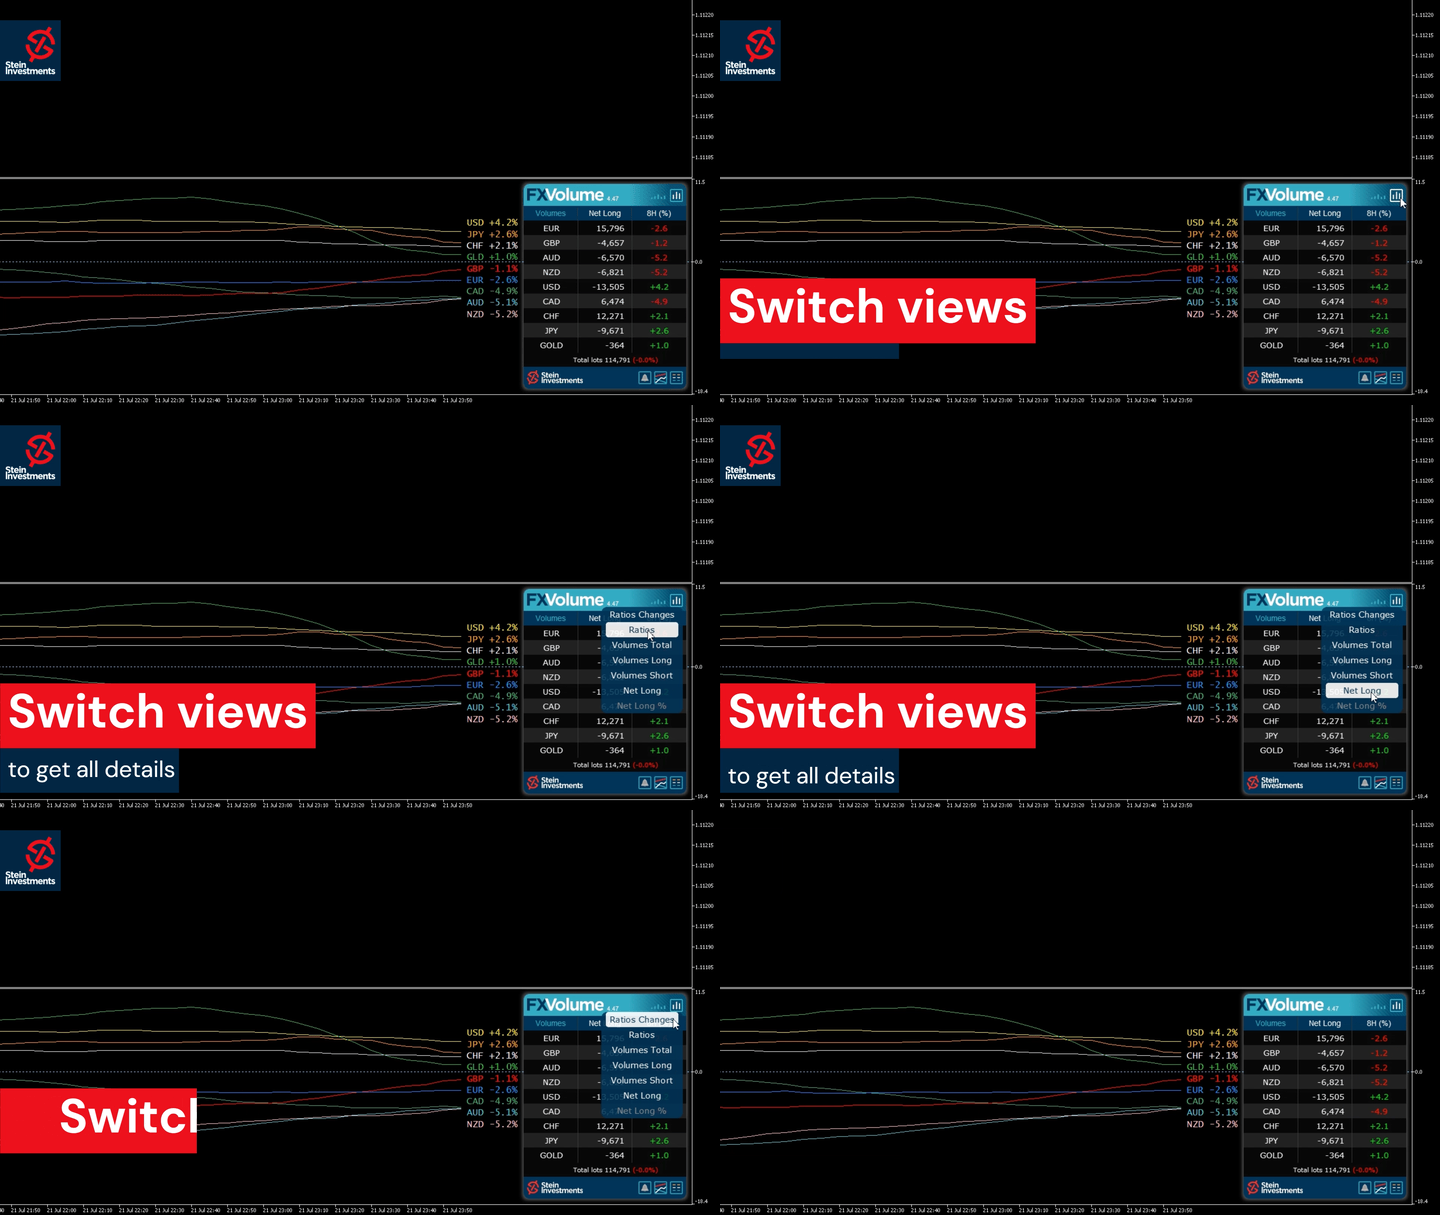
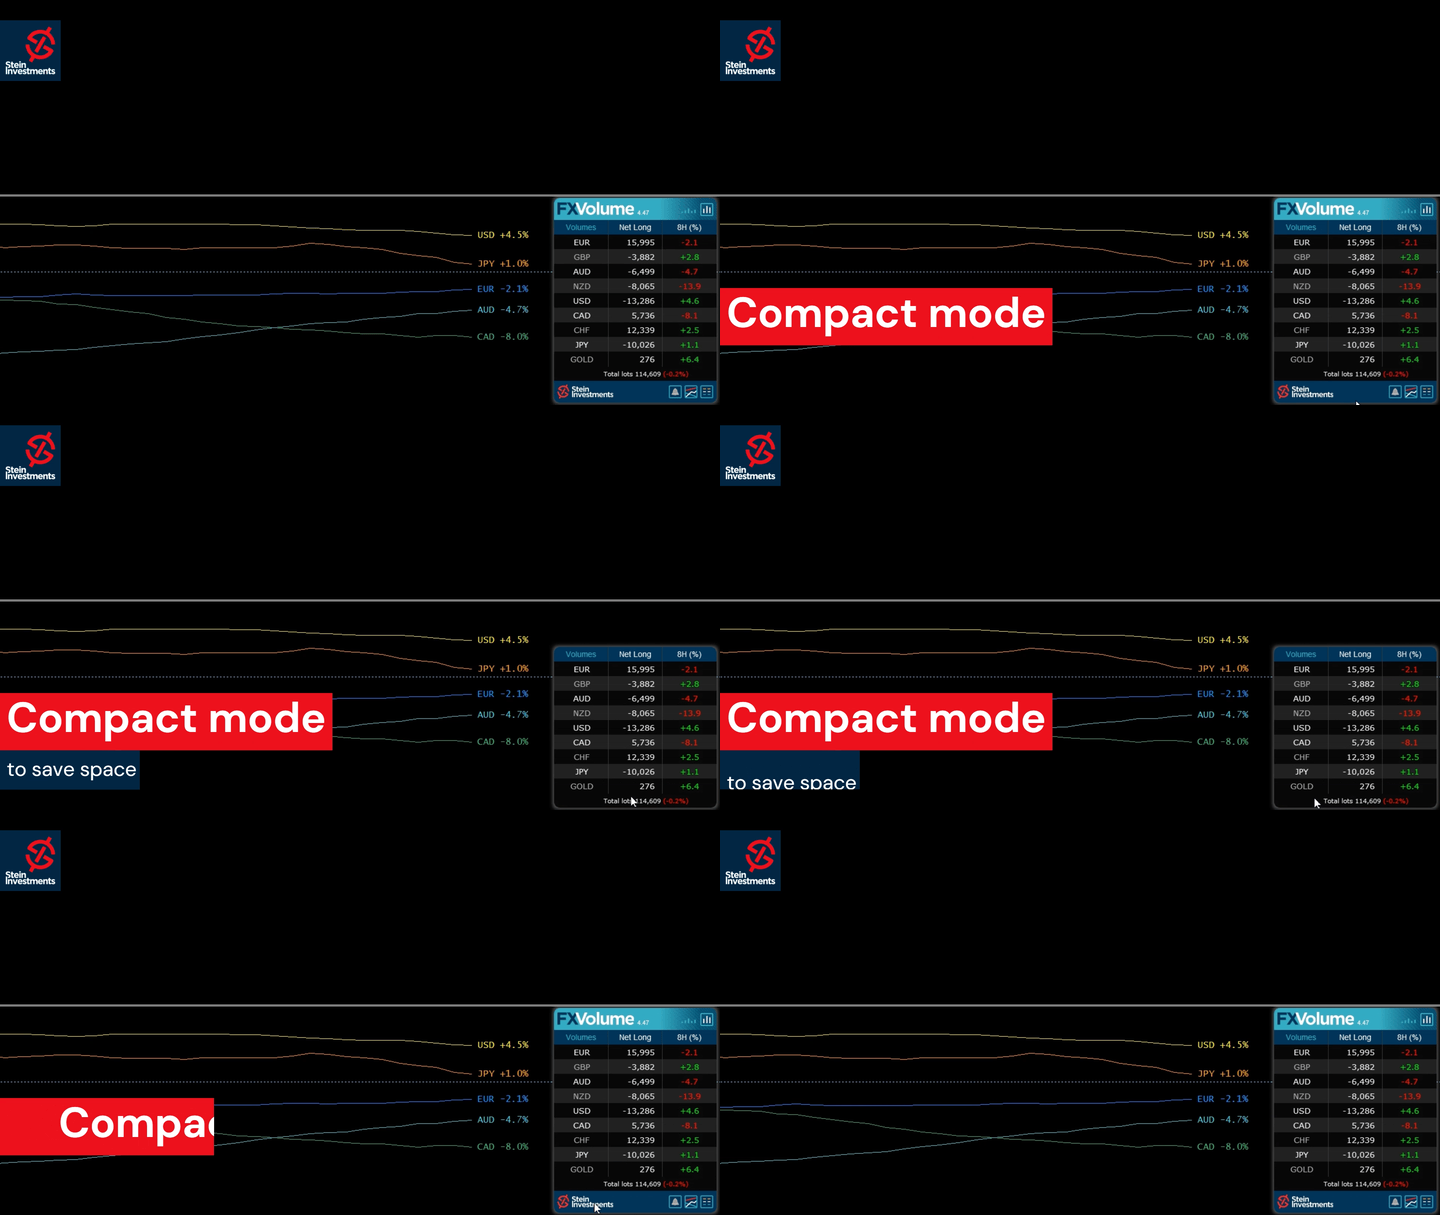
    All views have been reconstructed using the updated SI framework. The Net Long Delta History Mode has been introduced as new History Line Mode.

    The Net Long Delta Overview has been added as an alternative view in the Symbol List panel, and has been established as the default view for the symbol list when any of the three Net Long options is chosen in the properties.

    Gold has been set to display by default.

    Additionally, saved settings will now be cleared when a chart is closed.
    バージョン 4.68 2024.07.12
    New Features:
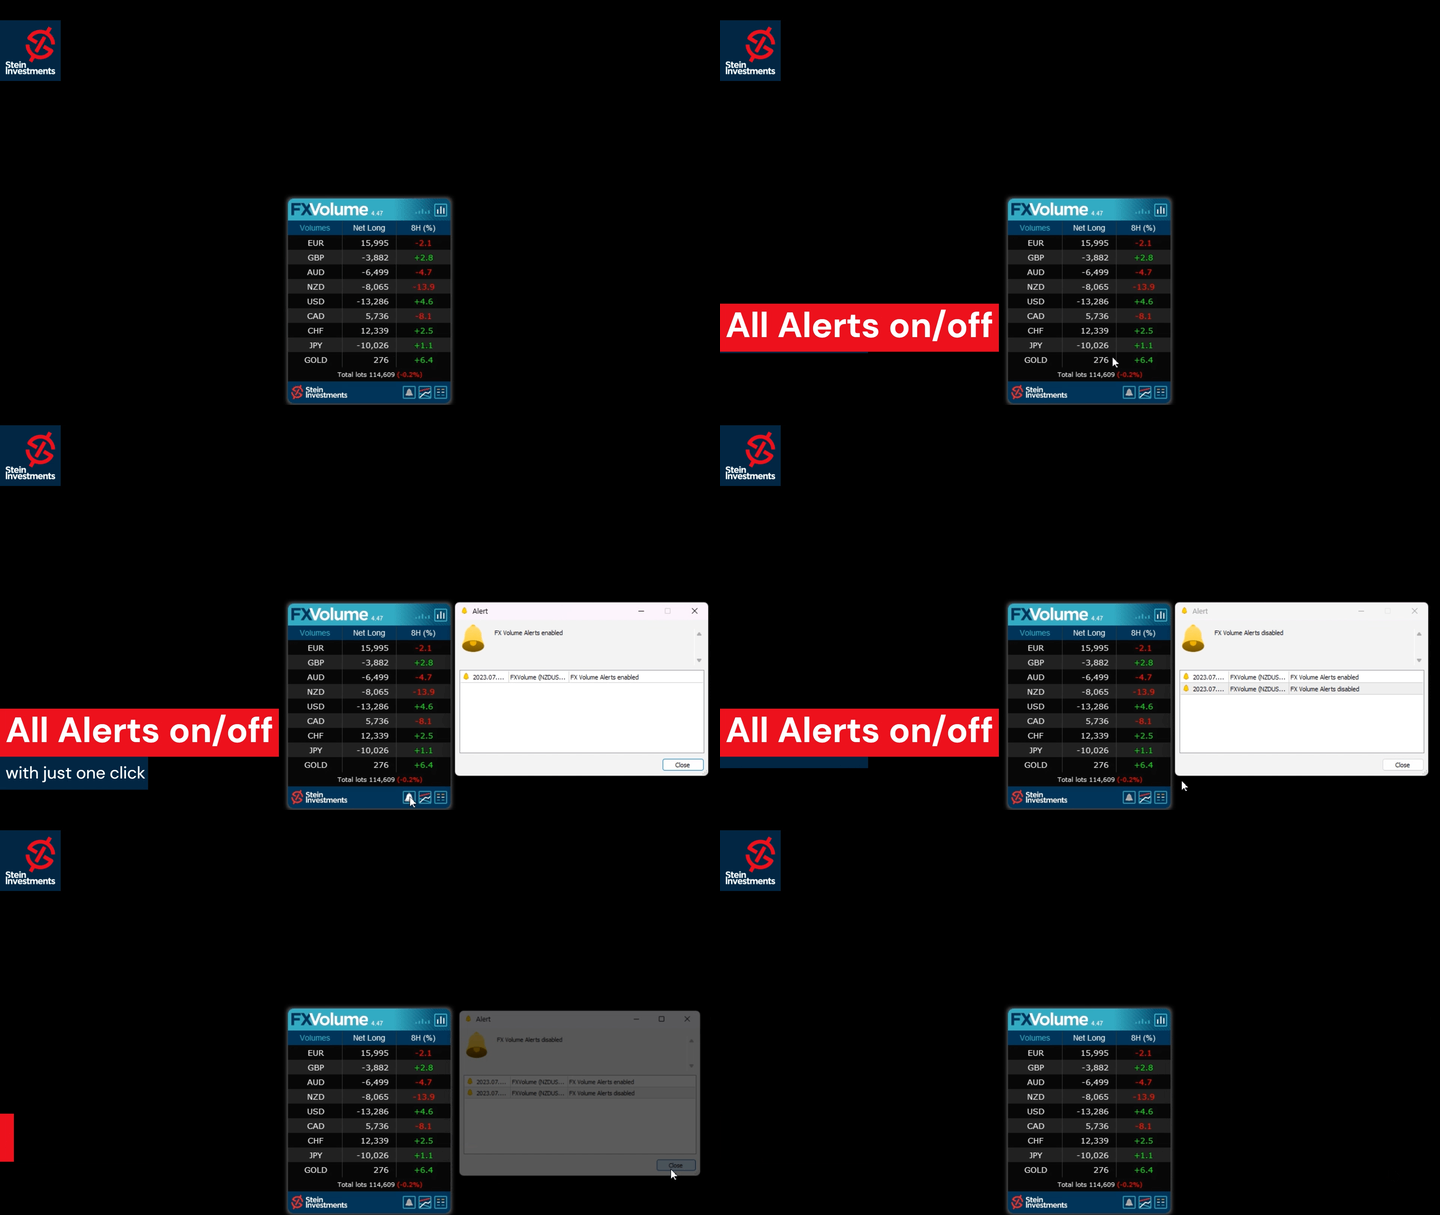
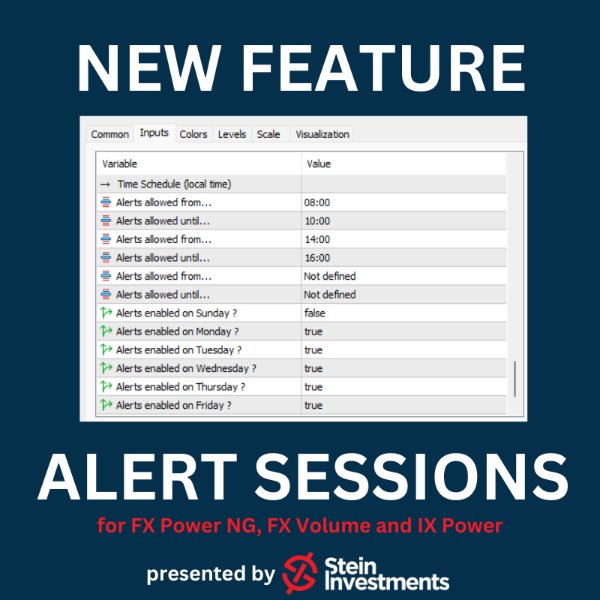
    - Alert Scheduler: Now you can customize the timing for indicator signals to fit your daily routine without being disturbed when you're busy.

    Bug Fixes:
    - Fixed occasional loss of history line colours, width, and style.
    - Removed "Gold" plot visibility when not used by settings.

    Improvements:
    - Enhanced data reliability in extreme cases.
    - Improved processing for "full" updates.
    バージョン 4.55 2023.08.30
    Fixed bug when symbols alert enabled
    バージョン 4.53 2023.08.01
    Added INSTANCE_ID input parameter

    Fixed GOLD bug, shifting all currencies data
    バージョン 4.52 2023.07.31
    Fixed iCustom call, sometimes displaying the panel

    Added Gold input parameters, and updated to use last framework changes
    バージョン 4.50 2023.07.26
    Fixed invalid pointer, framework bug when no history lines are displayed

    Fixed bug in loading FXV parameters
    バージョン 4.48 2023.07.24
    Fixed minor bugs

    Added an alert button in the panel

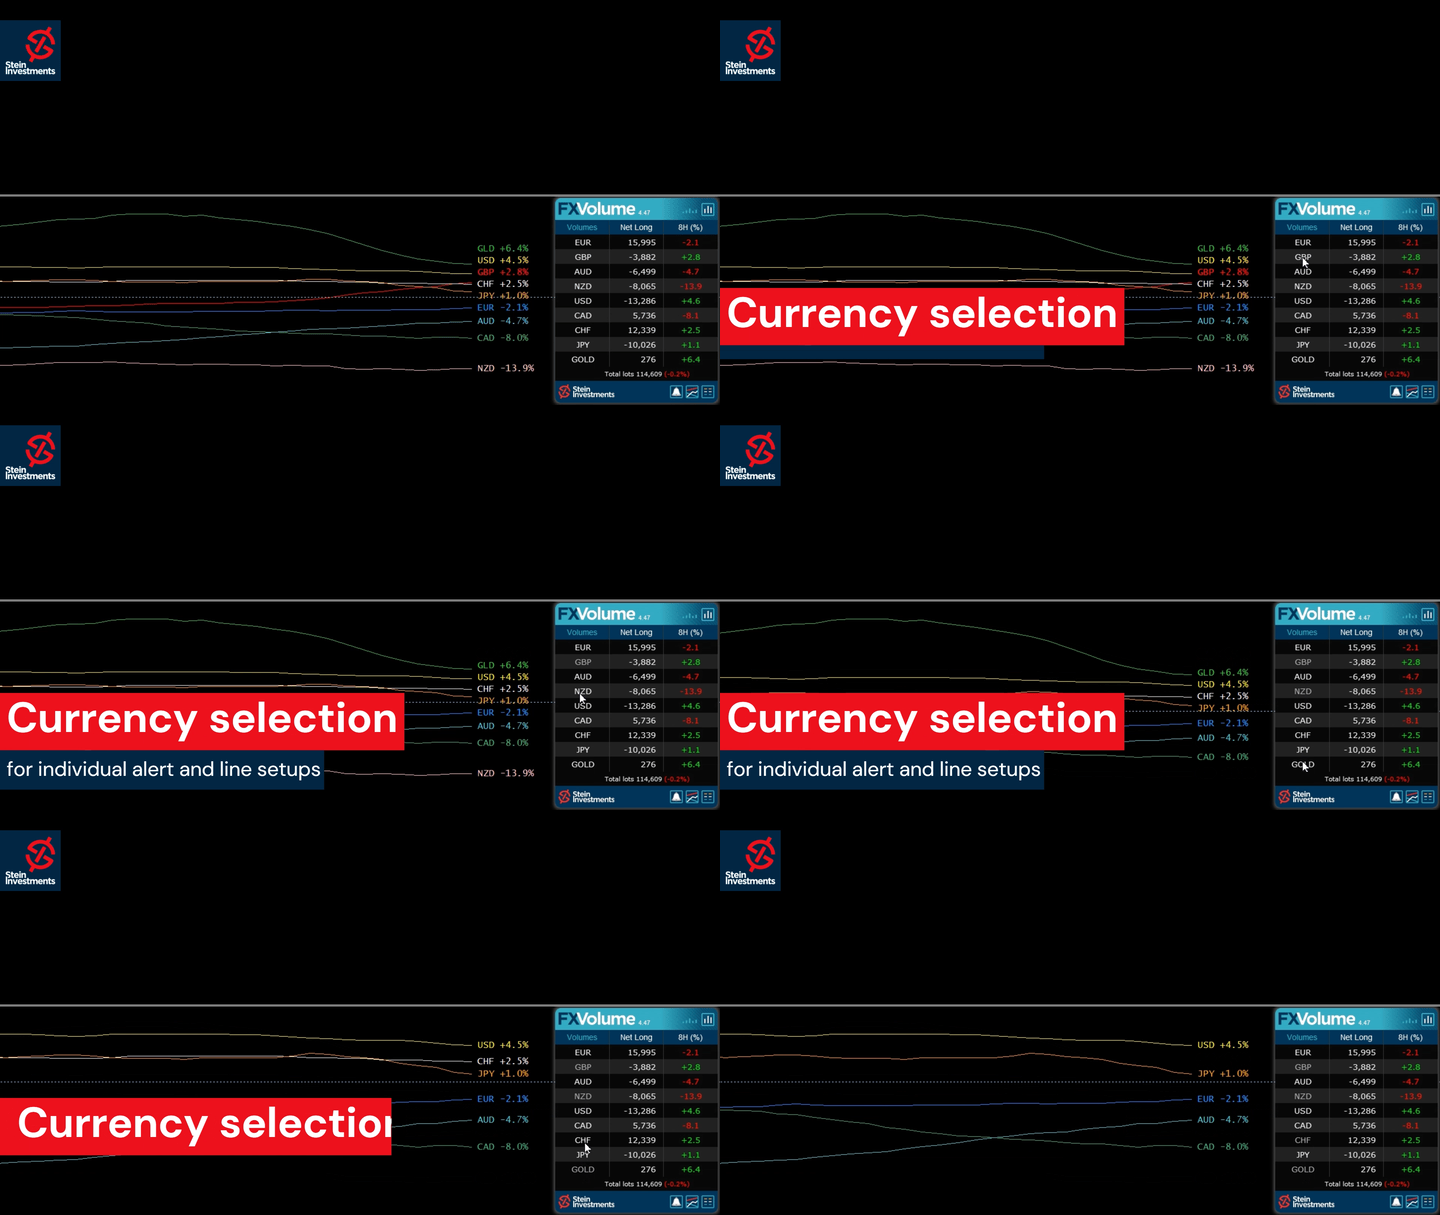
    Alerts are now individually configurable according to currencies selected

    Update with last framework and generic changes

    Changed input parameters (without effect on iCustom requests)

    Changed currency sorting in the panel following a logical convention for symbol names
    バージョン 4.42 2023.06.01
    Fixed GUI DPI adjustment bug
    バージョン 4.41 2023.06.01
    ⚠️Due to necessary changes in our panel management, you have to reconfigure your charts once after the update⚠️

    New Features
    Added history mode "Net Long % change"
    Added new main panel view "Net long % change"
    Added alerts for "Net long % change" drop & rise

    Changed indicator label on chart to display one decimal at % values
    Changed indicator digits according to history mode
    Changed the zoom factor to use % values
    Symbols list refactoring as a new panel


    Graphics
    New rounded corner panel design.
    Added a different color for the "Past" data column.
    Added input for panel back color if the auto-scheme is disabled
    Improved plot labels display to avoid overlapping. (MT5 only)


    Under the hood
    Apply complete internal refactoring
    Apply the last framework update
    バージョン 4.10 2022.03.08
    Fixed resource loading issue on some Mac/Linux systems

    Fixed graphical panel bug when missing past data
    バージョン 4.0 2022.03.02
    FX Volume 4.0 comes with two additional features.

    1. The option to use the internal comparison calculation on a minute basis which allows comparison below our previous minimum of 1 hour.

    2. Inspired by our fellow trader Luke, we created a Net Long Volume view including history lines to understand better how the Net Long volume correlates with the market moves we see on the chart.

    Check our Stein Investments YouTube channel to see a video of the new features.

    We're sure you'll like the new features.
    バージョン 3.58 2021.09.01
    Optimized FX Volume to be fully compatible with MT4/MT5 templates
    バージョン 3.53 2021.05.08
    Transition version to use data in common data folder

    Fixed bug with GMT when running FX Volume on a weekend for the first time

    Optimizations when used as free demo version in the strategy tester


    バージョン 3.50 2021.04.08
    Fixed minor bug when alerts are enabled
    バージョン 3.49 2021.04.01
    This update contains the following changes:

    - New Alert options based on Long and Short Volume
    - New Alert filters based on the dominance of one side available,
    i.e. if Volume Long is bigger than Volume Short, you'll get only alerts for the Volume Long side
    - Improved communication with the new SI Connect 2.x
    - Optimized settings managements

    and these changes are related to the strategy tester usage

    - Fixed current candle update bug
    - Added parameter to start with a focus on chart currencies
    - Improved backtesting performance
    バージョン 3.35 2021.03.11
    Fixed M1 issue when used in the strategy tester
    バージョン 3.34 2021.03.10
    Fixed row labels in Changes view
    バージョン 3.33 2021.03.10
    Internal refactoring
    Changed SI Connect detection method
    Improved performance when used in the strategy tester
    バージョン 3.28 2021.02.26
    FX Volume GUI enabled in Strategy Tester visual mode when called via iCustom
    バージョン 3.27 2021.02.26
    Besides various minor fixes and improvements, we made a few specific improvements when using FX Volume inside an EA and in the strategy tester like:

    - Improve behaviour when called from iCustom
    - Improved data processing (all modes)
    - Fix minor display bugs while using the visual mode
    - Disabled alerts in tester mode
    バージョン 3.25 2021.02.22
    Optimized SI Connect EA detection in case of heavy usage (more than 20 instances)
    バージョン 3.24 2021.02.17
    Fix symbols list display (top of the list possibly hidden)
    バージョン 3.23 2021.02.17
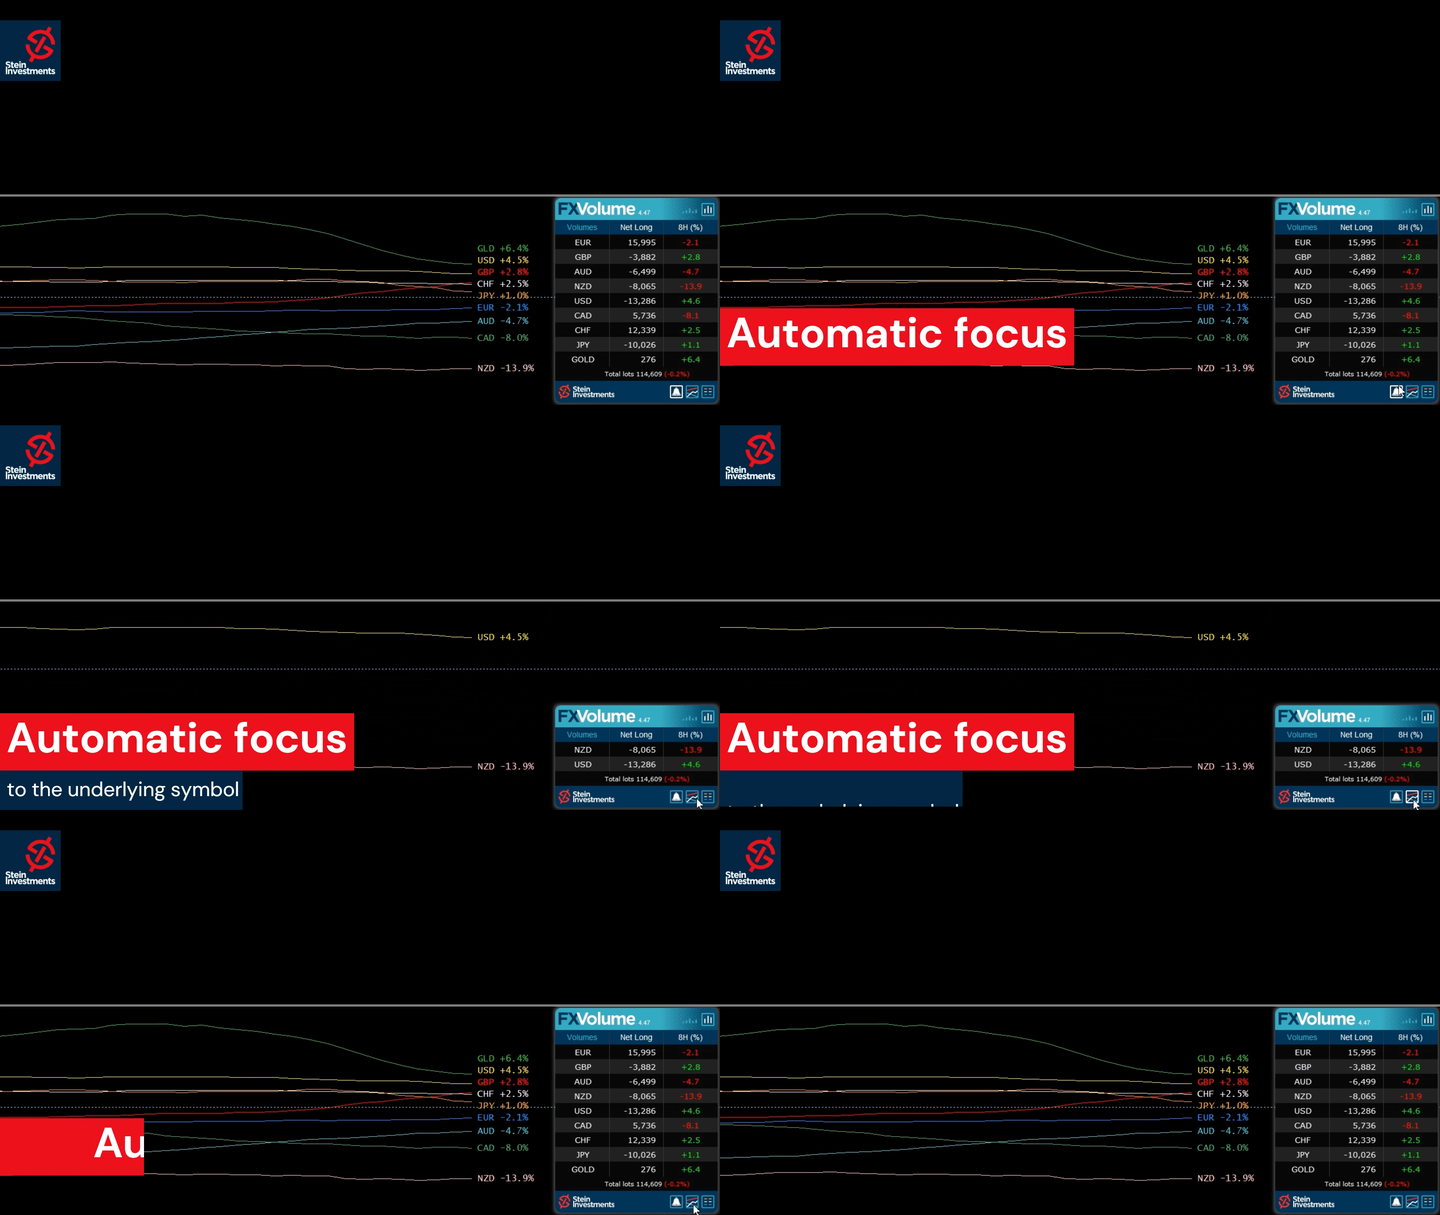
    With this update, it's finally possible to combine different views AND comparison periods in just one chart.

    In this way, you'll easily see if the short term volume is still dynamic and supporting the volume change of a higher period.
    This offers an entirely new grade of precision because you now see exactly when to enter when to exit and if it's still worth to hold the position.

    We hope you'll enjoy the new flexibility provided by FX Volume.
    バージョン 3.18 2021.02.10
    Fixed bug resulting in orphan objects on the chart

    Fixed bug of line style changes when using several instances
    バージョン 3.17 2021.02.04
    This release is another huge step forward and provides the following new features.

    - Additional colouration for the positive and negative percentage values

    - History lines for Volume Total, Volume Long and Volume short are now available

    - All history lines can be hidden completely via parameters in the indicator properties

    - Use multiple instances of FX Volume in one chart to create individual comparison views.
    Note: Every instance has to use a different "History lines and buffers" mode to manage all instances correctly.

    - Volume Total, Volume Long and Volume Short are now available in the indicator buffers

    IMPORTANT: Please note that the history lines and the panel information is managed independently!
    If you switch to a different panel view, this does NOT change the volume history lines. You have to change them in the indicator properties.

    Please note also that the value labels of the history lines differ from the information seen in the panel because the panel displays always the latest available information while the history line buffer provides an OHLC volume data average for the entire candle. Please visit our FX Volume info channel at https://t.me/SI_FX_Volume to get more detailed information
    バージョン 3.1 2021.02.01
    Renamed view labels for a better usability
    バージョン 3.0 2021.02.01
    This major update provides a deeper insight into the real trading market sentiment

    Now you can see the total volume of the long and short side separately as well as how it changed during the selected comparison period. With this information, you can easily spot on which side of the market there is an upcoming dynamic in the real trading volume.

    And because we are often asked for it we added all this information for GOLD as well.

    Enjoy the new amazing features of FX Volume and leave a review if you like it.
    バージョン 2.26 2020.12.21
    Fixed minor bug occurring rarely at a terminal restart
    バージョン 2.25 2020.12.18
    Minor bug fixed causing an empty panel due to unchanged data

    Added special section for the alert option in the indicator properties
    バージョン 2.24 2020.12.16
    The following new features have been added:

    -Alert on long ratio rise/drop
    -Alert on total volume rise/drop
    -Alert on delta increase/decrease

    We hope you'll enjoy the new alert options.
    バージョン 2.22 2020.12.02
    Disabled DEBUG mode
    バージョン 2.21 2020.11.23
    Fixed empty panel bug
    バージョン 2.20 2020.09.18
    Changed Delta calculation display to provide more accurate results

    Added total volume buffer -> ask for the updated code snippets

    FX Volume is now ready to be used in the MT4 strategy tester!
    バージョン 2.16 2020.06.24
    The panel uses current and raw data only. OHLC is used only for history lines.

    Fixed bug in panel update when data are not directly available.

    Added an alert for insufficient Terminal "Max bars" settings.
    バージョン 2.0 2020.06.20
    Dear customers, please welcome our fantastic FX Volume 2.0. We spent weeks of work designing this beautiful panel, adding excellent features, and providing more detailed information to offer you outstanding user experience and a real edge in trading.

    To benefit from all improvements it is necessary that you update FX Volume and SI Connect to the latest available version!
    バージョン 1.26 2020.06.07
    Metaquotes provided important fixes in MQL5 and asked us to recompile all our market tools.
    So please update your local copy to the latest available to benefit from bug fixes and improvements.
    バージョン 1.25 2020.05.14
    Use updated libraries
    バージョン 1.24 2020.03.09
    Added security to avoid alert flooding

    Fixed bug which checks and sends alert continuously if the data file can't be opened