Charts NAVIGATOR
- ユーティリティ
- Sergey Diubakin
- バージョン: 1.1
- アップデート済み: 19 2月 2019
- アクティベーション: 5
The whole market in one click!
Do you value your time? Is ease of use important for you? Are you still looking for the symbol you want or do you have 100 charts open in one terminal? Forget that! Do everything in a single click, on one chart!
Advantages:
- Quick navigation on all the symbols and timeframes you want in a single chart window;
- Instant transfer to the required chart in one click;
- All the necessary symbols and timeframes are clearly and compactly grouped on one chart;
- Two navigation modes - compact and expanded;
- Ease addition and sorting of the symbols via the Market Watch, without the need to manually enter each symbol in the settings;
- Show or hide all the visual elements with a single button click;
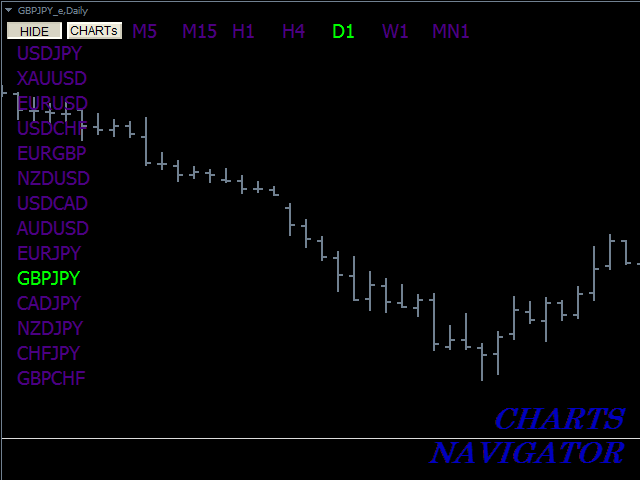
As a rule, to work, the trader needs to monitor a lot of trading instruments on different timeframes. The traded instrument is found in the market watch, dragged onto the chart, the required timeframe is set. This procedure is repeated hundreds of times. How to optimize this process? The answer is simple - Charts NAVIGATOR. In the corner of the screen there are two buttons for all the necessary manipulations.
Professionals appreciate the speed and convenience. Buy the Charts NAVIGATOR and you will no longer need to spend a lot of time searching for the right instrument, selecting the timeframe. If you value your time - this is your tool. Buy it now and focus on the process of trading, do not be distracted by routine operations.
Interested in the Charts NAVIGATOR product? You can buy this tool right now.
Instructions for users.
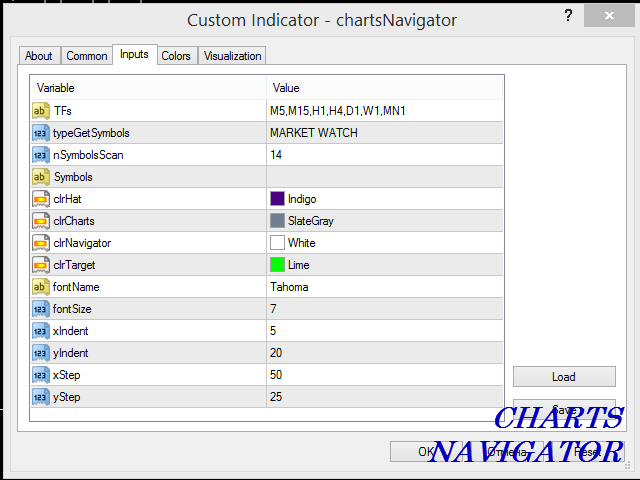
The settings window (figure 4) appears once the navigator is attached to the chart.
List of settings, description and examples of input values:
- TFs="M1,M5,M15,M30,H1,H4,D1,W1,MN1"; //Used timeframes, separated by commas without spaces; you can set the timeframes in any sequence you wish
- typeGetSymbols=MARKET_WATCH; //Symbol receiving method: from "Market Watch" or manual input
- nSymbolsScan=20; //The number of symbols read from the "Market Watch", if 0 - all symbols in the "Market Watch"
- Symbols=""; //Field for the manual input of symbols (is this input method is selected), enter the symbols separated by commas without spaces; see the correct symbols names in the "Market Watch"
- clrHat=clrIndigo,clrCharts=clrSlateGray,clrNavigator=clrWhite,clrTarget=clrLime; //Customization of the navigator colors
- fontName="Tahoma"; //Font
- fontSize=7; //Font size
- xIndent=5,yIndent=20, //Offset from the chart corner by the X and Y axes in pixels
- xStep=50,yStep=25; //The step between the columns (x) and rows (y) in pixels
Configuration of the symbols for the navigator via the "Market Watch".
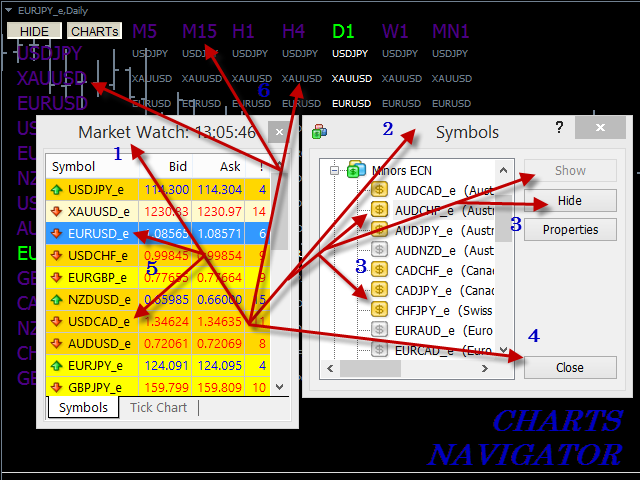
The symbols in the market watch can be configured both before attaching the navigator to the chart and after. Open the "Market Watch" window in the terminal, add all the necessary symbols and align them in the desired sequence. After that attach the navigator to the chart. If the navigator has already been attached to the chart, then to activate the new changes in the navigator, change the current symbol and (or) timeframe of the chart by clicking any of the visual links of the navigator - "symbols", "time-frames" or "charts". You can make changes to the "Market Watch" at any time, there are no limitations.
If you open the "Market Watch" window for the first time and there are no symbols you are interested in, then from the context menu of the "Market Watch", open the symbols window and add all the desired symbols to the "Market Watch" (video and Figure 3).
Navigator buttons.
The navigator has two buttons:
- "SHOW/HIDE" - opes/closes the navigator;
- "CHARTs" - toggles the navigator operation mode. When pressed - "expanded mode", when unpressed - "compact mode".
Navigator operation modes.
In the "compact mode" two types of visual links are available - "symbols" and "timeframes", which allow to change the symbols and the timeframes of the current chart (Figure 2).
In the "expanded mode" a third type of the visual links is available - "charts", which allows to change both the symbol and the timeframe of the current chart in one click (Figure 1).
Thank you for your attention and interest in the program. Enjoy!
