PZ Lopez Pressure
- インディケータ
- PZ TRADING SLU
- バージョン: 1.2
- アップデート済み: 9 8月 2019
- アクティベーション: 20
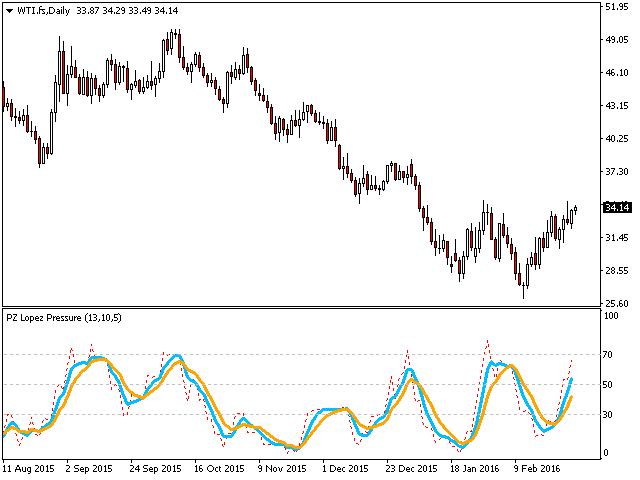
この指標は、市場の強気と弱気の圧力を分析する価格反転を予想しています。購入圧力は、特定の日数にわたるすべての累積バーの合計にボリュームを掛けたものです。販売圧力は、同じ数のバーにわたるすべての分布の合計に、ボリュームを掛けたものです。
[ インストールガイド | 更新ガイド | トラブルシューティング | よくある質問 | すべての製品 ]
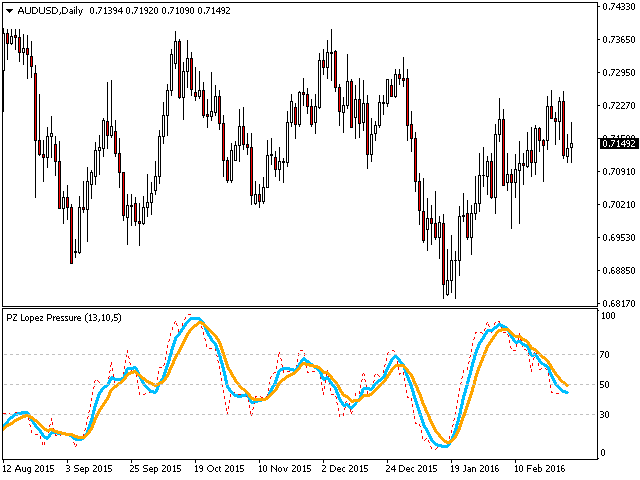
インディケーター比率は、合計アクティビティに対する購買圧力の割合を示します。この値は、0から100まで変動します。2つの移動平均、高速および低速を実装して、圧力トレンドの変化を識別し、それに応じて取引を探します。
- 50の比率は、市場が均衡していることを意味します
- 70を超える比率は、市場が買われ過ぎであることを意味します
- 30未満の比率は、市場が売られ過ぎていることを意味します
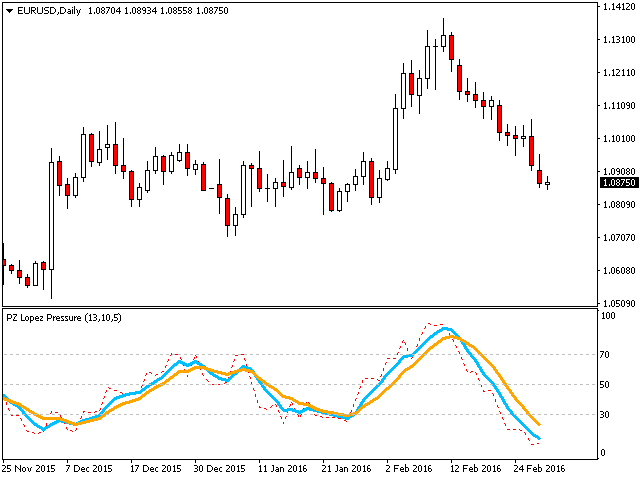
- 赤い点線は現在の比率です
- 青い線は信号線です
- オレンジ色の線がメインラインです
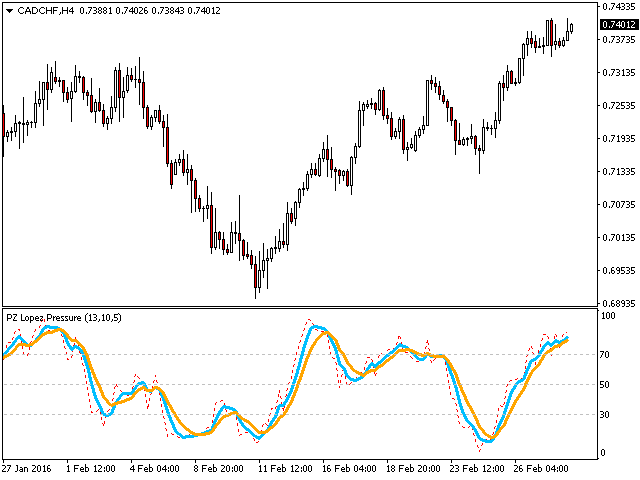
それは簡単な取引の含意を持っています。
- 市場が売られ過ぎているときに購入の機会を探す
- 市場が買われすぎている場合に販売機会を探す
- 信号線が本線の上にある場合、圧力は強気です
- 信号線が本線より下にある場合、圧力は弱気です
入力パラメータ
- 期間:圧力を計算するために調べたバーの数
- 高速MA:ヒストグラムの高速平均化期間
- 遅いMA:ヒストグラムの遅い平均期間
著者
ArturoLópezPérez、個人投資家および投機家、ソフトウェアエンジニア、Point Zero Trading Solutionsの創設者。