RSI All TF
- インディケータ
- Alexey Surkov
- バージョン: 23.31
- アップデート済み: 3 3月 2023
- アクティベーション: 20
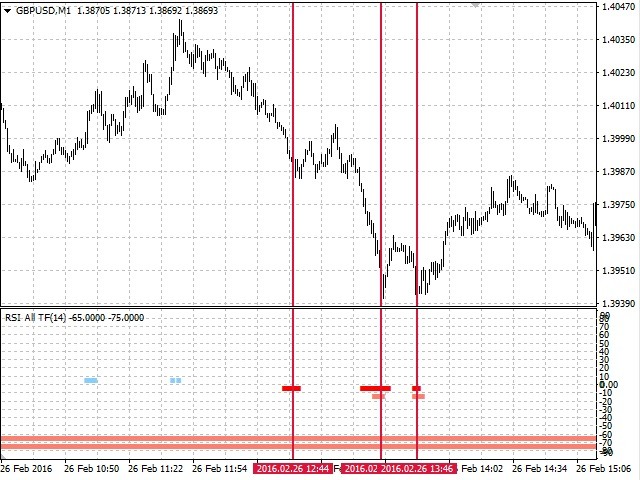
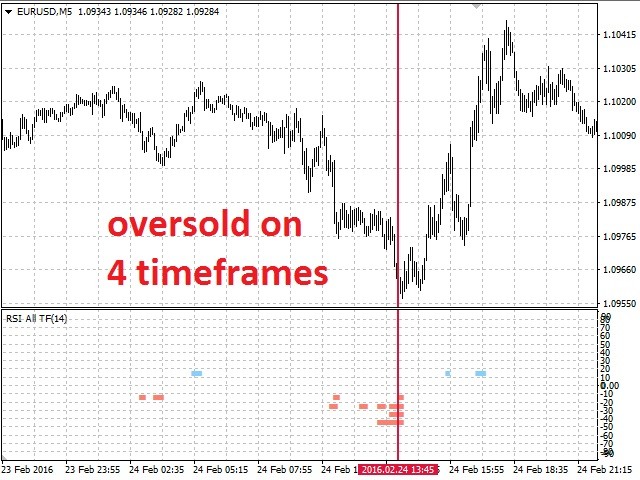
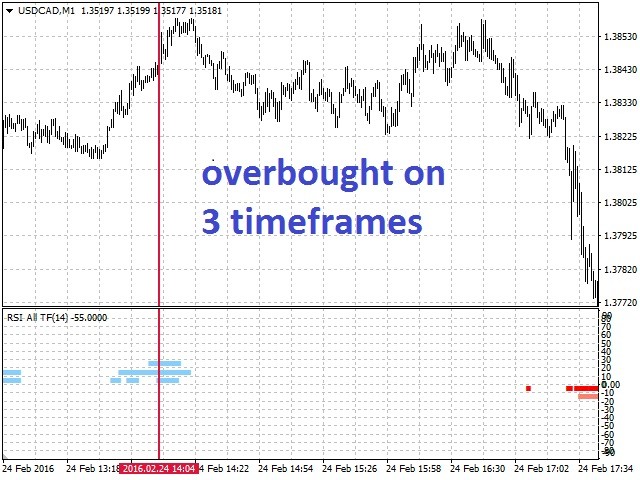
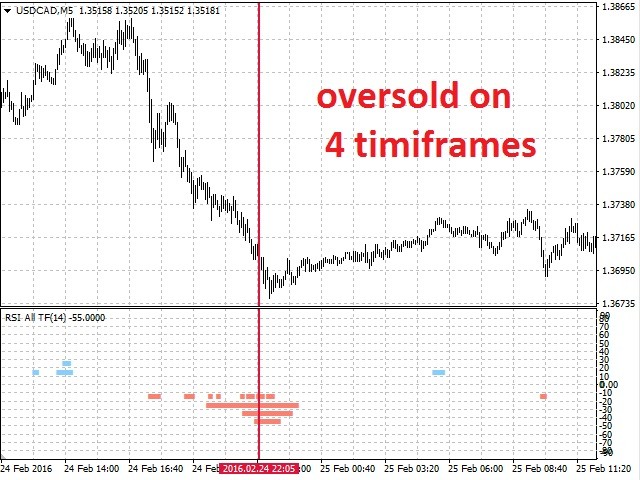
The indicator displays entry signals based on RSI location in overbought/oversold zones on all the timeframes beginning from the current one up to the highest (MN). If RSI is less than Zone but more than (100-Zone), the appropriate indicator value is filled for the timeframe:
- M1 - from 0 to 10 (sell) or from 0 to -10 (buy);
- M5 - from 10 to 20 (sell) or from -10 to -20 (buy);
- M15 - from 20 to 30 (sell) or from -20 to -30 (buy);
- M30 - from 30 to 40 (sell) or from -30 to -40 (buy);
- H1 - from 40 to 50 (sell) or from -40 to -50 (buy);
- H4 - from 50 to 60 (sell) or from -50 to -60 (buy);
- D1 - from 60 to 70 (sell) or from -60 to -70 (buy);
- W1 - from 70 to 80 (sell) or from -70 to -80 (buy);
- MN - from 80 to 90 (sell) or from -80 to -90 (buy).
Parameters
- RSI Period - RSI indicator period (default is 14).
- Zone - overbought/oversold area size (default is 30).











You cannot go wrong with the price. For me, it is difficult to understand how exactly this indicator works. It does work, but I don't see the number of bars on my charts that show on this sales page. Regardless, his indicators are usually very good and very affordable. Not sure why everyone wants to pay all they have for flashy items that don't work. Mr. Surkov does a good job.