• 概要
  • レビュー (39)
  • コメント (198)
  • 最新情報

FX Volume

4.59

FX Volume:ブローカー視点で捉える本物の市場センチメント

クイック概要
トレード手法をさらに高めたいとお考えですか?FX Volume は、リテールトレーダーやブローカーのポジション状況をリアルタイムで提供します。これは、COTのような遅延レポートよりもはるかに早く知ることができます。安定した利益を目指す方も、さらなる優位性を求める方も、FX Volume は大きな不均衡を見極め、ブレイクアウトを確認し、リスク管理を洗練させるのに役立ちます。今すぐ始めて、実際の出来高データがどのように意思決定を変革するかを体感してください!


1. FX Volume がトレーダーにとって非常に有益な理由

高精度の早期警戒シグナル
• 各通貨ペアを売買しているトレーダー数を、他者よりも早く、ほぼリアルタイムで把握できます。
FX Volume は、複数のリテールブローカーから得られる本物の出来高データを収集し、分かりやすい形式で提供する唯一のツールです。

強力なリスク管理
• ロングやショートの大きな偏り(インバランス)を特定し、潜在的なトレンド転換を見逃しません。ストップや目標をより自信をもって設定できます。
• 独自かつ真のデータを活用することで、あらゆるトレード判断がより信頼性を帯びます。

エントリーとエグジットの最適化
• 参加者が一方に偏りすぎている「過度集中トレード」を見分け、実際の出来高を用いてブレイクアウトを確認します。
• 一般的なインジケーターにありがちな誤信号を避け、リアルタイムのフロー情報に基づいて戦略を構築できます。

どんな戦略とも相性抜群
FX Volume は、トレンドラインやサポート/レジスタンス、あるいはインジケーターとスムーズに組み合わせることが可能。真の出来高データは他にはない独特の確証を提供します。


2. Stein Investments で詳しく知る

Stein Investments では以下を提供しています:

• 様々な市場向けの Expert Advisor とインジケーター

• 学習を効率化するためのチュートリアル、ビデオ、ガイド

• 排他的なトレーディングチャットがあるサポートコミュニティ

当社の Stein Investments ページ をご覧になれば、戦略やアップデート、各種リソースを入手可能。FX Volume のポテンシャルを最大限に引き出し、トレードをさらに高みに導きましょう。


3. FX Volume の始め方

必要なURLを追加
• MetaTrader ターミナルで ツール > オプション > Expert Advisors を開き、次を追加してください:
    https://stein.investments
これにより、FX Volume が当社の専門データセンターから本物の市場データを取得できます。

SI Connect をインストール
別のチャート(任意のシンボル/時間足)を開きます。
• そのチャートに SI Connect を追加すると、FX Volume に必要な全データが自動的にダウンロードされます。

メインチャートに FX Volume を追加
• リアルタイムの出来高情報を見たいチャートに FX Volume をドラッグ&ドロップしてください。
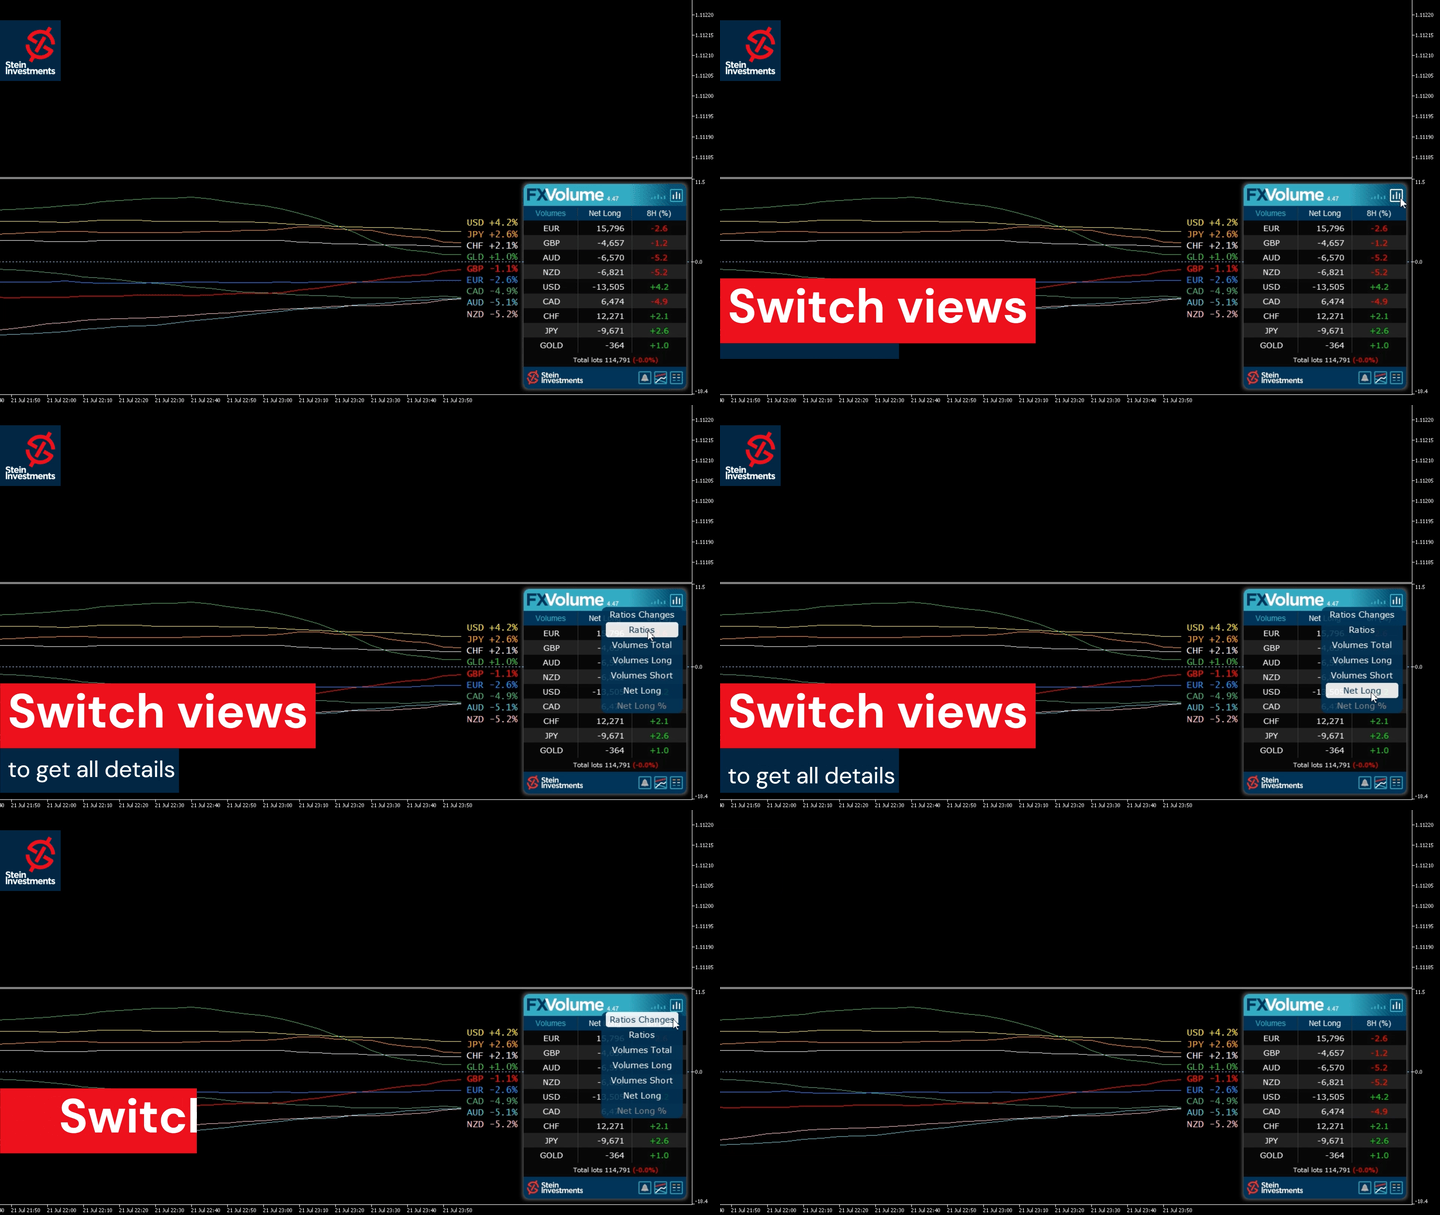
• 複数ブローカーから得た排他的データを基に、ロング/ショート比率や総出来高、ネットポジションなどを確認できます。


4. FX Volume の動作原理(簡易説明)

すべてのトレードには二面性がある
• あなたが買う場合、ブローカーまたは別の機関が売り側を担当し、市場で実際の反対ポジションを形成します。

データ収集
リテールトレーダーとブローカーから得られる本物の出来高データを匿名化して収集し、個人情報は含まず、純粋な量的指標のみ扱います。
FX Volume はこれらの情報を一元化し、信頼性の高いフローとしてまとめます。市場参加者がどこに立っているのかを正確に把握可能です。

集約と分析
• 当社のデータセンターが FX Volume に必要なすべてを継続的に処理します。
SI Connect がこれらの整備済みファイルをダウンロードし、追加の手間なくアップデートを続けます。

逆張り視点(Contrarian)
• リテールトレーダーの80%がロングの場合、大手機関はショートを取ることが多いです。FX Volume はこうした不均衡を的確に示し、クリアな視点をもたらすことで、より的確な判断を可能にします。


5. FX Volume の実践的な活用方法

過密トレードを見極める
• 多数のトレーダーがロングやショートに偏りすぎている場合、市場が反転を迎える可能性があります。
当社独自のデータソースにより、こうした動きを早期に把握し、計画的に対応できます。

ブレイクアウトを確認
• 買い/売りの出来高が増加しつつ起こるブレイクアウトは、価格動向に力強さがある兆候です。
真のグローバルなリテール出来高を参照すれば、ブレイクアウトの信憑性をより高く検証できます。

ストップロス配置を最適化
• 出来高が急上昇するポイントは、大口が価格を動かすゾーンであることが多いです。これを踏まえたストップ設定が予期せぬボラティリティから守ってくれます。

プライスアクションとの併用
• 重要なサポート/レジスタンスやローソク足パターンを FX Volume のリアルタイムデータと組み合わせることで、根拠の強いエントリーを実現します。


6. FX Volume 指標設定

お好みのトレードスタイルに合わせて FX Volume をカスタマイズしましょう:

Broker DST Zone & GMT Shift
• ブローカーの現地時間と整合性を取ることで、出来高データの一貫性を保持できます。

Back Comparison In(Hours か Minutes)
• 現在のデータを何時間、または何分という単位で遡って比較するかを決めます。

Compare with X Units Back
• 出来高の急増や急減を捉えるために、過去何時間/何分前までさかのぼるか指定しましょう。

Display All History Lines
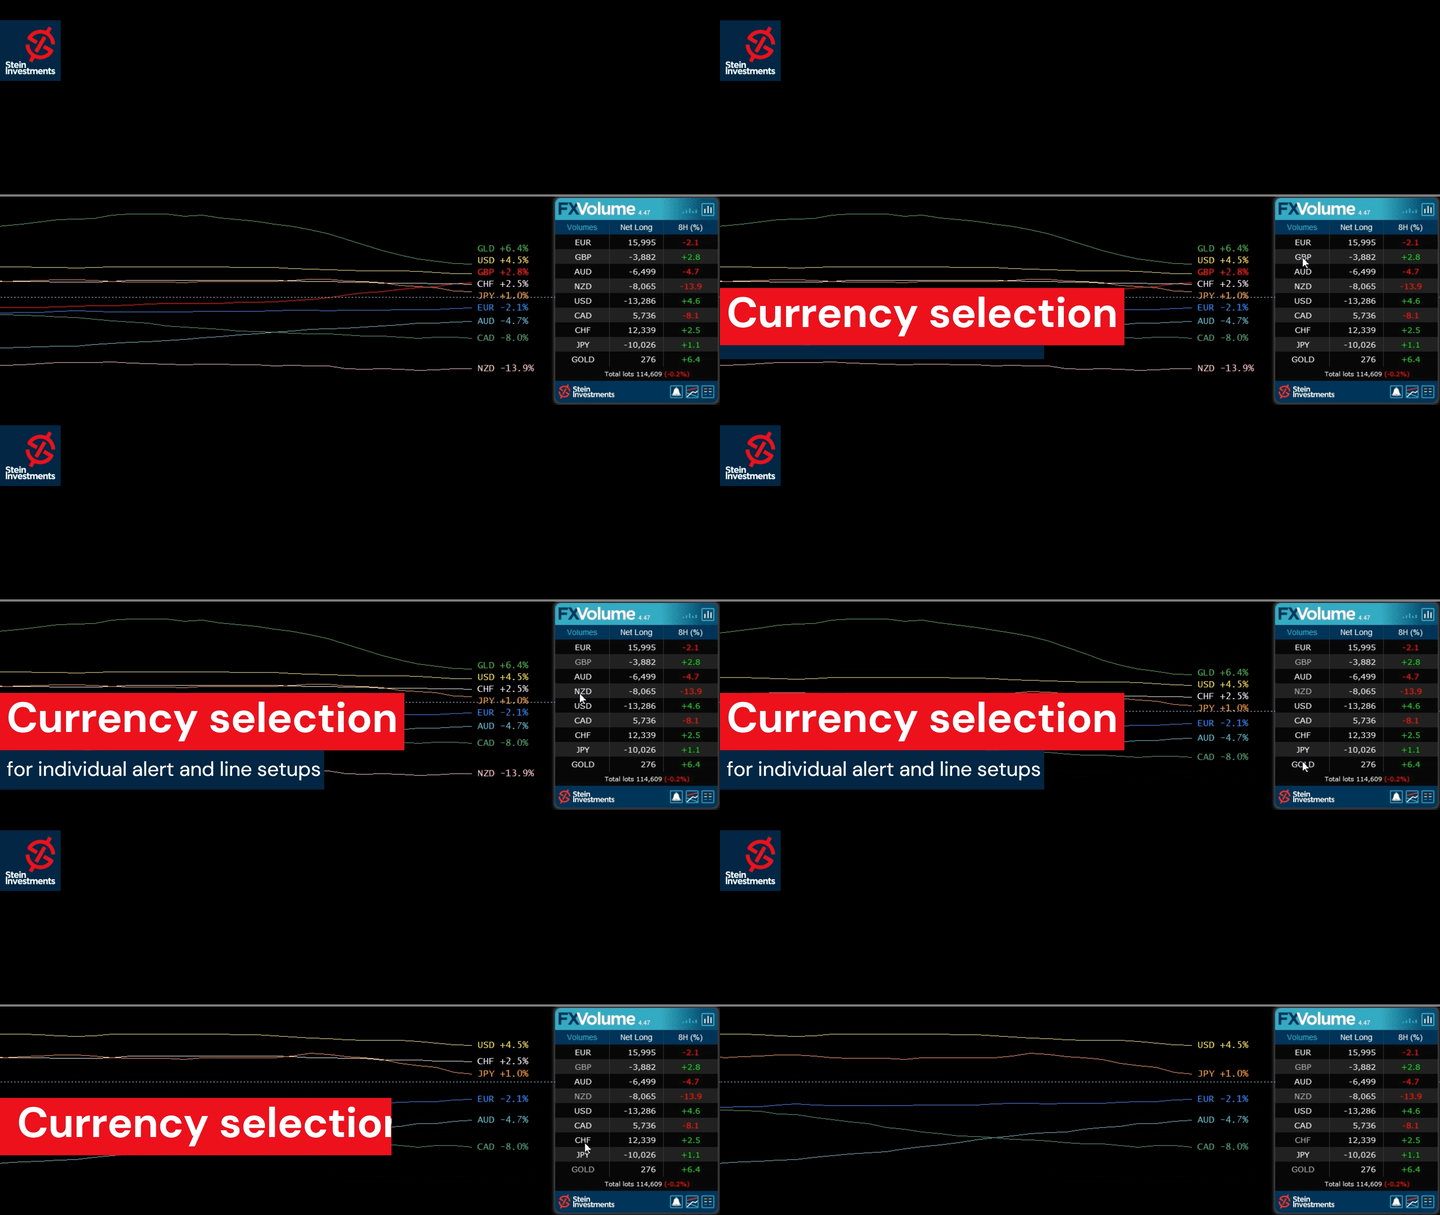
True:関係するすべての通貨ペアの履歴ラインを表示。
False:現在のシンボルに関係するラインだけを表示します。

History Values
• 履歴として表示したい出来高データを選びます:Net LongLong VolumeShort VolumeTotal Volumeなど。

Multi-Instance Settings
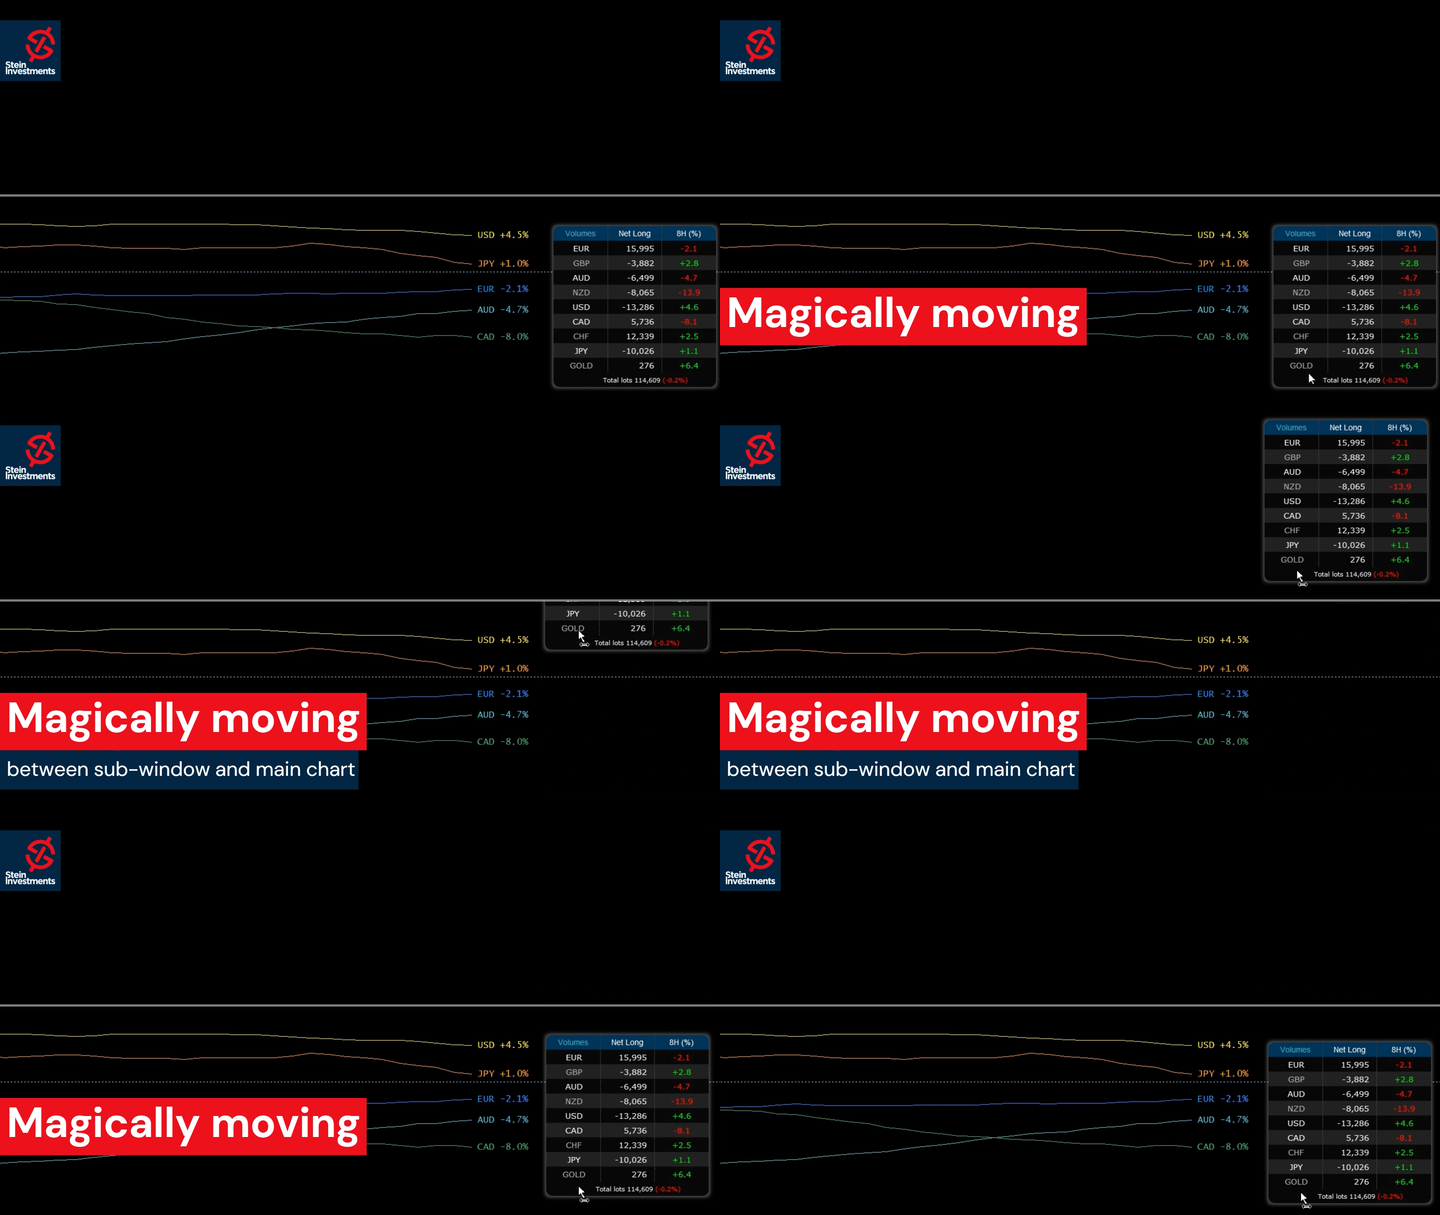
• 同一ウィンドウ内に複数の FX Volume を起動する場合は、重複を避けるために固有のIDを割り当てます。

Alert Settings
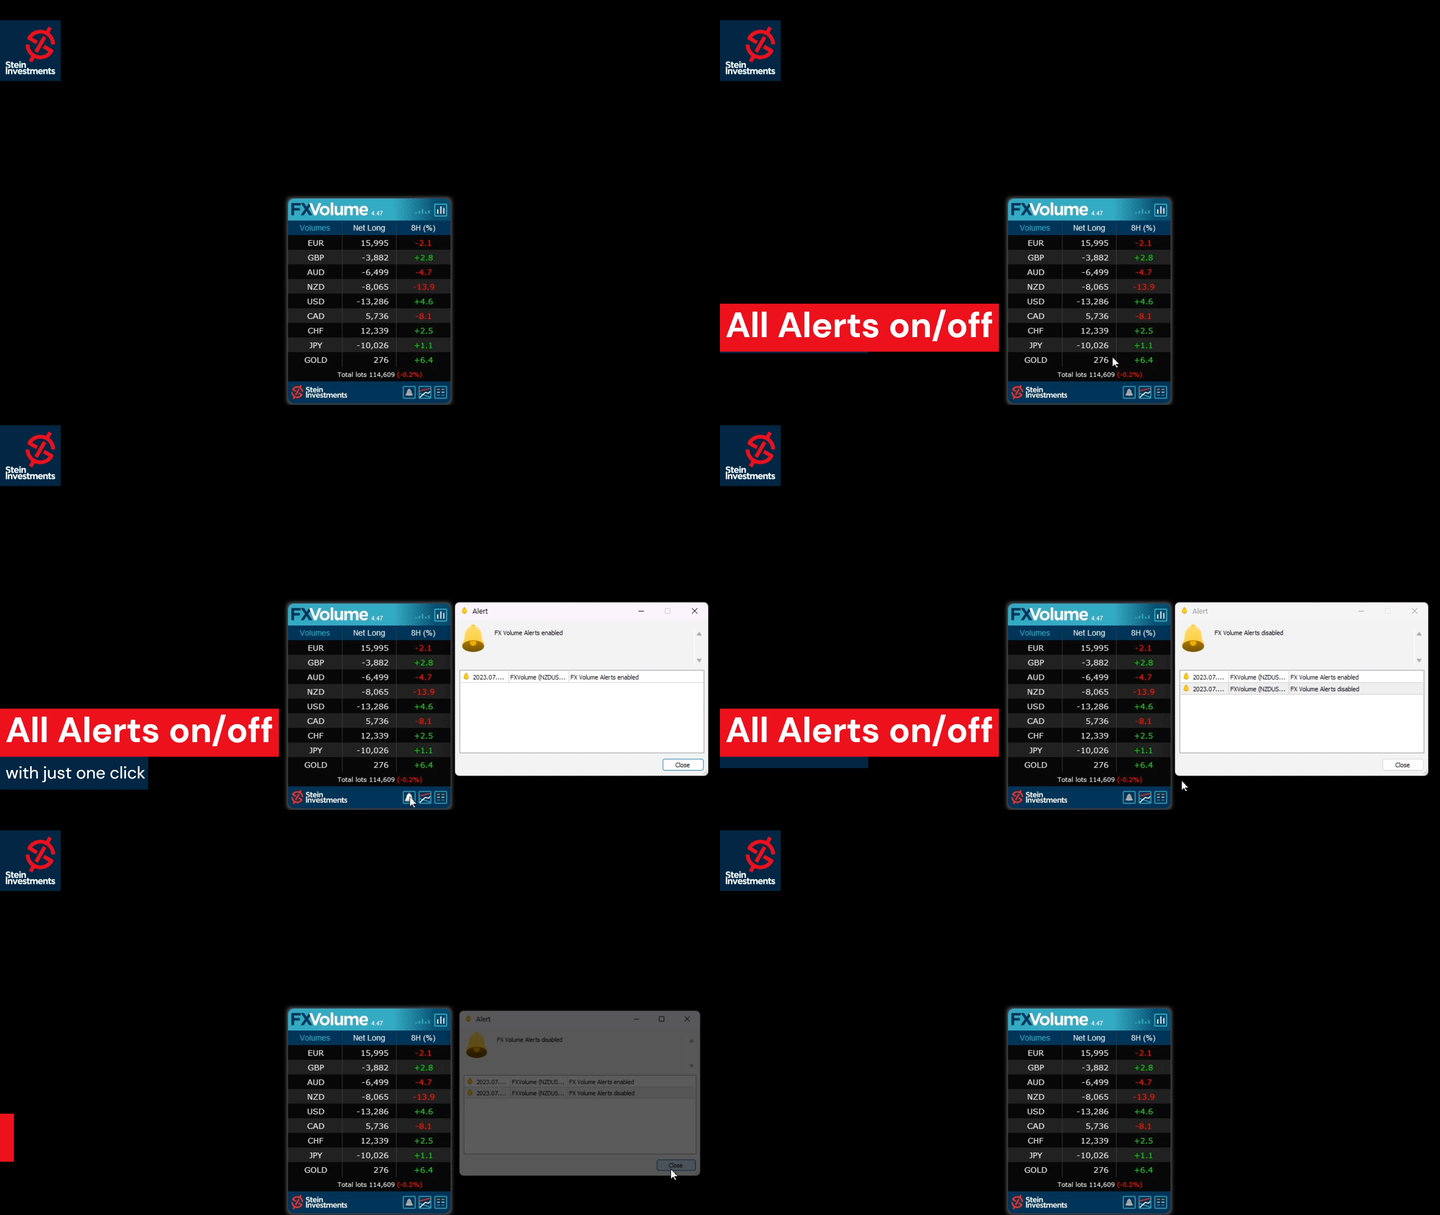
• 出来高の閾値やスパイクに対するアラートを設定し、重要な変化を見逃しません。

Graphical Settings
• カラー、線の太さ、レイアウトなどをお好みに合わせて調整します。

Schedule
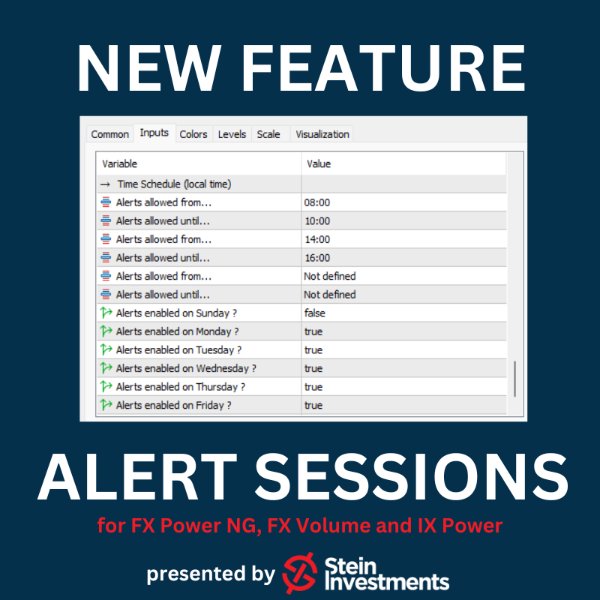
• どの時間帯に FX Volume がアラートを発するか制御可能で、特定の時間帯だけトレードする人に最適です。


7. 追加情報 & ヘルプ

FX Volume FAQ:詳細やトラブルシューティングは FX Volume FAQ ページをご覧ください。

Community Chat:非公開のグループに参加し、戦略を共有したり質問したり、ほかの FX Volume ユーザーと交流できます。

Support:何かお困りのことやご質問があれば お問い合わせ ください。サポートいたします。


今こそトレードを変革しませんか?
排他的なデータを活用:複数のリテールブローカーから得られるリアルな出来高を統合し、市場の実状を明らかに。
より精度の高いトレード:センチメントを確認し、反転を見極め、高品質なリアルタイムデータで戦略を補強しましょう。
Stein Investments のコミュニティに参加:ツールやガイド、充実したサポートを駆使して、自信を持ったトレードを実現してください。


待っていてはもったいない! FX Volume を今すぐ導入して、本物の出来高データがもたらす革新的なパワーを実感しましょう。優位性を手にして、すべてのトレードをレベルアップしてください。


良いトレードを!
Daniel & Alain

レビュー 39
Ukwezi
210
Ukwezi 2025.01.24 07:05 
 

Excellent product, 5 stars no doubt. Really helps me in my strategy and extremely helpful in finding out where “things are happening” in the FX market. Thank you Daniel!

Kabelo
86
Kabelo 2024.07.10 18:12 
 

When applied correctly, FX volume is almost 100% accurate in terms of direction. Adding a solid entry strategy has significantly improved my trading win rate. I'm pleased to have found a reliable trading indicator after testing and using over 1,000 repainting, recalculating, and unreliable indicators. Please, Daniel, keep up the excellent work and product.

Ingo Reimann
280
Ingo Reimann 2023.12.21 16:13 
 

The best and most precise product that I have had the pleasure of getting to know in my trading career. I can recommend it to everybody. Since I started using these products, trading has also been working. The support from the developers and the community are also in a class of their own.

おすすめのプロダクト
Was: $249  Now: $149   Market Profile defines a number of day types that can help the trader to determine market behaviour. A key feature is the Value Area, representing the range of price action where 70% of trading took place. Understanding the Value Area can give traders valuable insight into market direction and establish the higher odds trade. It is an excellent addition to any system you may be using. Blahtech Limited presents their Market Profile indicator for the MetaTrader community. In
We present you the indicator "Candle closing counter", which will become your indispensable assistant in the world of trading. That’s why knowing when the candle will close can help: If you like to trade using candle patterns, you will know when the candle will be closed. This indicator will allow you to check if a known pattern has formed and if there is a possibility of trading. The indicator will help you to prepare for market opening and market closure. You can set a timer to create a pre
Title : Market Bias Indicator - Oscillator-Based Trading Tool Introduction : Discover the potential of the "Market Bias Indicator," a revolutionary oscillator-based trading tool designed for precise market analysis. If you're in search of a robust alternative to traditional bias indicators, your quest ends here. Market Bias Indicator offers unparalleled accuracy in identifying market sentiment and is your gateway to confident trading decisions. Recommended Trading Pairs : Market Bias Indicator i
Owl smart levels
Sergey Ermolov
4.24 (37)
MT5版  |   FAQ Owl Smart Levels Indicator   は、 Bill Williams   の高度なフラクタル、市場の正しい波構造を構築する Valable ZigZag、エントリの正確なレベルをマークする Fibonacci レベルなどの一般的な市場分析ツールを含む 1 つのインジケーター内の完全な取引システムです。 利益を得るために市場と場所に。 戦略の詳細な説明 インジケータを操作するための指示 顧問-取引助手 プライベートユーザーチャット ->購入後に私に書いて、私はプライベートチャットにあなたを追加し、あなたはそこにすべてのボーナスをダウンロードすることができます 力はシンプルさにあります! Owl Smart Levels   取引システムは非常に使いやすいので、専門家にも、市場を勉強し始めて自分で取引戦略を選択し始めたばかりの人にも適しています。 戦略と指標に秘密の数式や計算方法が隠されているわけではなく、すべての戦略指標は公開されています。 Owl Smart Levels を使用すると、取引を開始するためのシグナルをすばやく確認し、注
This indicator is a conventional analytical tool for tick volumes changes. It calculates tick volumes for buys and sells separately, and their delta on every bar, and displays volumes by price clusters (cells) within a specified bar (usually the latest one). The algorithm used internally is the same as in the indicator VolumeDelta , but results are shown as cumulative volume delta bars (candlesticks). Analogous indicator for MetaTrader 5 exists - VolumeDeltaBars . This is a limited substitution
これは、キャンドルの終値を予測する指標です。 このインジケータは、主にD1チャートでの使用を目的としていますが. この指標は、従来の外国為替取引とバイナリオプション取引の両方に適しています。 インジケーターは、スタンドアロンのトレーディングシステムとして使用することも、既存のトレーディングシステムへの追加として機能させることもできます。 このインジケーターは、現在のキャンドルを分析し、キャンドル自体の内部の特定の強度係数と、前のキャンドルのパラメーターを計算します。 したがって、この指標は、市場の動きのさらなる方向性と現在のキャンドルの終値を予測します。 この方法のおかげで、この指標は、短期の日中取引だけでなく、中期および長期の取引にも適しています。 インジケーターを使用すると、市場の状況の分析中にインジケーターが生成する潜在的な信号の数を設定できます。 インジケーターの設定には、このための特別なパラメーターがあります。 また、インジケーターは、チャート上のメッセージの形式で、電子メールで、およびPUSH通知の形式で、新しい信号について通知することができます。 購入後は必ず私に書いて
Crypto_Forex インジケーター PINBAR パターン (MT4 用)。 - インジケーター「PINBAR パターン」は、プライス アクション トレーディングに非常に強力なインジケーターです。再描画なし、遅延なし。 - インジケーターはチャート上の PinBar を検出します。 - 強気 PinBar - チャート上の青い矢印信号 (画像を参照)。 - 弱気 PinBar - チャート上の赤い矢印信号 (画像を参照)。 - PC、モバイル、および電子メール アラート付き。 - インジケーター「PINBAR パターン」は、サポート/レジスタンス レベルと組み合わせるのに最適です。 // 素晴らしいトレーディングロボットとインジケーターはここから入手できます: https://www.mql5.com/en/users/def1380/seller これは、この MQL5 Web サイトでのみ提供されるオリジナル製品です。
フィボナッチリトレースと拡張ラインツール DiNapoliポイント取引方法とゴールデンセクション取引を使用するトレーダーにとって理想的なMT4プラットフォームのフィボナッチリトレースと拡張ラインツール 主な特長: あなたはフィボナッチリトレースメントの複数のセットを直接描くことができ、重要なリターンポイント間の関係は一目瞭然です。 2.フィボナッチ拡張を描画することができます。 3.フィボナッチフォールドバックとラインの延長は、簡単な観察と数値表示のために左右に動かすことができます。 4.チャートは非常に爽やかな 5.数字キーでサイクルを切り替えることができます。 ファンクションキー: 1。 [戻るを押す、要求に応じて描画する、最大8つのグループにする 2。拡張]を描くには[押す] 3。 \を押すと、現在のサイクルの下にあるすべての拡張機能と折り畳みが削除されます 4。フォールドバックを移動して削除して展開する (1)最初のフォールドバックセットのF5行をクリックします。 一度クリックすると(黄色に変わります)、キーボードのDeleteキーを押すと、フォーカ
This indicator monitors the market for a flat state and possible breakout. The flat state is detected as a predefined number of consecutive bars during which price fluctuates inside a small range. If one of the next bars closes outside the range, breakout is signaled. The indicator shows 3 lines: blue - upper bound of flat ranges AND consecutive breakout areas; red - lower bound of flat ranges AND consecutive breakout areas; yellow - center of flat ranges (NOT including breakout areas). When a b
It will be the best tool for you to make a profit! Through unique algorithms You're going to see an amazing amount of right trading signals Make huge profits every day and realize more possibilities!   Like the car no money to buy it, the love of the girls dare not to pursue?Or the credit card bill is not paid, the rent does not have the extra money to settle?Or are you fed up with being bossed around by your boss and Hope to get more people's respect?Can't afford to buy the things you want ? wa
PipFinite Exit EDGE
Karlo Wilson Vendiola
4.83 (115)
Did You Have A Profitable Trade But Suddenly Reversed? In a solid strategy, exiting a trade is equally important as entering. Exit EDGE helps maximize your current trade profit and avoid turning winning trades to losers. Never Miss An Exit Signal Again Monitor all pairs and timeframes in just 1 chart www.mql5.com/en/blogs/post/726558 How To Trade You can close your open trades as soon as you receive a signal Close your Buy orders if you receive an Exit Buy Signal. Close your Sell orders if
インディケータは現在のクオートを作成し、これを過去のものと比較して、これに基づいて価格変動予測を行います。インジケータには、目的の日付にすばやく移動するためのテキスト フィールドがあります。 オプション: シンボル - インジケーターが表示するシンボルの選択; SymbolPeriod - 指標がデータを取る期間の選択; IndicatorColor - インジケータの色; HorisontalShift - 指定されたバー数だけインディケータによって描画されたクオートのシフト; Inverse - true は引用符を逆にします。false - 元のビュー。 ChartVerticalShiftStep - チャートを垂直方向にシフトします (キーボードの上下矢印)。 次は日付を入力できるテキストフィールドの設定で、「Enter」を押すとすぐにジャンプできます。
マーケットシェーバー   マーケットスカルパー このインジケーターはRPTradeProSolutionsシステムの一部です。 Market Scalperは、プライスアクション、ダイナミックサポート、レジスタンスを使用した毎日のトレンド指標です。 誰でも使用できるように設計されており、トレーディングの初心者でも使用できます。 決して塗り直さないでください。 表示は近いものから近いものへと示されます。 単独で使用するように設計されているため、他のインジケーターは必要ありません。 明確でシンプルな表示を提供します どのように機能しますか MarketShaverはDualTimeFramesシステムを使用しています。 主な傾向はより高いTFによって取られますが、より速いものは取引を閉じるために使用されます トレードは1つずつ示され、同時に2つのトレードが存在することはありません。 マーケットシェーバーは次のことを示しています。 いつ取引するか いつそれを止めるか、利益か損失か。 貿易報酬 適切な期間終了TFを設定するのに役立つ多くの統計 マーケットシェーバーは動作します FXペ
トレンドトレーディング は、タイミングのプルバックとブレイクアウトにより、市場で起こっているトレンドから可能な限り利益を得るように設計された指標です。確立されたトレンドの中で価格が何をしているかを分析することにより、取引の機会を見つけます。 [ インストールガイド | 更新ガイド | トラブルシューティング | よくある質問 | すべての製品 ] 自信を持って効率的に金融市場を取引する むち打ちにならずに確立されたトレンドから利益を得る 収益性の高いプルバック、ブレイクアウト、早期の逆転を認識する この指標は、独自の品質とパフォーマンスを分析します 複数時間枠のダッシュボードを実装します インジケーターは再描画されていません 電子メール/音声/視覚アラートを実装します 確立されたトレンドは多くの取引機会を提供しますが、ほとんどのトレンド指標はそれらを完全に無視しています。インジケーターの解釈はかなり簡単です: (1) トレンドの変化 (2) トレンドの方向への後退 (3) トレンドの方向へのブレイクアウト 赤いダッシュ は下降トレンド中の修正です 青いダッシュ は上昇トレンド中
Crypto_Forex MT4 用インジケーター「モーニング スター パターン」 - インジケーター「モーニング スター パターン」は、プライス アクション トレーディングに非常に強力なインジケーターです。再描画なし、遅延なし。 - インジケーターは、チャート上で強気のモーニング スター パターンを検出します。チャート上の青い矢印信号 (画像を参照)。 - PC、モバイル、および電子メール アラート付き。 - また、その兄弟である弱気の「イブニング スター パターン」インジケーターも利用できます (以下のリンクに従ってください)。 - インジケーター「モーニング スター パターン」は、サポート/レジスタンス レベルと組み合わせるのに最適です。 // 優れたトレーディング ロボットとインジケーターは、こちらで入手できます: https://www.mql5.com/en/users/def1380/seller これは、この MQL5 Web サイトでのみ提供されるオリジナル製品です。
Crypto_Forex MT4 用インジケーター「3 Black Crows パターン」 - インジケーター「3 Black Crows パターン」は、プライスアクション取引に非常に効果的です。再描画なし、遅延なし。 - インジケーターは、チャート上の弱気な「3 Black Crows」パターンを検出します。チャート上の赤い矢印信号 (画像を参照)。 - PC、モバイル、および電子メールアラート付き。 - また、その兄弟である強気な「3 White Soldiers パターン」インジケーターも利用できます (以下のリンクに従ってください)。 - インジケーター「3 Black Crows パターン」は、サポート/レジスタンスレベルと組み合わせるのに最適です。 // より優れたエキスパートアドバイザーとインジケーターは、こちらで入手できます: https://www.mql5.com/en/users/def1380/seller これは、この MQL5 ウェブサイトでのみ提供されるオリジナル製品です。
Secret Liquidity Zones Indicator User Manual Introduction Unlock the power of hidden market opportunities with the Secret Liquidity Zones Indicator . This cutting‐edge tool is designed to reveal critical price levels where market momentum may shift. With its dynamic adaptability and sleek gold visuals, it offers clear and elegant insights into key trading opportunities—making it the perfect secret weapon for traders who demand precision and clarity. Key Features Dynamic Timeframe Adaptation: A
重要なお知らせ – ライセンスとアクティベーションが必要です   アクティベーション手順: 購入が完了したら、すぐに弊社にご連絡いただき、ライセンスキー、パスワード、またはアクティベーションの詳細をお受け取りください。これらがなければ、ソフトウェアは動作しません。スムーズなアクティベーションプロセスを保証し、どんなご質問にもお答えするために私たちがサポートいたします。 多言語カスタマイズ トレーディング体験を向上させるため、ソフトウェアを複数の言語で完全にカスタマイズするサービスを提供しています。弊社のチームは以下の言語で翻訳をご用意できます: 中国語 | フランス語 | ポルトガル語 | スペイン語 | ロシア語 日本語 | ドイツ語 | 韓国語 | イタリア語 | トルコ語 ご希望の言語をお知らせいただければ、ユーザーフレンドリーな体験を保証するため、インジケーターをカスタマイズいたします。 ボリュームプロファイル – 高度な市場分析ツール ボリュームプロファイルは、トレーダーに市場のダイナミク
This unique multi-currency strategy simultaneously determines the strength of trends and market entry points, visualizing this using histograms on the chart. The indicator is optimally adapted for trading on the timeframes М5, М15, М30, Н1. For the convenience of users, the indicator renders the entry point (in the form of an arrow), recommended take profit levels (TP1, TP2 with text labels) and the recommended Stop Loss level. The take profit levels (TP1, TP2) are automatically calculated for
A machine translation from the English product description was used. We apologize for possible imprecisions. 英語の製品説明からの機械翻訳が使用されました。 不正確な可能性があることをお詫び申し上げます。 お気に入りのろうそく足の価格アクションパターンの視覚化システム。 アタッチされると、インジケーターはチャート上の次のパターンを自動的にマークします。 ピノキオバー - 長い「鼻」を持つ小さなボディのバー、非常によく知られている逆のパターン。 内側のバー - 範囲が前のバーの範囲内にあるバー。 それは市場の不確実性を表しています。 外側のバー - 範囲が前のバーの範囲を超えるバー。 それは市場の不確実性を表しています。 レールパターン - ほぼ等しく、より大きなボディを持つ 2 つの結果として生じる反対側のバー。 逆のパターン。これは、より高い時間枠のピノキオバーパターンと実際に一致します。 マスターキャンドル パターン - キャンドルの 5 つ、後続の 4 つのキャンドルの範囲
Super Reversal Pattern Indicator Unlock the power of advanced pattern recognition with our Super Reversal Pattern Indicator. Designed for traders seeking precision and reliability, this indicator identifies one of the most effective reversal patterns in technical analysis, offering a significant edge in your trading strategy. Key Features: Non-Repainting Accuracy: Enjoy the confidence of non-repainting technology. Once a Super Reversal Pattern is detected, it remains static, providing consiste
The Indicator show Daily Pivot Points. It is possible to specify the number of days to display. For forex it doesn't consider the sunday session data. It is possibile to modify the color, style and  width for every level.It is better to use this indicator with timeframe not higher than Н1. 4 Levels of support and resistance with also Intermediate Levels that is possible to hide. Pivot trading: 1.pp pivot 2. r1 r2 r3, s1 s2 s3 Pivot points have been a trading strategy for a long time, orig
SMC Venom Model BPR インジケーターは、スマート マネー (SMC) コンセプトで取引するトレーダー向けのプロフェッショナル ツールです。価格チャート上の 2 つの主要なパターンを自動的に識別します。 FVG   (フェアバリューギャップ) は、3 本のローソク足の組み合わせで、最初のローソク足と 3 番目のローソク足の間にギャップがあります。ボリュームサポートのないレベル間のゾーンを形成し、価格修正につながることがよくあります。 BPR   (バランス価格範囲) は、2 つの FVG パターンの組み合わせで、「ブリッジ」を形成します。これは、価格がボリュームアクティビティの少ない動きで動くときに、ブレイクアウトしてレベルに戻るゾーンで、ローソク足の間にギャップを作成します。 これらのパターンは、大規模な市場プレーヤーと一般参加者の相互作用が発生するチャート上のボリュームと価格動向の分析に基づいて、トレーダーが主要なサポート/レジスタンス レベル、ブレイクアウト ゾーン、エントリ ポイントを識別するのに役立ちます。 インジケーターは、長方形と矢印の形でパターンを視
The perfect tool for Scalng in the Forex markets You can trade both from signal to signal and using take profit  The algorithm does not use Zigzag!  No redrawing!  This is a channel instrument that uses a moving average as a filter. Moving Average  There are 2 parameters for the settings Ma Period = 5 period Moving Average  Channel 1.0 distance of channel lines from the chart Price Signal Filter - calculation of signal opening and filter There is a complete set of Alert There is a multi-timefram
Delta Pairs
Anatolii Zainchkovskii
Delta Pairs is an indicator for pair trading, it displays the divergence of two currency pairs. Does not redraw. A useful tool for the analysis of the behavior of two currency pairs relative to each other. Purpose The Delta Pairs indicator is designed for determining the divergences in the movements of two currency pairs. This indicator is displayed as two line charts and the difference (delta) between these charts in the form of a histogram. The Delta Pairs indicator will be useful for those w
Noize Absorption Index - is the manual trading system that measures the difference of pressure between bears forces and bulls forces. Green line - is a noize free index that showing curent situation. Zero value of index shows totally choppy/flat market.Values above zero level shows how powerfull bullish wave is and values below zero measures bearish forces.Up arrow appears on bearish market when it's ready to reverse, dn arrow appears on weak bullish market, as a result of reverse expectation. S
The Th3Eng PipFinite indicator is based on a very excellent analysis of the right trend direction with perfect custom algorithms. It show the true direction and the best point to start trading. With StopLoss point and Three Take Profit points. Also it show the right pivot of the price and small points to order to replace the dynamic support and resistance channel, Which surrounds the price. And Finally it draws a very helpful Box on the left side on the chart includes (take profits and Stop loss
Heiken Ashi candle chart is an improved version of The Japanese candle chart, which can effectively filter the market "noise" of the Japanese candle chart. It is favored by many traders for its simplicity and intuition. For trend traders, the HA candle chart is a magic tool. Unlike the traditional Japanese candle chart, Heikenashi does not reflect the opening price, high price, low price and closing price of the market. Instead, Heikenashi calculates the value of a single K line in the dominant
Was: $299  Now: $149   Supply Demand uses previous price action to identify potential imbalances between buyers and sellers. The key is to identify the better odds zones, not just the untouched ones. Blahtech Supply Demand indicator delivers functionality previously unavailable on any trading platform. This 4-in-1 indicator not only highlights the higher probability zones using a multi-criteria strength engine, but also combines it with multi-timeframe trend analysis, previously confirmed swings
まず第一に、この取引ツールはノンリペイント、ノンリドロー、ノンラグの指標であり、プロの取引に理想的ですことを強調する価値があります。 オンラインコース、ユーザーマニュアル、デモ。 スマートプライスアクションコンセプトインジケーターは、新米から経験豊富なトレーダーまで、非常 に強力なツールです。Inner Circle Trader AnalysisやSmart Money Concepts Trading Strategiesなど、20以上の有用な指標を1つに組み合わせています。このインジケーターはスマートマネーコンセプトに焦点を当て、大手機関の取引方法を提供し、彼らの動きを予測するのに役立ちます。 特に、流動性分析に優れており、機関がどのように取引しているかを理解しやすくしています。市場のトレンドを予測し、価格の動きを慎重に分析するのに優れています。機関の戦略とトレードを合わせることで、市場の動向についてより正確な予測ができます。このインジケーターは多目的であり、市場構造を分析し、重要な注文ブロックを特定し、さまざまなパターンを認識するのに優れています。 このインジケーターは
このプロダクトを購入した人は以下も購入しています
Enigmera
Ivan Stefanov
5 (7)
ENIGMERA: 市場の中心 重要:MQL5.comのデモはStrategy Testerで実行されており、Enigmeraの機能を完全には反映していない場合があります。詳細については、説明、スクリーンショット、ビデオをご確認ください。質問があれば、遠慮なくメッセージを送ってください! インジケーターのコードは完全に書き直されました。バージョン3.0は新機能を追加し、インジケーターの開始以来蓄積されたバグを修正しました。 紹介 このインジケーターとトレーディングシステムは、金融市場への注目すべきアプローチです。ENIGMERAはフラクタルサイクルを使用して、サポートとレジスタンスのレベルを正確に計算します。真の蓄積フェーズを示し、方向と目標を提供します。トレンドでも修正でも機能するシステムです。 動作方法 インジケーターのほとんどの機能は、チャートの左側にあるボタンで制御され、市場の状況に迅速に対応できるようになっています。 ボタン ON/OFF – インジケーター全体を表示または非表示にします。 Channel – サポートチャネルを有効にし、許容範囲の偏差を示します。 Dev
!SPECIAL SALE! An exclusive indicator that utilizes an innovative algorithm to swiftly and accurately determine the market trend. The indicator automatically calculates opening, closing, and profit levels, providing detailed trading statistics. With these features, you can choose the most appropriate trading instrument for the current market conditions. Additionally, you can easily integrate your own arrow indicators into Scalper Inside Pro to quickly evaluate their statistics and profitability
Dynamic Forex28 Navigator - 次世代の Forex 取引ツール。 現在 49% オフ。 Dynamic Forex28 Navigator は、長年人気のインジケーターを進化させたもので、3 つの機能を 1 つにまとめています。 Advanced Currency Strength28 インジケーター (レビュー 695 件)  + Advanced Currency IMPULSE with ALERT (レビュー 520 件) + CS28 コンボ シグナル (ボーナス)。 インジケーターの詳細 https://www.mql5.com/en/blogs/post/758844 次世代の Strength インジケーターが提供するもの  オリジナルで気に入っていたすべての機能が、新機能と精度の向上によって強化されました。 主な機能: 独自の通貨強度計算式。 すべての時間枠でスムーズかつ正確な強度ライン。 トレンドの特定と正確なエントリーに最適です。 ダイナミックマーケットフィボナッチレベル (マーケットフィボナッチ)。 このインジケーターに固有
優れたテクニカルインジケーター「Grabber」をご紹介します。これは、すぐに使える「オールインワン」トレーディング戦略として機能します。 ひとつのコードに、市場のテクニカル分析ツール、取引シグナル(矢印)、アラート機能、プッシュ通知が強力に統合されています。 このインジケーターを購入された方には、以下の特典を無料で提供します: Grabberユーティリティ:オープンポジションを自動で管理するツール ステップバイステップのビデオマニュアル:インジケーターのインストール、設定、取引方法を解説 カスタムセットファイル:インジケーターをすばやく自動設定し、最大限の成果を出すための設定ファイル 他の戦略はもう忘れてください!Grabberだけが、あなたを新たなトレードの高みへと導いてくれるのです。 Grabber戦略の主な特徴: 推奨タイムフレーム:M5〜H4 対応通貨ペア・資産:どれでも使用可能ですが、私が実際に検証した以下を推奨します(GBPUSD、GBPCAD、GBPCHF、AUDCAD、AUDUSD、AUDSGD、AUDCHF、NZDUSD、NZDCAD、EURCAD、EURUSD、E
現在20%OFF! 初心者やエキスパートトレーダーのためのベストソリューション! このダッシュボードソフトウェアは、28の通貨ペアで動作しています。それは私達の主要な指標(高度な通貨の強さ28と高度な通貨インパルス)の2に基づいています。それは全体の外国為替市場の大きい概観を与えます。それは、すべての(9)時間枠で28の外国為替ペアのための高度な通貨の強さの値、通貨の動きの速度と信号を示しています。チャート上で1つのインディケータを使用して市場全体を観察し、トレンドやスキャルピングの機会をピンポイントで見つけることができたら、あなたのトレードがどのように改善されるか想像してみてください。 このインディケータには、強い通貨と弱い通貨の識別、潜在的な取引の識別と確認がより簡単になるような機能が搭載されています。このインディケータは、通貨の強さや弱さが増加しているか減少しているか、また、すべての時間枠でどのように機能しているかをグラフィカルに表示します。 新機能として、現在の市場環境の変化に適応するダイナミックなマーケットフィボナッチレベルが追加され、すでに当社のAdvanced
Lux Trend
Mohamed Hassan
5 (3)
After purchase, please contact me to get your trading tips + more information for a great bonus!   Lux Trend is a professional strategy based on using Higher Highs and Lower Highs to identify and draw Trendline Breakouts! Lux Trend  utilizes two Moving Averages to confirm the overall trend direction before scanning the market for high-quality breakout opportunities, ensuring more accurate and reliable trade signals. This is a proven trading system used by real traders worldwide, demonstrating
Golden Trend Indicator
Noha Mohamed Fathy Younes Badr
4.9 (10)
Golden Trend indicator  is The best indicator for predicting trend movement this indicator never lags and never repaints and never back paints    and give  arrow buy and sell    before the candle appear  and it will help you and  will make your trading decisions clearer its work on all currencies and  gold and crypto and all time frame This unique  indicator uses very secret algorithms to catch the  trends, so you can trade using this indicator and see the trend clear on charts  manual guide and
After your purchase, feel free to contact me for more details on how to receive a bonus indicator called VFI, which pairs perfectly with Easy Breakout for enhanced confluence!   Easy Breakout is a powerful price action trading system built on one of the most popular and widely trusted strategies among traders: the Breakout strategy ! This indicator delivers crystal-clear Buy and Sell signals based on breakouts from key support and resistance zones. Unlike typical breakout indicators, it levera
Gold Venamax   - これは最高の株式テクニカル指標です。 指標アルゴリズムは資産の価格変動を分析し、ボラティリティと潜在的なエントリーゾーンを反映します。 インジケーターの機能: これは、快適で収益性の高い取引のためのマジックとトレンド矢印の 2 つのブロックを備えたスーパー インジケーターです。 チャート上にブロックを切り替えるための赤いボタンが表示されます。 マジックはインジケーター設定で設定されているため、異なるブロックを表示する 2 つのチャートにインジケーターをインストールできます。 Gold Venamax は、異なる矢印バッファー (GV と SD) を備えた 2 つのチャートに配置できます。 これを行うには、設定で異なる Magic を選択する必要があります。たとえば、あるマジック = 999、別のマジック = 666 を選択します。次に、チャート上の赤いボタンで矢印バッファを選択できます。 入力するのに最適な信号 = 両方のバッファ (GV および SD) の信号矢印 + 3 本すべての MA ライン (赤または青) の方向に従います + TMA チャ
VERSION MT5        —        ИНСТРУКЦИЯ RUS           —        INSTRUCTIONS  ENG 主な機能: レンダリングなしで正確な入力信号! シグナルが表示された場合、それは関連性を維持します。これは、シグナルを提供してからそれを変更する可能性があり、入金時の資金の損失につながる可能性があるリドローインジケーターとの重要な違いです。より高い確率と精度で市場に参入できるようになりました。矢印が表示された後、ターゲットに達する (利益確定) か反転シグナルが表示されるまで、ローソク足を色付けする機能もあります。 STOP LOSS / TAKE PROFITゾーンの表示 エントリーポイントを検索する際の視覚的な明瞭さを改善するために、市場に参入するための最適なポイントが検索される買い/売りゾーンを最初に表示するモジュールが作成されました。ストップロスレベルを操作するための追加のインテリジェントロジックは、時間の経過とともにそのサイズを縮小するのに役立ち、その結果、取引を開始するとき(move sl)の初期リスクを軽減しま
PUMPING STATION – あなた専用の「オールインワン」戦略 PUMPING STATIONは、あなたのトレードをより楽しく、そして効果的に変えてくれる革新的なFXインジケーターです。ただの補助ツールではなく、強力なアルゴリズムを備えた本格的なトレーディングシステムで、より安定したトレードのスタートをサポートします。 この商品をご購入いただくと、以下の特典を無料でお付けします: 専用セットファイル:自動設定による最大パフォーマンスを実現。 ステップバイステップのビデオマニュアル:PUMPING STATION戦略の使い方を学べます。 Pumping Utility:PUMPING STATION専用の半自動トレードボットで、より快適かつシンプルな運用を可能にします。 ※ご購入後すぐにご連絡ください。追加リソースへのアクセスを提供いたします。 PUMPING STATIONの仕組み: トレンド管理:市場のトレンド方向を即座に判断。トレンドはあなたの最高の味方です。 エントリーサイン:チャート上の矢印で、取引のタイミングと方向を明確に示します。 明確な目標設定:インジケーターが自
指示する     ロシア     -        utilizar con   el indicador の ESP 推奨事項 -   TPSpro トレンド プロフェッショナル版 -   MT5のバージョン 最も重要なことは、将来においても最も重要なことです。 機能のプリンシパル: ゾーンのほとんどは、ベンダーとコンプラドールによってアクティブ化されます。 状況を直感的に把握できるよう、初期の衝動を修正します。 LOGIC AI: MUESTRA zonas (círculos) parabuscar puntos de entrada cuando se activa una plantilla 視覚的に優れた視覚効果があり、最も重要な機能がすべて揃っていることに注意してください。 優れたニベレス/ゾーンの視覚化 (modo MTF) 世界で最も人気のある場所/ゾーンです。これを使用するのに最適な方法です (   TPSproTREND PRO   )。 アルゴリズム プロフェッショナル セパラド パソ ア パソ パラ オペラ それは、オペラハウスやコントラ・デ・エラの指導におい
現在26%オフ 初心者やエキスパートトレーダーに最適なソリューション! このインジケーターは、独自の機能と新しい計算式を取り入れた、ユニークで高品質、かつ手頃な価格のトレーディングツールです。たった1枚のチャートで28の為替ペアの通貨強度を読み取ることができます。新しいトレンドやスキャルピングチャンスの引き金となるポイントを正確に特定することができるので、あなたのトレードがどのように改善されるか想像してみてください。 ユーザーマニュアルはこちら  https://www.mql5.com/en/blogs/post/697384 これが最初の1本、オリジナルだ! 価値のないクローンを買わないでください。 特別な サブウィンドウの矢印で強い通貨の勢いを表示 GAPがあなたのトレードを導く! 基準通貨や気配値が売られすぎ・買われすぎのゾーン(外相フィボナッチレベル)にあるとき、個別チャートのメインウィンドウに警告表示。 通貨がレンジの外側から反落した場合、プルバック/リバーサルのアラート。 クロスパターンの特別なアラート 複数の時間枠を選択可能で、トレンドを素早く確認できます
Introduction to X3 Chart Pattern Scanner X3 Cherart Pattern Scanner is the non-repainting and non-lagging indicator detecting X3 chart patterns including Harmonic pattern, Elliott Wave pattern, X3 patterns, and Japanese Candlestick patterns. Historical patterns match with signal patterns. Hence, you can readily develop the solid trading strategy in your chart. More importantly, this superb pattern scanner can detect the optimal pattern of its kind. In addition, you can switch on and off individu
KT Renko Patterns MT4
KEENBASE SOFTWARE SOLUTIONS
2.33 (3)
KT Renko Patterns は、レンコチャートの各レンガをスキャンしながら、さまざまな金融市場でトレーダーによく使用されている有名なチャートパターンを検出します。 時間ベースのチャートと比較して、レンコチャートは視認性が高くシンプルなため、パターンベースのトレードがより簡単かつ明確になります。 KT Renko Patterns は複数のレンコパターンを搭載しており、その多くは Prashant Shah 氏の著書『Profitable Trading with Renko Charts』でも詳しく解説されています。 KT Renko Patterns インジケーターに基づいた 100% 自動化された EA は、こちらからご利用いただけます - KT Renko Patterns EA 。 機能一覧 最大8種類の明確なレンコパターンを表示し、あいまいさなく取引をサポートします。 完全な客観性を保つため、すべてのパターンにストップロスとフィボナッチターゲットが設定されています。 KT Renko Patterns は各パターンの精度を継続的に測定し、重要な統計情報をチャート
トレンドオシレーター:スムーズで信頼性の高いトレンド識別ツール トレンドオシレーターは、トレーダーがトレンドの方向と反転ポイントを正確に特定するのをサポートするために設計された、MT4向けの高度なインジケーターです。直感的なビジュアルで、相場が上昇トレンドにあるのか下降トレンドにあるのかを明確に示し、分析を簡素化し、チャートの視認性を向上させます。幅広い市場と時間枠に対応しており、さまざまな取引ニーズに柔軟に対応します。 トレンドオシレーターの主な特徴と利点 トレンドの簡素化されたビジュアライゼーション : トレンドオシレーターは、色が変わるラインでトレンドの動きを表現します。青色は上昇トレンド、黄色は下降トレンドを示し、即座にトレンド方向が分かります。 信頼性の高い反転シグナル : 高度なアルゴリズムを使用して、インジケーターは反転ポイントを示すカラフルな矢印を生成します。緑色の矢印は買いシグナル、赤色の矢印は売りシグナルを示し、トレーダーがエントリーやエグジットを評価するための重要なゾーンを特定するのに役立ちます。 あらゆる市場と時間枠に対応可能 : トレンドオシレーターは、さまざ
Linear Trend Predictor ー - エントリ ポイントと方向サポート ラインを組み合わせたトレンド インジケーター。高値/安値チャネルを突破するという原理に基づいて機能します。 インジケーターのアルゴリズムは市場のノイズをフィルタリングし、ボラティリティと市場の動向を考慮します。 インジケーターの機能  平滑化手法を使用して、市場のトレンドと、買い注文または売り注文を開くためのエントリー ポイントを表示します。  任意の時間枠のチャートを分析して、短期および長期の市場の動きを判断するのに適しています。  あらゆる市場や時間枠に適応可能な入力パラメータにより、トレーダーはインジケーターを独自にカスタマイズできます。  設定されたインジケーター信号は消えず、再描画もされません。ローソク足の終値で決定されます。以前にシグナルを受信して​​現在のローソク足で使用することも可能ですが、シグナルが変わる可能性があります。  いくつかの種類の通知が矢印と組み合わされています。  このインジケーターは、独立した取引システムとして使用することも、他の取引システムへの追加として使用
Advanced Currency Strength Indicator The Advanced Divergence Currency Strength Indicator. Not only it breaks down all 28 forex currency pairs and calculates the strength of individual currencies across all timeframes , but, You'll be analyzing the WHOLE forex market in 1 window (In just 1 minute) . This indicator is very powerful because it reveals the true movements of the market.  It is highly recommended to  analyze charts knowing the performance of individual currencies or the countries eco
The   Volume Spread Analysis indicator   is based on the original Volume Spread Analysis method. It was designed for quick and easy recognition of VSA patterns. Even though this indicator looks very simple, it is the most sophisticated tool we've ever made. It is a really powerful analytical tool that generates very reliable trading signals. Because it is very user-friendly and understandable, it is suitable for every type of trader, regardless of his experience. What is VSA? VSA - Volume Spre
MTF Supply Demand Zones
Georgios Kalomoiropoulos
4.82 (22)
次世代の自動化された需要と供給のゾーン。どのチャートでも機能する新しい革新的なアルゴリズム。すべてのゾーンは、市場の価格行動に従って動的に作成されています。 2種類のアラート --> 1) 価格がゾーンに達したとき 2) 新しいゾーンが形成されたとき もう 1 つの役に立たない指標はありません。実績のある完全な取引戦略を手に入れることができます。     新機能:     価格が需給ゾーンに達したときにアラートを出す     新しい需給ゾーンが作成されたときにアラートを発します     プッシュ通知アラート     ピップ単位のゾーン幅ラベル     MTF のもう 1 つのタイムフレーム。したがって、現在より 2 時間足高いのではなく、現在より 3 時間足し上に見えるようになります。     アラート/ゾーン/MTF 機能を有効/無効にするボタン あなたが得る利点:     取引から感情を取り除きます。     取引エントリをオブジェクト化します。     確率の高いセットアップで利益を上げましょう。     描画ゾーンから時間を節約します。
ガン理論に基づいた修正ゾーンの手動構築用インジケーター。ゾーンは、M1 から始まり D1 で終わるさまざまな時間枠の特別な係数を使用した数学的計算によって決定されます。このインジケーターは通貨ペアや金属だけでなく、暗号通貨や株式でも機能します。 このインジケーターを使用すると、市場サイクルに基づいて購入/販売のサポートゾーンを簡単に構築し、これらのゾーンに近づいたときに取引の決定を下すことができます。 これにより、買い/売りサポートゾーンからの価格変動の方向を理解できるようになります。 また、このインジケーターの助けを借りて、上昇/下降サイクルのブレークを決定し、エントリ ポイントを決定することができます。 スキャルピング、短期および中期取引に適しています。それはすべてあなたの取引スタイルに依存します。 とても使いやすいです。ゾーンの構築には 4 つのキーのみが使用されます。 ゾーンは、チャート上で目立つ高値/安値から手動で構築されます。 購入のサポート ゾーンを構築するには、明確に定義された高値にマウス カーソルを置き、「2」キーを押す必要があります。チャートにインジ
With this system you can spot high-probability trades in direction of strong trends. You can profit from stop hunt moves initiated by the smart money! Important Information How you can maximize the potential of the scanner, please read here: www.mql5.com/en/blogs/post/718109 Please read also the blog about the usage of the indicator: Professional Trading With Strong Momentum. With this system you have 3 reliable edges on your side: A strong trend (=high probability of continuation) A deep pull
Wave Synchronizer は、波動分析の視覚的なインジケーターです。ローソク足の動きのシーケンスを組み合わせて方向性のある波を構築し、市場と同期した動きを生み出します。 各波の始まりはシグナル矢印で始まり、アラートもあります。 インジケーターは、以前の履歴の矢印を再描画したり移動したりすることはありません。 シグナル矢印は、ローソク足の終値に表示されます。 あらゆる取引商品や時間枠で動作するように適応します。 使いやすく設定も簡単で、入力パラメーターは 2 つだけです。選択したパラメーターで使用する時間枠の選択と、MA ラインの計算方法です。 推奨パラメーターは 1 ~ 2 期間シフトできます。 取引資産を購入する場合は矢印の方向が赤になります。 取引資産を売却する場合は矢印の方向が青になります。
Cycle Sniper
Elmira Memish
4.39 (36)
NEW YEAR SALE PRICE FOR LIMITED TIME!!! Please contact us after your purchase and we will send you the complimentary indicators to complete the system Cycle Sniper is not a holy grail but when you use it in a system which is explained in the videos, you will feel the difference. If you are not willing to focus on the charts designed with Cycle Sniper and other free tools we provide, we recommend not buying this indicator. We recommend watching the videos about the indiactor and system before pu
Gold Trend   - これは優れた株価テクニカル指標です。指標のアルゴリズムは、資産の値動きを分析し、ボラティリティと潜在的なエントリーゾーンを反映しています。 最高の指標シグナル: - 売りの場合 = 赤のヒストグラム + 赤のショートポインター + 同じ方向に黄色のシグナル矢印。 - 買いの場合 = 青のヒストグラム + 青のロングポインター + 同じ方向の水色のシグナル矢印。 インジケータの利点 1. このインディケータは、高い精度でシグナルを発信します。 2. 確定した矢印シグナルは、トレンドが変化したときにのみ再描画されます。 3. どのブローカーのMetaTrader 4取引プラットフォームでも取引できます。 4. あらゆる資産(通貨、金属、暗号通貨、株式、指数など)を取引できます。 5. H1タイムフレーム(中期取引)で取引するのがよい。 6. 各トレーダーがインディケータを自分用に簡単にカスタマイズできるよう、インディケータ設定で個々のパラメータ(TF、色など)を変更できます。 7. このインディケータは、トレーディングシステムの優れたメイン機能と
Gold Channel is a volatility-based indicator, developed with a specific timing algorithm for the XAUUSD pair, which consists of finding possible corrections in the market. This indicator shows two outer lines, an inner line (retracement line) and an arrow sign, where the theory of the channel is to help identify overbought and oversold conditions in the market. The market price will generally fall between the boundaries of the channel. If prices touch or move outside the channel it is a tradi
現在20%OFF! 初心者やエキスパートトレーダーに最適なソリューションです。 このインディケータは、エキゾチックペア・コモディティ・インデックス・先物など、あらゆるシンボルの通貨の強さを表示することに特化したインディケータです。金、銀、原油、DAX、US30、MXN、TRY、CNHなどの通貨の強さを表示するために、9行目にどのシンボルでも追加することができます。独自の機能を多数搭載し、新しい計算式を採用したため、ユニークで高品質、かつ手頃な価格のトレーディングツールとなっています。新しいトレンドやスキャルピングチャンスのトリガーポイントを正確に把握することができるため、あなたのトレードがどのように改善されるか想像してみてください。 ユーザーマニュアル:ここをクリック   https://www.mql5.com/en/blogs/post/708876 すべての時間枠に対応します。あなたはすぐにトレンドを見ることができるようになります! 新しいアルゴリズムに基づいて設計されているため、潜在的な取引の特定と確認がより簡単になります。これは、8つの主要通貨と1つのシンボルの強弱
Bonus: when you buy  the indicator, 2 any of my indicators for free (of your choice) .(Write in a private message or in telegram in the profile to receive a bonus) Quantum Entry is a powerful price action trading system built on one of the most popular and widely known strategies among traders: the Breakout Strategy! This indicator produces crystal clear buy and sell signals based on breakouts of key support and resistance zones. Unlike typical breakout indicators, it uses advanced calculation
MT5 Version Gaussian Channel MT4 Gaussian Channel MT4 is the first indicator in the market that uses Ehlers Gaussian Filter methods to define trends. Nowadays, this Gaussian Channel is highly known as a method to support HOLD techniques in crypto. If the price is above the channel the trend is strong, if it comes back to the channel this can react as a resistance and indicate the beginning of a bear market (or Winter) if the price breaks below it. Eventhough the use of this channel focuses on h
Of all the four principle capital markets, the world of foreign exchange trading is the most complex and most difficult to master, unless of course you have the right tools! The reason for this complexity is not hard to understand. First currencies are traded in pairs. Each position is a judgment of the forces driving two independent markets. If the GBP/USD for example is bullish, is this being driven by strength in the pound, or weakness in the US dollar. Imagine if we had to do the same thing
作者のその他のプロダクト
FX Power: 通貨の強弱を分析して、より賢い取引を実現 概要 FX Power は主要通貨と金の実際の強弱をあらゆる市場状況で理解するための必須ツールです。強い通貨を買い、弱い通貨を売ることで、 FX Power は取引の意思決定を簡素化し、高い確率の取引機会を見出します。トレンドを追従する場合でも、極端なデルタ値を使用して反転を予測する場合でも、このツールはあなたの取引スタイルに完全に適応します。ただ取引するだけではなく、 FX Power で賢く取引をしましょう。 1. なぜ FX Power がトレーダーにとって非常に有益なのか 通貨と金のリアルタイム強弱分析 • FX Power は主要通貨と金の相対的な強弱を計算し、マーケットダイナミクスに関する明確な洞察を提供します。 • どの資産がリードしているか、または後れを取っているかを監視して、取引するペアを賢く選びましょう。 マルチタイムフレームの包括的なビュー • 短期、中期、長期のタイムフレームで通貨と金の強弱を追跡し、マーケットトレンドに基づいて取引戦略を調整できます。 • スキャルピングからスイングトレード
FX Volume MT5
Daniel Stein
4.82 (17)
FX Volume:ブローカー視点で捉える本物の市場センチメント クイック概要 トレード手法をさらに高めたいとお考えですか? FX Volume は、リテールトレーダーやブローカーのポジション状況をリアルタイムで提供します。これは、COTのような遅延レポートよりもはるかに早く知ることができます。安定した利益を目指す方も、さらなる優位性を求める方も、 FX Volume は大きな不均衡を見極め、ブレイクアウトを確認し、リスク管理を洗練させるのに役立ちます。今すぐ始めて、実際の出来高データがどのように意思決定を変革するかを体感してください! 1. FX Volume がトレーダーにとって非常に有益な理由 高精度の早期警戒シグナル • 各通貨ペアを売買しているトレーダー数を、他者よりも早く、ほぼリアルタイムで把握できます。 • FX Volume は、複数のリテールブローカーから得られる本物の出来高データを収集し、分かりやすい形式で提供する 唯一 のツールです。 強力なリスク管理 • ロングやショートの大きな偏り(インバランス)を特定し、潜在的なトレンド転換を見逃しません。ストップ
FX Levels: あらゆる市場における非常に高精度なサポート&レジスタンス 概要 通貨ペア、株式指数、個別銘柄やコモディティなど、どのような市場でも信頼できるサポートとレジスタンスを特定したいですか? FX Levels は伝統的な “Lighthouse” メソッドと先進的な動的アプローチを融合し、ほぼ汎用的な精度を実現します。ブローカーの実務経験を活かし、自動化されたデイリー更新とリアルタイム更新を組み合わせることで、 FX Levels は反転ポイントを見つけ、利益目標を設定し、自信をもってトレードを管理するための手助けをします。今すぐ試してみて、サポート/レジスタンス分析の正確性がどれほどトレードを向上させるかを実感してください! 1. FX Levels がトレーダーにとって非常に有用な理由 非常に正確なサポート&レジスタンスゾーン • FX Levels は異なるブローカー環境でもほぼ同一のゾーンを生成するよう設計されており、データフィードの差異や時刻設定のずれによる不一致を解消します。 • つまり、どのブローカーを利用していても一貫したレベルが得られるため、戦
Custom Alerts: 複数の市場を同時にモニターし、重要なチャンスを逃さない 概要 Custom Alerts は、複数の銘柄で発生する潜在的なセットアップを統合して追跡したいトレーダーに向けたダイナミックなソリューションです。FX Power、FX Volume、IX Power などの主力ツールから得られるデータを統合することで、 Custom Alerts は、複数のチャートを切り替えたり、絶好の機会を逃したりするリスクなしに、市場での重要な変化を自動的に通知します。よりスマートかつ効率的にトレードしたい方は、 Custom Alerts を活用してモニタリング能力を大幅に向上させましょう。 1. なぜ Custom Alerts がトレーダーにとって非常に有益なのか 全てを一括管理するマーケットモニタリング • Custom Alerts は、主要8通貨、ゴールド、および最大7つの指数や商品など、さまざまな銘柄からのシグナルを集約・統合します。 • 多数のチャートを切り替える手間を省き、明確かつ一元化された通知を受け取ることが可能です。 戦略に合わせたカスタムア
FX Power: 通貨の強弱を分析して、より賢い取引を実現 概要 FX Power は主要通貨と金の実際の強弱をあらゆる市場状況で理解するための必須ツールです。強い通貨を買い、弱い通貨を売ることで、 FX Power は取引の意思決定を簡素化し、高い確率の取引機会を見出します。トレンドを追従する場合でも、極端なデルタ値を使用して反転を予測する場合でも、このツールはあなたの取引スタイルに完全に適応します。ただ取引するだけではなく、 FX Power で賢く取引をしましょう。 1. なぜ FX Power がトレーダーにとって非常に有益なのか 通貨と金のリアルタイム強弱分析 • FX Power は主要通貨と金の相対的な強弱を計算し、マーケットダイナミクスに関する明確な洞察を提供します。 • どの資産がリードしているか、または後れを取っているかを監視して、取引するペアを賢く選びましょう。 マルチタイムフレームの包括的なビュー • 短期、中期、長期のタイムフレームで通貨と金の強弱を追跡し、マーケットトレンドに基づいて取引戦略を調整できます。 • スキャルピングからスイングトレード
FX Dynamic: カスタマイズ可能なATR分析でボラティリティとトレンドを把握 概要 FX Dynamic は平均的な真のレンジ(ATR)の計算を活用して、日次および日中ボラティリティに関する卓越した情報をトレーダーに提供する強力なツールです。80%、100%、130%などのボラティリティ閾値を設定することで、通常の範囲を超えた際にすぐに警告を受け取ったり、有望な利益機会を素早く捉えられます。 FX Dynamic はブローカーのタイムゾーンに合わせて調整でき、安定したボラティリティ測定を維持しながら、リアルタイム分析のためにMetaTraderとシームレスに連携します。 1. なぜFX Dynamicがトレーダーにとって非常に有益か リアルタイムのATRインサイト • 日次・日中のボラティリティをひと目で把握。価格がATRの80%、100%、130%などに達したときに警告を受け取り、重要な水準にあるかどうかを確認できます。 • ボラティリティが完全に爆発する前に潜在的な反転やブレイクアウトを先取り可能。 幅広いマーケットへの適用 • 外国為替、コモディティ、株価指数な
IX Power: 指数、商品、暗号資産、外国為替市場の洞察を発見 概要 IX Power は、指数、商品、暗号資産、外国為替市場の強弱を分析するための多用途ツールです。 FX Power が全ての利用可能な通貨ペアデータを活用して外為ペアで最高の精度を提供する一方、 IX Power は基礎資産の市場データにのみ焦点を当てています。この特性により、 IX Power は非外為市場に最適であり、単純な外為分析にも信頼性の高いツールです。どのチャートでもスムーズに機能し、取引判断を向上させるための明確で実行可能な洞察を提供します。 1. IX Power がトレーダーにとって価値がある理由 複数市場での強弱分析 • IX Power は指数、商品、暗号資産、外為シンボルの強弱を計算し、それぞれの市場に合わせた洞察を提供します。 • US30、WTI、ゴールド、ビットコイン、または通貨ペアなどの資産を監視して取引機会を発見できます。 幅広い市場に適応 • 外為取引では、 FX Power が関連する全ての通貨ペアを分析することで比類のない精度を提供します。 • IX Power
FX Levels: あらゆる市場における非常に高精度なサポート&レジスタンス 概要 通貨ペア、株式指数、個別銘柄やコモディティなど、どのような市場でも信頼できるサポートとレジスタンスを特定したいですか? FX Levels は伝統的な “Lighthouse” メソッドと先進的な動的アプローチを融合し、ほぼ汎用的な精度を実現します。ブローカーの実務経験を活かし、自動化されたデイリー更新とリアルタイム更新を組み合わせることで、 FX Levels は反転ポイントを見つけ、利益目標を設定し、自信をもってトレードを管理するための手助けをします。今すぐ試してみて、サポート/レジスタンス分析の正確性がどれほどトレードを向上させるかを実感してください! 1. FX Levels がトレーダーにとって非常に有用な理由 非常に正確なサポート&レジスタンスゾーン • FX Levels は異なるブローカー環境でもほぼ同一のゾーンを生成するよう設計されており、データフィードの差異や時刻設定のずれによる不一致を解消します。 • つまり、どのブローカーを利用していても一貫したレベルが得られるため、戦
Taurus MT5
Daniel Stein
5 (1)
Taurusでトレーディングの一貫性と自信を引き出す タウラスは、当社独自の実際の取引量データを活用した、平均回帰取引における革新と洗練の最高峰です。リスクとリターンの卓越したバランスを実現するよう設計されたタウラスは、正確かつ慎重に取引を処理しながら、ストレスのない取引体験をお約束します。 タウラスを選ぶ理由 高度な平均回帰戦略 :独自の実数値データを基に構築されたタウラスは、比類のない精度で高確率の機会を特定します。 ストレスフリーのリスク管理 :グリッド、マーチンゲール、リスクの高い平均化手法は一切使用しません。 28のFXペアにわたる精度 :最高のパフォーマンスを実現するために最適化されたシンボル固有の設定を使用して、すべての主要シンボルを取引します。 固定SLでシンボルごとに1トレード :各トレードには事前に定義されたストップロスが含まれ、規律あるリスク管理を保証します。 カスタマイズ可能なリスク :トレードごとのリスクは完全に調整可能で、あらゆるトレーダーのスタイルとリスク許容度に適しています。 コンプライアンス対応 :100%FIFOに対応し、機関投資家の基準を満た
FX Dynamic: カスタマイズ可能なATR分析でボラティリティとトレンドを把握 概要 FX Dynamic は平均的な真のレンジ(ATR)の計算を活用して、日次および日中ボラティリティに関する卓越した情報をトレーダーに提供する強力なツールです。80%、100%、130%などのボラティリティ閾値を設定することで、通常の範囲を超えた際にすぐに警告を受け取ったり、有望な利益機会を素早く捉えられます。 FX Dynamic はブローカーのタイムゾーンに合わせて調整でき、安定したボラティリティ測定を維持しながら、リアルタイム分析のためにMetaTraderとシームレスに連携します。 1. なぜFX Dynamicがトレーダーにとって非常に有益か リアルタイムのATRインサイト • 日次・日中のボラティリティをひと目で把握。価格がATRの80%、100%、130%などに達したときに警告を受け取り、重要な水準にあるかどうかを確認できます。 • ボラティリティが完全に爆発する前に潜在的な反転やブレイクアウトを先取り可能。 幅広いマーケットへの適用 • 外国為替、コモディティ、株価指数な
Custom Alerts: 複数の市場を同時にモニターし、重要なチャンスを逃さない 概要 Custom Alerts は、複数の銘柄で発生する潜在的なセットアップを統合して追跡したいトレーダーに向けたダイナミックなソリューションです。FX Power、FX Volume、IX Power などの主力ツールから得られるデータを統合することで、 Custom Alerts は、複数のチャートを切り替えたり、絶好の機会を逃したりするリスクなしに、市場での重要な変化を自動的に通知します。よりスマートかつ効率的にトレードしたい方は、 Custom Alerts を活用してモニタリング能力を大幅に向上させましょう。 1. なぜ Custom Alerts がトレーダーにとって非常に有益なのか 全てを一括管理するマーケットモニタリング • Custom Alerts は、主要8通貨、ゴールド、および最大7つの指数や商品など、さまざまな銘柄からのシグナルを集約・統合します。 • 多数のチャートを切り替える手間を省き、明確かつ一元化された通知を受け取ることが可能です。 戦略に合わせたカスタムア
FX Trend MT5
Daniel Stein
4.63 (32)
常に利益を出し続ける5つ星FXトレーダーになりたいですか? 購入時のスクリーンショットを送信して、専用トレーディングチャットへの個人的な招待を受ける FXトレンド は、すべての時間枠のトレンド方向、期間、強度、その結果のトレンド評価をリアルタイムで表示します。 トレンドがどの方向に動いているか、どのくらい続いているか、どのくらい強力かが一目瞭然です。 これらにより初心者、上級者およびプロのトレーダーにとって使いやすいトレンド取引システムとなって います 。 分析機能 全時間軸のリアルタイムトレンド分析 すべてのタイムフレームで同一の計算結果 時間枠を個別に設定することが可能 トレンドの計算パラメータをカスタマイズ可能 グラフィック機能 コンパクトモード、詳細モード、ダッシュボードモードをワンクリックで切り替え可能 コンパクトモードでは、基本的なトレンド情報を縮小パネルで表示します。 詳細モードでは、基礎となるシンボルの詳細なトレンド分析が可能です。 ダッシュボードモードは、すべてのメジャー銘柄やお気に入りの取引銘柄をカバーします。 パネル内でワンクリックするだけで、すべての時間枠
常に利益を上げる5つ星FXトレーダーになりたいですか? 1. シンプルな取引   システムと   2020年のメジャーストラテジーアップデートの   基本説明を読む 2.   購入時のスクリーンショットを送信して、専用取引チャットへの個人的な招待を受ける このトレードマネージャーは 、 全自動取引管理を使用したいすべての FXトレンド ユーザーにとって理想的な追加機能です。 手動で開いた取引を直ちに検出し、FXトレンドのトレンドラインに沿って自動的にストップを管理 します。 お客様のトレードは、トレードマネージャーのプロパティで設定された固定計算設定に基づいて管理されています。 適切なEAマジックナンバーを設定することで、これらのEA注文をあなたの個人的なトレンド取引スタイルに従って管理することができます。 有効な注文の自動検出 イニシャルストップの自動設定 トレーリングストップの自動化 Expert Advisorsの注文の自動検出 アクティブなExpert Advisor注文の自動管理 カウンタートレンドのトレードのためのセキュリティ・ストップロス ブレークイーブン・ストッ
Visit our all-new   Stein Investments Welcome Page   to get the latest information, updates and trading strategies. Do you want to become a constantly profitable 5-star forex trader? Then  get our Stein Investments trading tools  and send us a screenshot to get your personal invitation to our exclusive trading chat with 500+ members. Crosshair is a fantastic tool that simplifies our chart analysis by bringing the price candles perfectly in line with the indicator values in the subwindows. Yo
FX Trend
Daniel Stein
4.8 (96)
常に利益を出し続ける5つ星FXトレーダーになりたいですか? 購入時のスクリーンショットを送信して、専用トレーディングチャットへの個人的な招待を受ける FXトレンド は、すべての時間枠のトレンド方向、期間、強度、その結果のトレンド評価をリアルタイムで表示します。 トレンドがどの方向に動いているか、どのくらい続いているか、どのくらい強力かが一目瞭然です。 これらにより初心者、上級者およびプロのトレーダーにとって使いやすいトレンド取引システムとなって います 。 分析機能 全時間軸のリアルタイムトレンド分析 すべてのタイムフレームで同一の計算結果 時間枠を個別に設定することが可能 トレンドの計算パラメータをカスタマイズ可能 グラフィック機能 コンパクトモード、詳細モード、ダッシュボードモードをワンクリックで切り替え可能 コンパクトモードでは、基本的なトレンド情報を縮小パネルで表示します。 詳細モードでは、基礎となるシンボルの詳細なトレンド分析が可能です。 ダッシュボードモードは、すべてのメジャー銘柄やお気に入りの取引銘柄をカバーします。 パネル内でワンクリックするだけで、すべての時間枠
常に利益を上げる5つ星FXトレーダーになりたいですか? 1. シンプルな取引 システムと 2020年のメジャーストラテジーアップデートの 基本説明を読む 2. 購入時のスクリーンショットを送信して、専用取引チャットへの個人的な招待を受ける このトレードマネージャーは 、 全自動取引管理を使用したいすべての FXトレンド ユーザーにとって理想的な追加機能です。 手動で開いた取引を直ちに検出し、FXトレンドのトレンドラインに沿って自動的にストップを管理 します。 お客様のトレードは、トレードマネージャーのプロパティで設定された固定計算設定に基づいて管理されています。 適切なEAマジックナンバーを設定することで、これらのEA注文をあなたの個人的なトレンド取引スタイルに従って管理することができます。 有効な注文の自動検出 イニシャルストップの自動設定 トレーリングストップの自動化 Expert Advisorsの注文の自動検出 アクティブなExpert Advisor注文の自動管理 カウンタートレンドのトレードのためのセキュリティ・ストップロス ブレークイーブン・ストップロスの使用可
Taurusでトレーディングの一貫性と自信を引き出す タウラスは、当社独自の実際の取引量データを活用した、平均回帰取引における革新と洗練の最高峰です。リスクとリターンの卓越したバランスを実現するよう設計されたタウラスは、正確かつ慎重に取引を処理しながら、ストレスのない取引体験をお約束します。 タウラスを選ぶ理由 高度な平均回帰戦略 :独自の実数値データを基に構築されたタウラスは、比類のない精度で高確率の機会を特定します。 ストレスフリーのリスク管理 :グリッド、マーチンゲール、リスクの高い平均化手法は一切使用しません。 28のFXペアにわたる精度 :最高のパフォーマンスを実現するために最適化されたシンボル固有の設定を使用して、すべての主要シンボルを取引します。 固定SLでシンボルごとに1トレード :各トレードには事前に定義されたストップロスが含まれ、規律あるリスク管理を保証します。 カスタマイズ可能なリスク :トレードごとのリスクは完全に調整可能で、あらゆるトレーダーのスタイルとリスク許容度に適しています。 コンプライアンス対応 :100%FIFOに対応し、機関投資家の基準を満た
Visit our all-new   Stein Investments Welcome Page   to get the latest information, updates and trading strategies. Do you want to become a constantly profitable 5-star forex trader? Then  get our Stein Investments trading tools  and send us a screenshot to get your personal invitation to our exclusive trading chat with 500+ members. Crosshair is a fantastic tool that simplifies our chart analysis by bringing the price candles perfectly in line with the indicator values in the subwindows. You
SI Connectは、FX VolumeやSIEAの取引システムを利用するために、当社のサーバーへの接続を確立するユーティリティです。 SI Connectを使用するために端末を準備する技術的な手順 Web リクエストを許可し、[ Terminal Options ] -> [Subcategory Expert Advisors ] で許可された URL のリストに https://stein.investments を挿入してください。 ターミナルごとに1つのEAインスタンスを実行する必要がありますが、当社のデータセンターから最新のデータを取得するため、バックグラウンドで常に実行する必要があります。 ご質問がある場合は、プライベートメッセージを送信してください。
FREE
FX取引で成功するための鍵は、規律、忍耐力、そして私たちが独自に開発したリアルな取引量分析のような明確なエッジです。 これは私たちの10年間のFX取引の経験であり、これらの重要な要素はすべてStein Investments Expert Advisor(SIEA)シリーズにまとめられています。 SIEA ZEN は、非常にバランスのとれたリスク・リターン比を提供し、すべての市場の状況を容易に生き抜くことができます-コロナ、ブレグジットなどの最も重大なものでさえも。 このシステムの堅牢性は、素晴らしいパフォーマンスに加えて、ユーザーにとってより重要な「安心感」をもたらします。それが、私たちが「ZEN」と呼ぶ理由です。 MT4では、ストラテジーテスターでマルチシンボルのストラテジーを実行することができません。現実的なリアルティックのマルチシンボルのバックテストを実行するには、 SIEA MT5 バージョンの使用をお勧めします。 FAQ(よくある質問)、バックテストレポート、正しいDST/GMT設定のためのヒントなどの詳細情報は、 SIEA FAQ をご覧ください。 トレーデ
SIEA PRO NGのパワーを解き放て:スマートな次世代トレーディングEA SIEA PRO NGは単なるアップグレードではありません。最先端のテクノロジーを駆使して開発され、5年間にわたる独自の実数値データに裏打ちされたSIEA PRO NGは、これまで以上に賢く、速く、効果的なトレードを支援するように設計されています。経験豊富なトレーダーの方でも、自動売買システムに慣れていない方でも、このEAは信頼できる精度とパフォーマンスを提供します。 SIEA PRO NGを選ぶ理由 実証済みの平均回帰戦略 :長年の市場データに裏打ちされた最良の機会のみを取引。 リアルボリュームインサイトに基づく 比類なき精度を実現する5年間のユニークなリアルボリュームデータを搭載。 リスク管理 :すべての取引には固定ストップロスとテイクプロフィットが含まれており、規律正しく計算されたリスクを保証します。 効率的な取引 :平均取引時間は48時間未満で、アクティブなトレーダーに最適です。 危険な戦略なし :グリッドもマーチンゲールもありません。 高度なカスタマイズ性 :専門家によるバランスの取れたデフォ
SIEA Zen
Daniel Stein
4 (4)
FX取引で成功するための鍵は、規律、忍耐力、そして私たちが独自に開発したリアルな取引量分析のような明確なエッジです。 これは私たちの10年間のFX取引の経験であり、これらの重要な要素はすべてStein Investments Expert Advisor(SIEA)シリーズにまとめられています。 SIEA ZENは、非常にバランスのとれたリスク・リターン比を提供し、すべての市場の状況を容易に生き抜くことができます-コロナ、ブレグジットなどの最も重大なものでさえも。 このシステムの堅牢性は、素晴らしいパフォーマンスに加えて、ユーザーにとってより重要な「安心感」をもたらします。それが、私たちが「ZEN」と呼ぶ理由です。 FAQ(よくある質問)、バックテストレポート、正しいサマータイム設定のためのヒントなど、より詳しい情報は SIEA FAQ をご覧ください。 トレーディングスタイル SIEA ZENは、USD、CAD、EUR、CHF、GBP、AUD、NZD、JPYの8つの主要通貨をベースとした28の取引ペアすべてを取引します。 当社独自の出来高分析により、市場の不均衡とその度合い
SIEA PRO NGのパワーを解き放て:スマートな次世代トレーディングEA SIEA PRO NGは単なるアップグレードではありません。最先端のテクノロジーを駆使して開発され、5年間にわたる独自の実数値データに裏打ちされたSIEA PRO NGは、これまで以上に賢く、速く、効果的なトレードを支援するように設計されています。経験豊富なトレーダーの方でも、自動売買システムに慣れていない方でも、このEAは信頼できる精度とパフォーマンスを提供します。 SIEA PRO NGを選ぶ理由 実証済みの平均回帰戦略 :長年の市場データに裏打ちされた最良の機会のみを取引。 リアルボリュームインサイトに基づく 比類なき精度を実現する5年間のユニークなリアルボリュームデータを搭載。 リスク管理 :すべての取引には固定ストップロスとテイクプロフィットが含まれており、規律正しく計算されたリスクを保証します。 効率的な取引 :平均取引時間は48時間未満で、アクティブなトレーダーに最適です。 危険な戦略なし :グリッドもマーチンゲールもありません。 高度なカスタマイズ性 :専門家によるバランスの取れたデフォ
フィルタ:
Casio
70
Casio 2025.01.28 09:59 
 

ユーザーは評価に対して何もコメントを残しませんでした

Ukwezi
210
Ukwezi 2025.01.24 07:05 
 

Excellent product, 5 stars no doubt. Really helps me in my strategy and extremely helpful in finding out where “things are happening” in the FX market. Thank you Daniel!

Daniel Stein
99370
開発者からの返信 Daniel Stein 2025.01.24 11:34
Hi Ukwezi, Thank you so much for your fantastic review and kind words! I’m thrilled to hear that the product is helping you with your strategy and making a difference in identifying market opportunities. Your support means a lot to me—thank you! 🙏🙂
Kabelo
86
Kabelo 2024.07.10 18:12 
 

When applied correctly, FX volume is almost 100% accurate in terms of direction. Adding a solid entry strategy has significantly improved my trading win rate. I'm pleased to have found a reliable trading indicator after testing and using over 1,000 repainting, recalculating, and unreliable indicators. Please, Daniel, keep up the excellent work and product.

Daniel Stein
99370
開発者からの返信 Daniel Stein 2024.07.10 21:51
Dear Kabelo, thank you so much for this wonderful feedback. It's highly appreciated. 🙏🙂
Ingo Reimann
280
Ingo Reimann 2023.12.21 16:13 
 

The best and most precise product that I have had the pleasure of getting to know in my trading career. I can recommend it to everybody. Since I started using these products, trading has also been working. The support from the developers and the community are also in a class of their own.

Daniel Stein
99370
開発者からの返信 Daniel Stein 2023.12.21 16:27
Dear Ingo, thank you very much for your outstanding feedback. It's highly appreciated, and we're more than happy having members like you in our trading group. 🙂
Tim Eubanks
5763
Tim Eubanks 2023.08.31 02:51 
 

Very ineffective tool!

Daniel Stein
99370
開発者からの返信 Daniel Stein 2023.08.31 07:31
And for me, it's the most efficient tool because it tells me exactly when it's worth looking at the market.
If you like to know how I use FX Volume for my daily manual trading, I suggest taking a look at my Volume Power description at https://www.mql5.com/en/blogs/post/753806 You can also subscribe to our Morning Briefing channel to get daily updates, details and screenshots at https://www.mql5.com/en/channels/morningbriefing
Both help to get a better understanding of how to work with FX Volume.
Juan Chacon
1285
Juan Chacon 2022.11.16 21:16 
 

I bought it twice and it was a waste of time and money, please do not spend your money, my advice is to use stop loss and exceed the profit ratio.

Daniel Stein
99370
開発者からの返信 Daniel Stein 2023.08.25 19:41
Dear Juan, I don't understand how Volume is related to using a stop loss. And why did you never raise any questions about how to use this kind of real-market data? I recommend taking a look at my Volume Power description at https://www.mql5.com/en/blogs/post/753806 which explains in all details how I use FX Volume for trading. You can also subscribe to our Morning Briefing channel to get daily updates, details and screenshots at https://www.mql5.com/en/channels/morningbriefing And finally, we do have FX Volume info channel on Telegram at https://t.me/SI_FX_Volume to understand in-depth what FX Volume is about
3316589p
870
3316589p 2022.08.29 20:34 
 

Hi Daniel, Great indicator used in conjunction with Fx Power, an invite for the the chat group would be appreciated

Daniel Stein
99370
開発者からの返信 Daniel Stein 2022.08.29 20:54
Thanks a lot for your positive feedback. I sent you an invitation via private message. Best regards, Daniel
wuzzy66
945
wuzzy66 2022.07.02 09:41 
 

Another excellent product from Daniel who is the creator this indicator lets you make informed Decision ASAP when you know the volume of the trade is been concentrated on tried it on Gold excellent it showed be that there was more volume on the Dollar than Gold and took straight a sell position which paid off no more guess work with this indicator combing it other tools such as the FX power

Daniel Stein
99370
開発者からの返信 Daniel Stein 2022.07.02 18:18
Thanks a lot for your detailed review and excellent feedback. It's highly appreciated.👍
Carlos Alexandre Ribeiro Da Silva
396
 

Excellent indicator, I resubscribed it because it is not the entry trigger, but the "certainty" of the market direction. It brings you the peace of mind of following the big players. Not to mention the support of all Daniel's products. More than I recommend!!!

Daniel Stein
99370
開発者からの返信 Daniel Stein 2022.07.02 18:17
Thanks a lot for your wonderful review. 👍
Thomas Bradley Butler
31498
Thomas Bradley Butler 2022.03.29 19:50 
 

maybe long term but not for day trading. Long +6000 USD and -300 GBP with 62% long USD and 30% long GBP. Should sell GBP/USD but it does the opposite. Really just confusion. lost most of the trades with the volume

Daniel Stein
99370
開発者からの返信 Daniel Stein 2022.07.02 18:16
Hi Thomas, I recommend having a look at its info channel to get a better understanding of how to use FX Volume https://t.me/SI_FX_Volume
josedan
325
josedan 2022.01.31 15:52 
 

This is the best tool as far as am concerned.. As a trend trader, you need volume and all what I see in the market is tick volume.. Daniel was able to come up with this amazing tool and the tool has made me realize that what I was taught by NNFX about tick volume is garbage... So many people criticise the tool for being lagging but I differ... Fxvolume is not lagging, you have to find a way as per how to use it so as to fit it into your system... I am only pleading with him to include minute comparison because it is what I use in entering trade in time... Please Daniel include minute comparison. I contacted Daniel about including minute comparison which he earlier promised to include but he said the update does not gather enough momentum and directed me to use history lines... I do use history lines but it is stressful... Please include minute comparison in the tool for me.. Daniel and co.... have reached out to me as per the minute comparison... They have promised to look into it... I must commend them for excellent customer service delivery.. Daniel has been so helpful in helping me as per answering my questions.. Yes, the requested feature is there in the updated version... I do really like it

Daniel Stein
99370
開発者からの返信 Daniel Stein 2022.04.01 14:36
Dear Jose, the requested feature has been released with version 4.0. We're sure you'll like it.
victor9090
637
victor9090 2021.12.09 23:10 
 

Simplemente voy a decir una palabra: Gracias! He encontrado lo que siempre he querido. Simplemente maravilloso trabajo y lo seguiré pagando por muchos años mas.

MILAD ORANGI
117
MILAD ORANGI 2021.12.09 21:42 
 

Unfortunately, the support was not as good as I thought and will not be updated

Daniel Stein
99370
開発者からの返信 Daniel Stein 2021.12.24 12:42
Dear Milad, you can't request a new feature and expect to get it immediately. Of course, we improve and update our tools regularly, but we follow our schedule, not yours.
motsusi
170
motsusi 2021.08.12 01:46 
 

Fx Pqwer assisted me great deal with my trading but is limited to currencies. As I ventured into gold, I realised there was a huge gap left by absence of Fx Power. I reluctantly purchased Fx Volume as it covers gold. That has been one of my best ever decisions in trading this year. Fx Vlolume coupled with Fx Trend is indeed a masterpiece. Than you Daniel for this 35th century innovation.

Zachary David Cox
928
Zachary David Cox 2021.04.12 14:10 
 

Very helpful and well done indicator. Thanks

cicas65
221
cicas65 2021.03.10 10:35 
 

Un'unica parola per descrivere l'estro di Daniel: Stupefacente! Tutti i prodotti di altissimo livello. Complimenti Daniel sei un grande! One word to describe Daniel's inspiration: Amazing! All products of the highest level. Congratulations Daniel you are great!

safariforex
136
safariforex 2021.03.08 22:50 
 

If you are reading this message, congratulation, you finally made it. Welcome to the winning team. And no it's not a sale pitch, just showing my appreciation for the author and his amazing indicator.

Arnel Arnao
2140
Arnel Arnao 2021.03.04 07:21 
 

First Thank you for sharing this indicator. Its Highly Recommended Indicator. Worth every penny. I recover the rental fee in just 1 day of trading. The Customer service is excellent. I just have 1 wish and I hope Stein will look into it that will make this more powerful. I wish Stein will provide an option for showing volume data in a single panel instead of switching back in forth in the options. I want to see Ratio,Change, Long/Short/total volume at one glance. Sometimes I missed some important information because I did not check it. Overall 6 stars for this excellent indicator.

Daniel Stein
99370
開発者からの返信 Daniel Stein 2021.03.04 08:46
Hi Arnel, first of all, thanks for your positive feedback. We're happy you enjoy using FX Volume. A combined view of all information is already on our todo list, but you can also combine several FX Volume instances in one chart to get all the information you need. Here's the corresponding post of our FX Volume info channel https://t.me/SI_FX_Volume/57. In case of questions drop a line and I'll assist. All the best, Daniel
LUDY LAMBARA
1360
LUDY LAMBARA 2021.01.13 08:37 
 

this is the best trading tool ever shared to public.... and the support was very quick.... 5star

Sandy Wahyudi
584
Sandy Wahyudi 2020.12.04 16:39 
 

Amazing all tools from Daniel. I have already use all tools..trend, power, lighthouse, volume, and power play. Just follow STS and forget it. All my trade like the games. Good suuport too from Daniel. Thanks.

12
レビューに返信
バージョン 4.85 2025.01.23
Enhancements:

- Updated to the latest framework for improved performance and compatibility.
- Introduced Net Long Delta Plot Customization to give you more control over how you visualize delta data.

Fixes:

- Resolved an issue causing loss of saved settings on the chart.
- Fixed input inconsistencies to streamline configuration.
- Corrected the Delta History Line Calculation to enhance the accuracy of displayed data.
- Addressed an issue in FXVSymbolsView.mqh (line 146) to improve functionality.
バージョン 4.82 2024.10.16
Fixed alerts that were incorrectly turned off.
バージョン 4.81 2024.10.15
Fixed and improved GUI responsiveness on MT4
バージョン 4.79 2024.10.14
Fixed a recently introduced iCustom bug that caused a "cannot set timer" error.
バージョン 4.78 2024.09.28
FX Volume 4.78 contains the following changes:

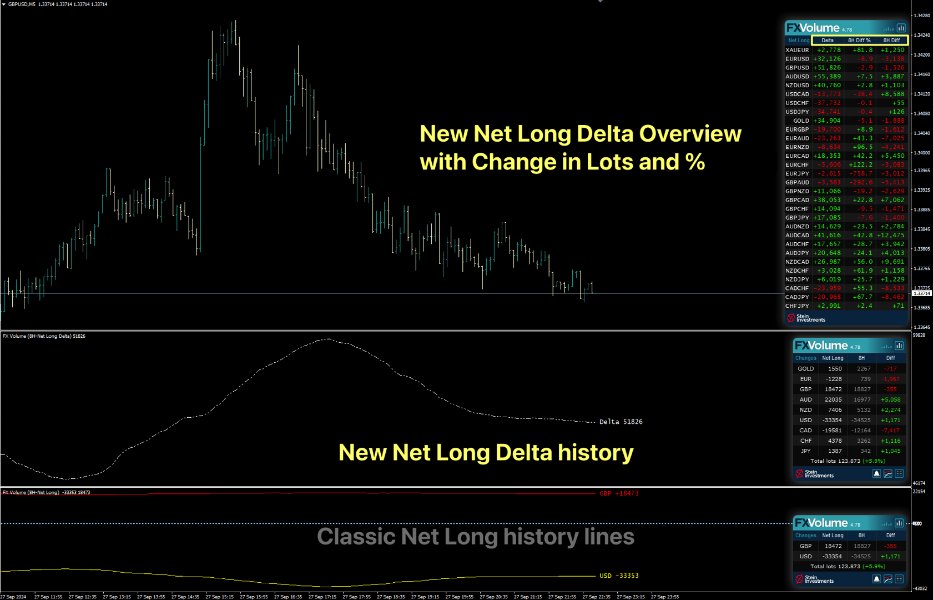
All views have been reconstructed using the updated SI framework. The Net Long Delta History Mode has been introduced as new History Line Mode.

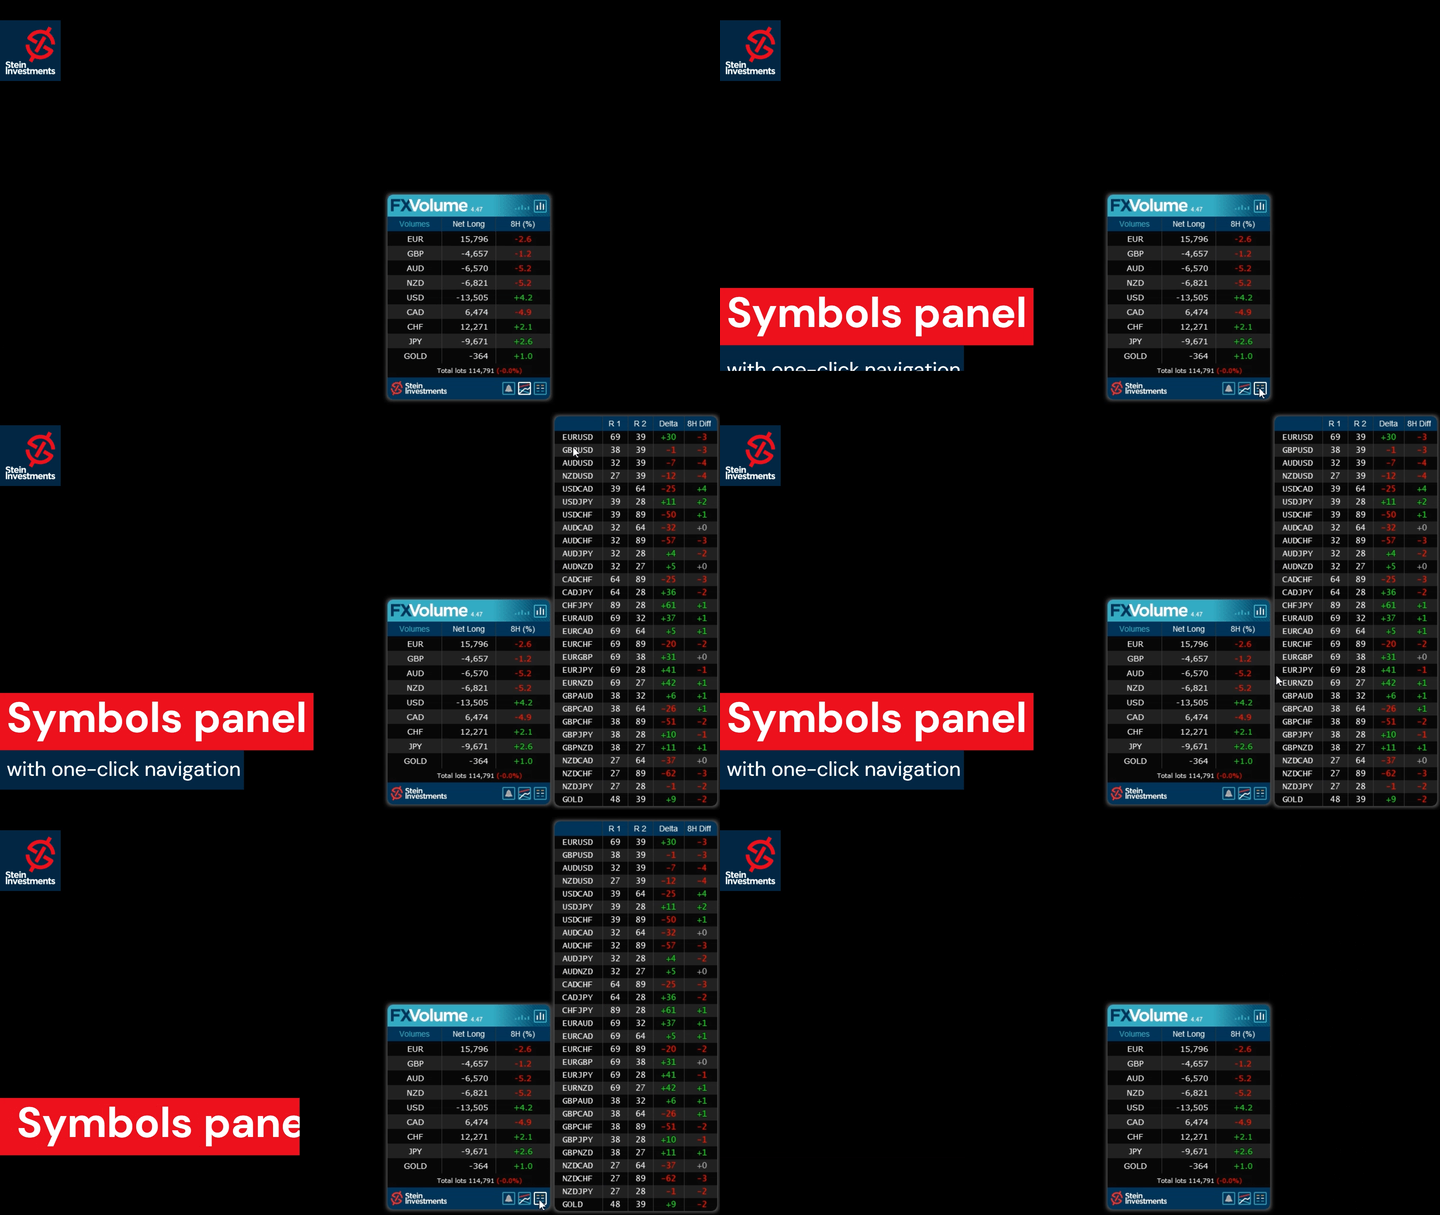
The Net Long Delta Overview has been added as an alternative view in the Symbol List panel, and has been established as the default view for the symbol list when any of the three Net Long options is chosen in the properties.

Gold has been set to display by default.

Additionally, saved settings will now be cleared when a chart is closed.
バージョン 4.68 2024.07.12
New Features:
- Alert Scheduler: Now you can customize the timing for indicator signals to fit your daily routine without being disturbed when you're busy.

Bug Fixes:
- Fixed occasional loss of history line colours, width, and style.
- Removed "Gold" plot visibility when not used by settings.

Improvements:
- Enhanced data reliability in extreme cases.
- Improved processing for "full" updates.
バージョン 4.55 2023.08.30
Fixed bug when symbols alert enabled
バージョン 4.54 2023.08.07
Fixed color change bug on history line labels
バージョン 4.53 2023.08.01
Added INSTANCE_ID input parameter

Fixed GOLD bug, shifting all currencies data
バージョン 4.52 2023.07.31
Fixed iCustom call, sometimes displaying the panel

Added Gold input parameters, and updated to use last framework changes
バージョン 4.51 2023.07.27
Fixed alert input parameter labels
バージョン 4.50 2023.07.26
Fixed invalid pointer, framework bug when no history lines are displayed

Fixed bug in loading FXV parameters
バージョン 4.49 2023.07.25
Fixed MT4 strategy tester issue of missing history line colors
バージョン 4.48 2023.07.24
Fixed minor bugs

Added an alert button in the panel

Alerts are now individually configurable according to currencies selected

Update with last framework and generic changes

Changed input parameters (without effect on iCustom requests)

Changed currency sorting in the panel following a logical convention for symbol names
バージョン 4.42 2023.06.01
Fixed GUI DPI adjustment bug
バージョン 4.41 2023.06.01
⚠️Due to necessary changes in our panel management, you have to reconfigure your charts once after the update⚠️

New Features
Added history mode "Net Long % change"
Added new main panel view "Net long % change"
Added alerts for "Net long % change" drop & rise

Changed indicator label on chart to display one decimal at % values
Changed indicator digits according to history mode
Changed the zoom factor to use % values
Symbols list refactoring as a new panel


Graphics
New rounded corner panel design.
Added a different color for the "Past" data column.
Added input for panel back color if the auto-scheme is disabled
Improved plot labels display to avoid overlapping. (MT5 only)


Under the hood
Apply complete internal refactoring
Apply the last framework update
バージョン 4.10 2022.03.08
Fixed resource loading issue on some Mac/Linux systems

Fixed graphical panel bug when missing past data
バージョン 4.0 2022.03.02
FX Volume 4.0 comes with two additional features.

1. The option to use the internal comparison calculation on a minute basis which allows comparison below our previous minimum of 1 hour.

2. Inspired by our fellow trader Luke, we created a Net Long Volume view including history lines to understand better how the Net Long volume correlates with the market moves we see on the chart.

Check our Stein Investments YouTube channel to see a video of the new features.

We're sure you'll like the new features.
バージョン 3.58 2021.09.01
Optimized FX Volume to be fully compatible with MT4/MT5 templates
バージョン 3.53 2021.05.08
Transition version to use data in common data folder

Fixed bug with GMT when running FX Volume on a weekend for the first time

Optimizations when used as free demo version in the strategy tester

バージョン 3.50 2021.04.08
Fixed minor bug when alerts are enabled
バージョン 3.49 2021.04.01
This update contains the following changes:

- New Alert options based on Long and Short Volume
- New Alert filters based on the dominance of one side available,
i.e. if Volume Long is bigger than Volume Short, you'll get only alerts for the Volume Long side
- Improved communication with the new SI Connect 2.x
- Optimized settings managements

and these changes are related to the strategy tester usage

- Fixed current candle update bug
- Added parameter to start with a focus on chart currencies
- Improved backtesting performance
バージョン 3.35 2021.03.11
Fixed M1 issue when used in the strategy tester
バージョン 3.34 2021.03.10
Fixed row labels in Changes view
バージョン 3.33 2021.03.10
Internal refactoring
Changed SI Connect detection method
Improved performance when used in the strategy tester
バージョン 3.28 2021.02.26
FX Volume GUI enabled in Strategy Tester visual mode when called via iCustom
バージョン 3.27 2021.02.26
Besides various minor fixes and improvements we made a few specific improvements when using FX Volume inside an EA and in the strategy tester like:

- Improve behaviour when called from iCustom
- Improved data processing (all modes)
- Fix minor display bugs while using the visual mode
- Disabled alerts in tester mode
バージョン 3.25 2021.02.22
Optimized SI Connect EA detection in case of heavy usage (more than 20 instances)
バージョン 3.24 2021.02.17
Fix symbols list display (top of the list possibly hidden)
バージョン 3.23 2021.02.17
With this update, it's finally possible to combine different views AND comparison periods in just one chart.

In this way, you'll easily see if the short term volume is still dynamic and supporting the volume change of a higher period.
This offers an entirely new grade of precision because you now see exactly when to enter when to exit and if it's still worth to hold the position.

We hope you'll enjoy the new flexibility provided by FX Volume.
バージョン 3.18 2021.02.10
Fixed bug resulting in orphan objects on the chart

Fixed bug of line style changes when using several instances
バージョン 3.17 2021.02.04
This release is another huge step forward and provides the following new features.

- Additional colouration for the positive and negative percentage values

- History lines for Volume Total, Volume Long and Volume short are now available

- All history lines can be hidden completely via parameters in the indicator properties

- Use multiple instances of FX Volume in one chart to create individual comparison views.
Note: Every instance has to use a different "History lines and buffers" mode to manage all instances correctly.

- Volume Total, Volume Long and Volume Short are now available in the indicator buffers

IMPORTANT: Please note that the history lines and the panel information is managed independently!
If you switch to a different panel view, this does NOT change the volume history lines. You have to change them in the indicator properties.

Please note also that the value labels of the history lines differ from the information seen in the panel because the panel displays always the latest available information while the history line buffer provides an OHLC volume data average for the entire candle. Please visit our FX Volume info channel at https://t.me/SI_FX_Volume to get more detailed information
バージョン 3.1 2021.02.01
Renamed view labels for a better usability
バージョン 3.0 2021.02.01
This major update provides a deeper insight into the real trading market sentiment

Now you can see the total volume of the long and short side separately as well as how it changed during the selected comparison period. With this information, you can easily spot on which side of the market there is an upcoming dynamic in the real trading volume.

And because we are often asked for it we added all this information for GOLD as well.

Enjoy the new amazing features of FX Volume and leave a review if you like it.
バージョン 2.26 2020.12.21
Fixed minor bug occurring rarely at a terminal restart
バージョン 2.25 2020.12.18
Minor bug fixed causing an empty panel due to unchanged data

Added special section for the alert option in the indicator properties
バージョン 2.24 2020.12.16
The following new features have been added:

-Alert on long ratio rise/drop
-Alert on total volume rise/drop
-Alert on delta increase/decrease

We hope you'll enjoy the new alert options.
バージョン 2.22 2020.12.02
Disabled DEBUG mode
バージョン 2.21 2020.11.23
Fixed empty panel bug
バージョン 2.20 2020.09.18
Changed Delta calculation display to provide more accurate results

Added total volume buffer -> ask for the updated code snippets

FX Volume is now ready to be used in the MT4 strategy tester!

Please note that you have to copy the FX Volume data file manually from \\MQL4\Files to \\tester\files\SI Lab in your terminal's data folder to be able to run backtests with FX Volume in your MT4 (an MT5 handles this task automatically)

バージョン 2.16 2020.06.24
The panel uses current and raw data only. OHLC is used only for history lines.

Fixed bug in panel update when data are not directly available.

Added an alert for insufficient Terminal "Max bars" settings.
バージョン 2.0 2020.06.20
Dear customers, please welcome our fantastic FX Volume 2.0. We spent weeks of work designing this beautiful panel, adding excellent features, and providing more detailed information to offer you outstanding user experience and a real edge in trading.

To benefit from all improvements it is necessary that you update FX Volume and SI Connect to the latest available version!
バージョン 1.26 2020.05.14
Fixed bug in detecting the SI Connect EA
バージョン 1.25 2020.05.14
Use updated libraries
バージョン 1.24 2020.03.09
Added security to avoid alert flooding

Fixed bug which checks and sends alert continuously if the data file can't be opened
バージョン 1.23 2020.03.08
Improved backward compatibility
バージョン 1.19 2020.03.08
Improved EA detection -> switch to SI Connect
バージョン 1.15 2020.03.04
Fixed bug chart changing to EURUSD when clicking above "Changes/Ratios" label

Added the possibility to set your individual color and line style via the Colors tab at the indicator properties
バージョン 1.13 2020.03.02
Fixed GMT Offset