I Permanent
- インディケータ
- Vladimir Gorbachev
- バージョン: 3.1
- アップデート済み: 29 11月 2021
- アクティベーション: 20
Universal adaptable indicator.
It determines the estimated trading range for the current day based on the available history a real data, and displays the area of the probable price rollback on the chart. All this thanks to the built-in algorithm that automatically adapts to any behavior models of the market quotes. With the parameters adjusted, the indicator shows its effectiveness on most of the currency pairs, that have a rollback from the reached extremums during the current or the next trading days. Among these instruments are cross-rates and some major pairs in particular.
Features
- Does not redraw.
- No excessive parameters.
Settings
- DAY_range - the average value of the effective trading range for the specific pair;
- Period_N - the number of days for collecting data;
- Bars_to_draw - the number of bars in addition to Period_N;
- Line_width - line width;
- Color_line_up - color of the HIGH lines;
- Color_line_down - color of the LOW lines;
- Color_rec_up - the color of the filled area above the HIGH line;
- Color_rec_down - the color of the filled area below the LOW line;
- Font_Size - font size;
- Font_color - font color for 'HI to LO';
- Font_ancor - the location of the information lines on the screen;
- ID – magic number;
It should be noted that each currency pair has its own specific behavior. Therefore the initial parameters are set for each pair. After that the indicator automatically adapts to the constantly changing market conditions.
You can download preset parameters for EURUSD, USDJPY, EURCHF, CHFJPY, GBPUSD, AUDUSD, EURAUD or select your own.
How to use the indicator
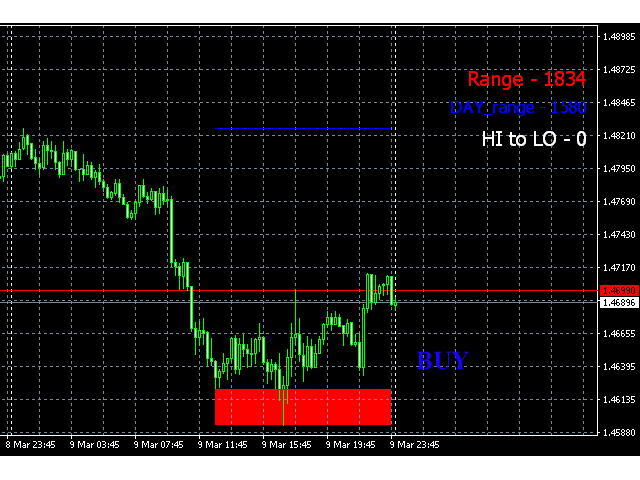
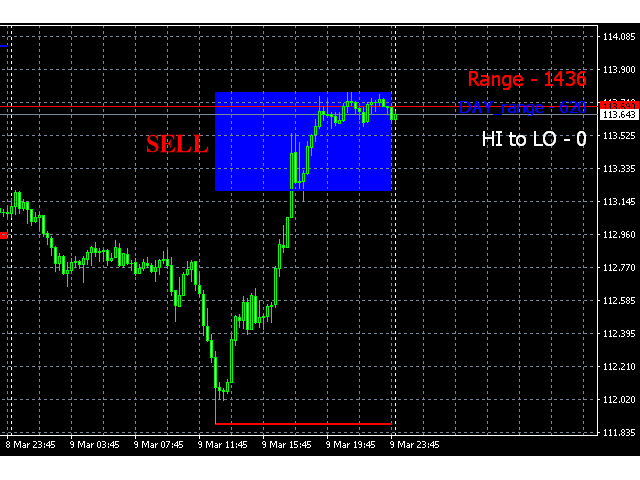
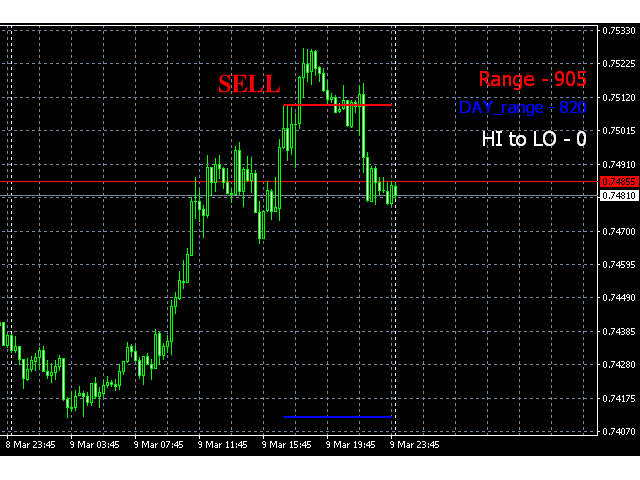
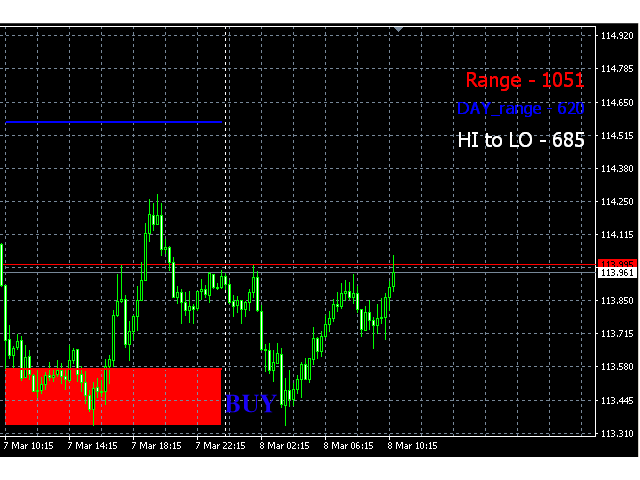
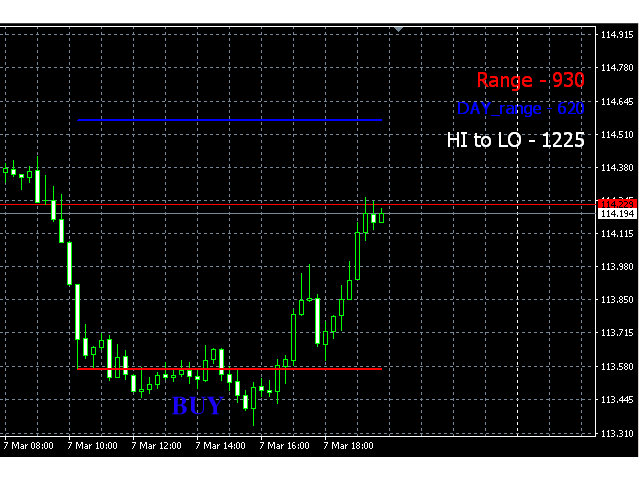
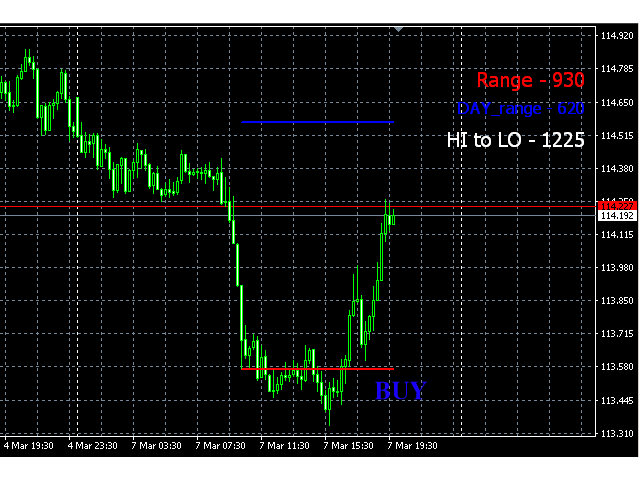
- Range - the estimated daily range;
- DAY_range - the average value of the effective trading range for the specific pair;
- HI to LO - the current amount of points between HIGH and LOW.
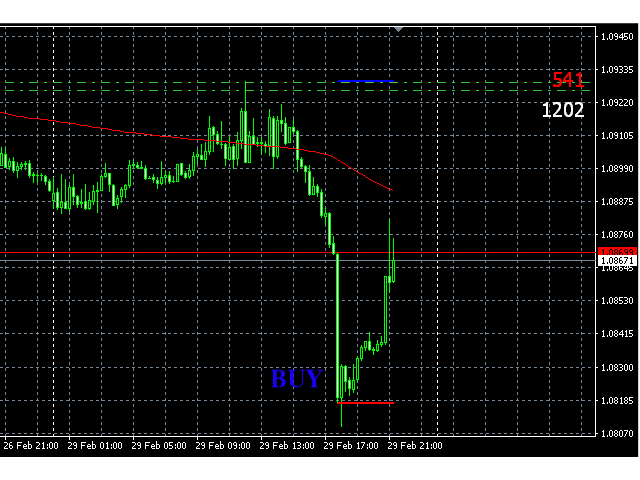
Attach to M15 chart. The indicator starts working as soon as it is attached to the chart and analyzes the incoming data in real time. Once the price reaches the boundary of the estimated daily range (Range) the indicator plots lines on the range boundaries and fills the area where the trades in the opposite direction can be made during the current and following days.
If the value of Range is less than DAY_range, it becomes a priority, and the lines on the chart are plotted based on the value of DAY_range.
If necessary, I can make additional setting for other pairs for those who purchased this indicator. And I can give more details on how to use it best to those interested in this kind of trading.
