VJ Pivot Levels
- インディケータ
- Vijayaratna Kumar Boda
- バージョン: 1.10
- アップデート済み: 4 4月 2020
- アクティベーション: 12
Introduction:
Whatever trading method you use, it is important to know the Pivot levels to take the key attention for your entries & exits. This indicator has been made using the standard classic formula for Auto drawing the Pivot levels. Also based on the previous day trading range, the probable expected today trading range has been highlighted in a different color for your reference.
Output of the Indicator:
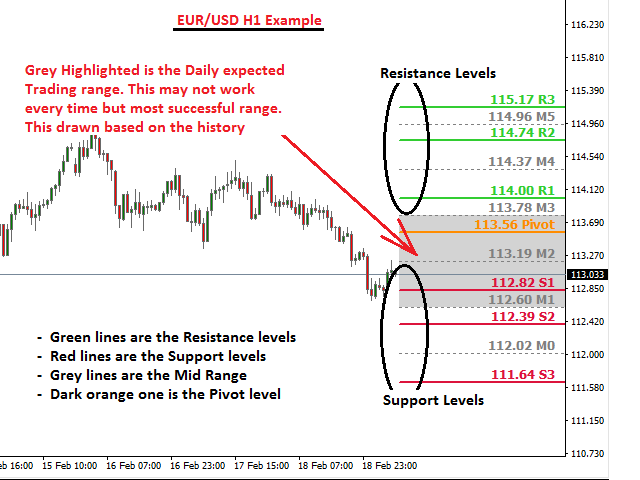
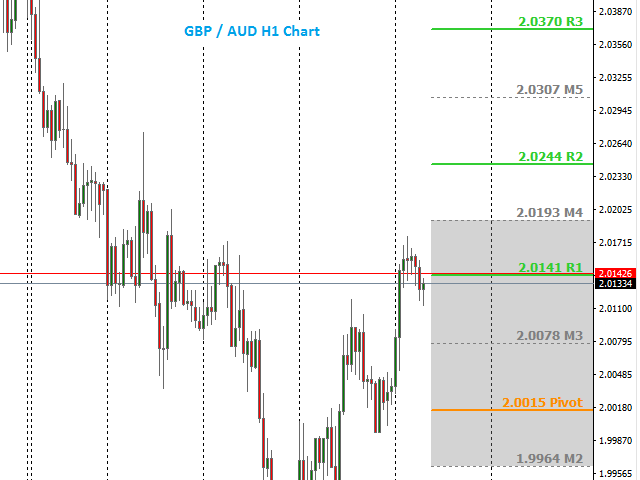
- This Indicator gives the Pivot level
- Different resistance Levels
- Different Support levels
- Mid ranges of the above levels
- Daily expected Trading range (Refresh the chart after the market Opens)
Coding Formula:
- Used the Classic Pivot levels formula
- Calculation is between two previous period separators of 00hrs ~ 00hrs
- Pivot = ( High + Close + Low ) / 3
- R1 = 2 * Pivot - Low - Normal Trading Range
- S1 = 2 * Pivot - High - For The Next Period
- R2 = Pivot + (Resistance1 - Support1) - Extreme Trading Range
- S2 = Pivot - (Resistance1 - Support1)
- R3 = High + 2*(Pivot - Low)
- S3 = Low - 2*(High - Pivot)
- M5 = (R2+R3)/2
- M4 = (R1+R2)/2
- M3 = (P+R1)/2
- M2 = (P+S1)/2
- M1 = (S1+S2)/2
- M0 = (S2+S3)/2
How to use:
- Check the Pivot level for Break-up direction
- Use the Support & resistance levels as entry / Exit / SL / TP
- Combine the other Price action methods for entry
- M0 / M1 / M2 / M3 / M4 / M5 ae mid ranges & safe zones for your trade Entry & Exit
- The grey highlighted range is the probable expected trading range for the current day. Check this after opening the market.
- Refresh the chart after opening the market everyday for loading the latest levels / Or switch the TF back & forth
Time Frames:
You can use it on any Time Frame but the best is M30 / H1 / H4 -- These 3 are best


It works. Great tool to see support and resistance levels.