PipsFactoryDailyDemo
- インディケータ
- Alfred Kamal
- バージョン: 3.0
- アップデート済み: 3 12月 2021
This is Demo Version of PipsFactoryDaily
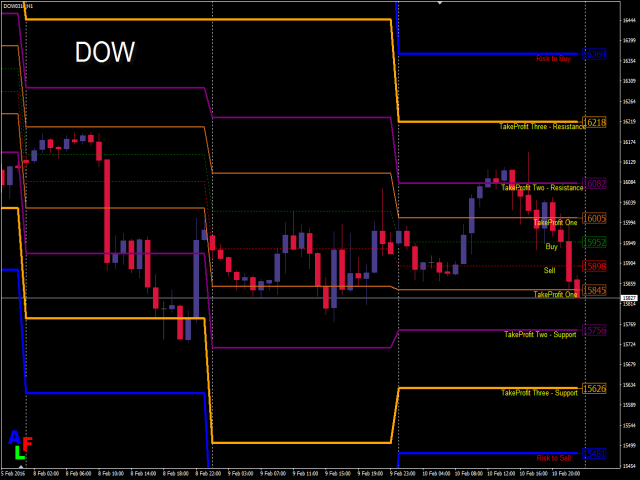
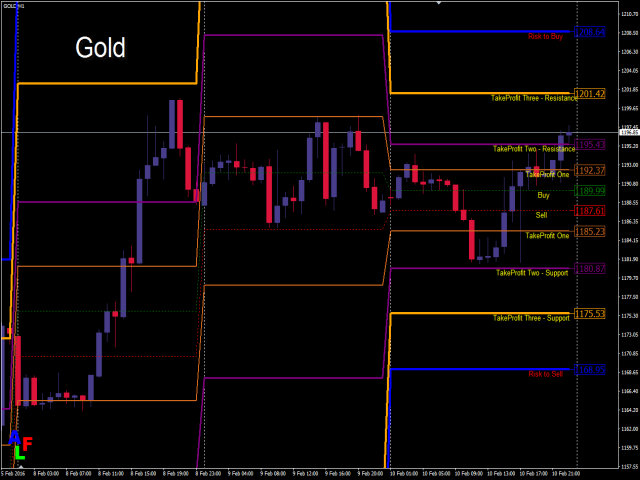
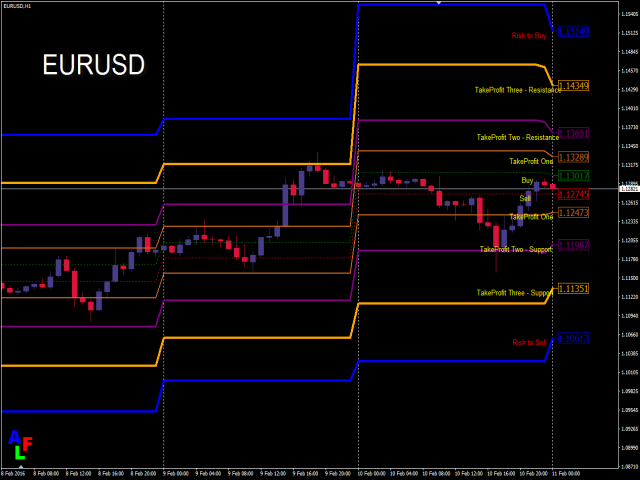
This indicator depends on High and Low price of currency in the last day, and then I made some secret equations to draw 10 lines.
Features
- You will know what exactly price you should enter the market.
- You will know when to be out of market.
- You will know what you should do in market:
- Buy
- Sell
- Take profit, and there are three levels to take your profit
- Support
- Resistance
- Risk to buy
- Risk to sell
Signal Types and Timeframes Used
- You can use this indicator just on (M1, M5, M15, M30, H1) timeframes and you have to download the historical data of D1 timeframe.
- Enter buy order in case the price is at buy line and there are three levels to take your profit:
- First level is take profit.
- Second level is take profit too but it is also Resistance.
- Third level is take profit too but it is also Resistance.
- The fourth line is Risk to enter market with buy order.
- Enter sell order in case price at sell line and there are three levels to take your profit:
- First level is take profit.
- Second level is take profit too but it is also Support
- Third level is take profit too but it is also Support.
- The fourth line is Risk to enter market with sell order.
- Currency: It works on NZD/USD because it is Demo Version but full version works on all currency pair
- It is very easy to use.


Would like to see more options...