Heatmap Scanner
- インディケータ
- Niravkumar Maganbhai Patel
- バージョン: 1.1
- アップデート済み: 7 1月 2020
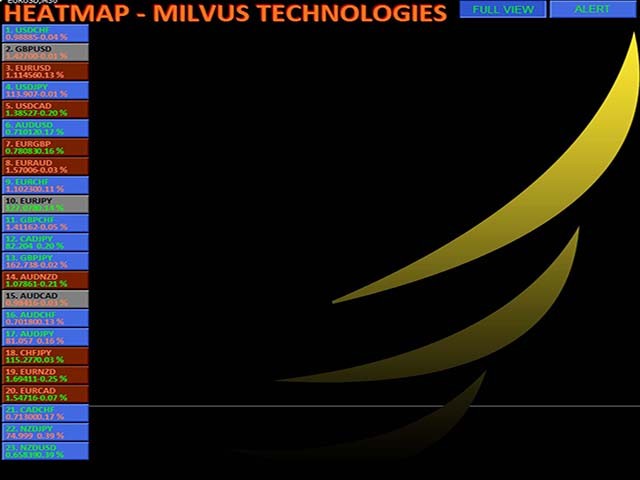
This indicator helps you to scan all symbols which are in the Market Watch window and filter out a trend with alerts.
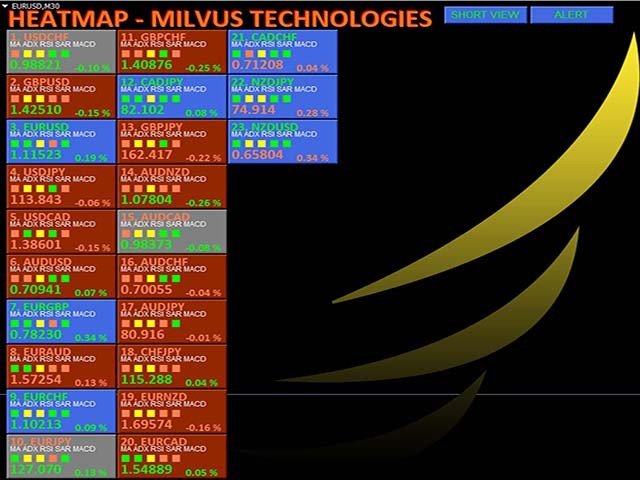
It works on five most effective indicators which are used by most of traders for trading:
- Moving Average
- Average Directional Moment (ADX)
- Relative Strength Index (RSI)
- Parabolic SAR
- MACD
It calculates two bars for scanning.
When box colour changes to coral or royal blue colour, it indicates you for trend change for long and short entry. And also you will get alert on screen. When it changes to royal blue, it indicates you that trend is going upwards, and you can take long entry. If the colour changes to coral, it indicates that trend is going downwards, and you can take a short entry.
You can apply it on any timeframe. For better result, go for M15 minutes to D1 timeframe.
This indicator allows you to set parameter for each indicator while you applying.
It scans symbols on that parameters by applying on single chart. It helps to filter out symbol for trading.
Also, it shows the current rates with percentage changes.
After applying this, you will find block on chart displaying symbol trend.
- Royal blue colour shows the trend is up for that symbol.
- Coral colour shows the trend is down for that symbol.
- Gray means a trend is consolidating.
To open particular symbol chart, you can click on Symbol Name, and the new chart will open.


Helpful, good indicator