PZ Day Trading
- インディケータ
- PZ TRADING SLU
- バージョン: 8.0
- アップデート済み: 17 7月 2024
- アクティベーション: 20
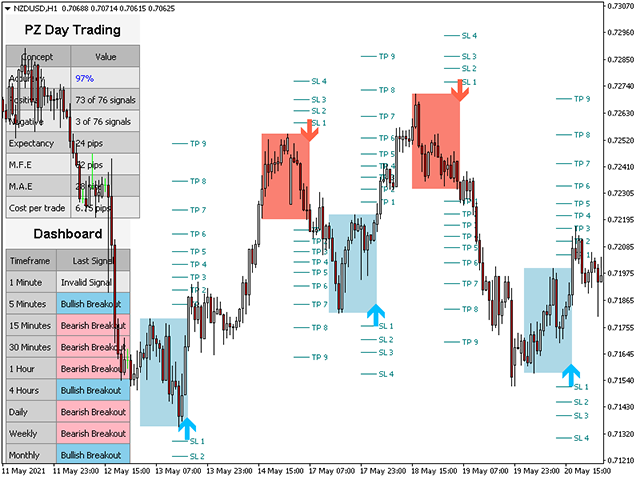
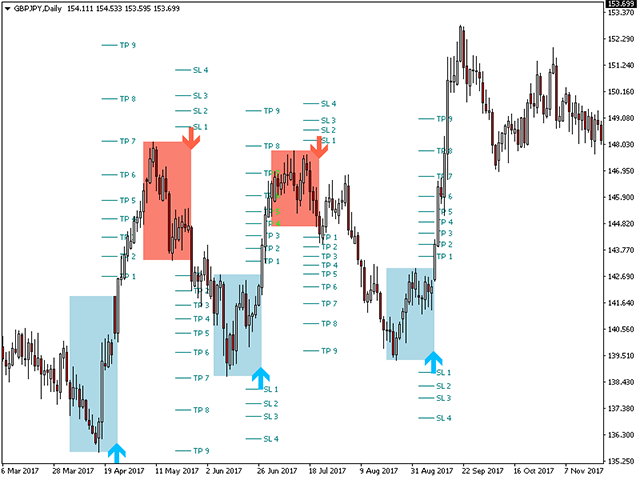
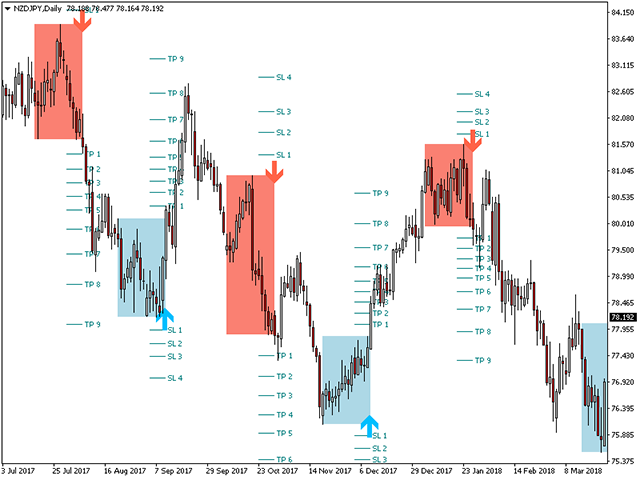
このインディケータは、価格アクション分析とドンチャンチャネルのみを使用して、ジグザグ方式で価格の反転を検出します。再描画やバックペインティングを一切行わずに、短期取引向けに特別に設計されています。それは彼らの操作のタイミングを増やすことを目指している賢明なトレーダーにとって素晴らしいツールです。
[ インストールガイド | 更新ガイド | トラブルシューティング | よくある質問 | すべての製品 ]
- 驚くほど簡単に取引できます
- すべての時間枠で価値を提供します
- 自己分析統計を実装します
- 電子メール/音声/視覚アラートを実装します
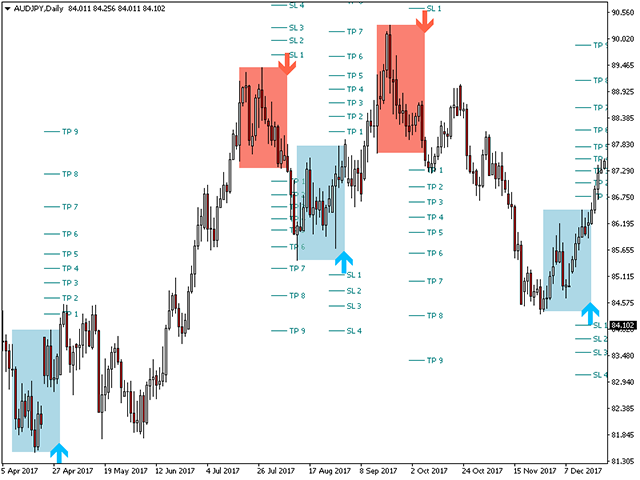
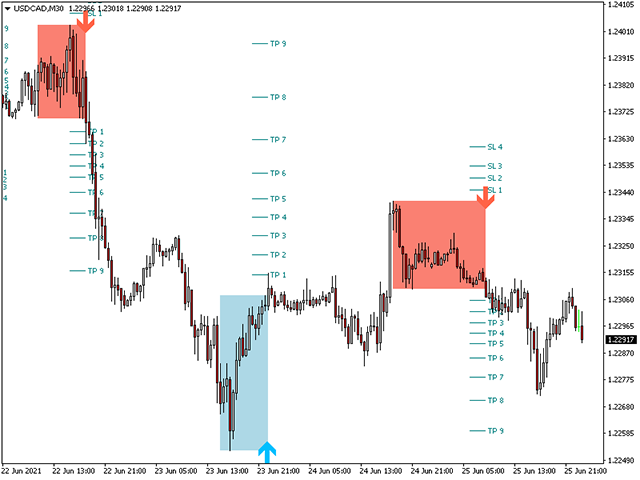
可変長のブレイクアウトと混雑ゾーンに基づいて、インディケータは価格アクションのみを使用して取引を選択し、市場が非常に高速に行っていることに反応します。
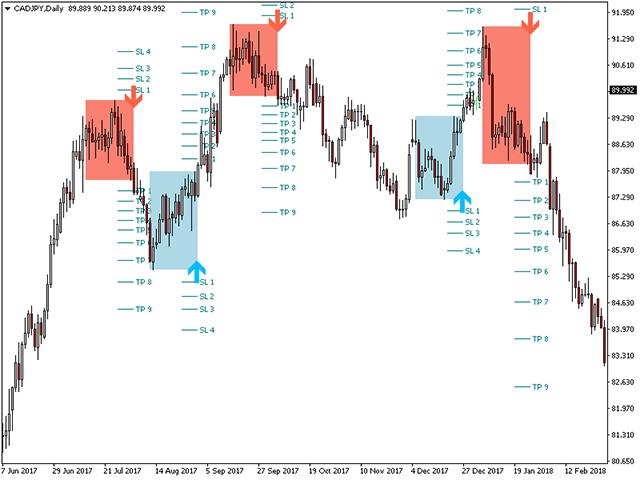
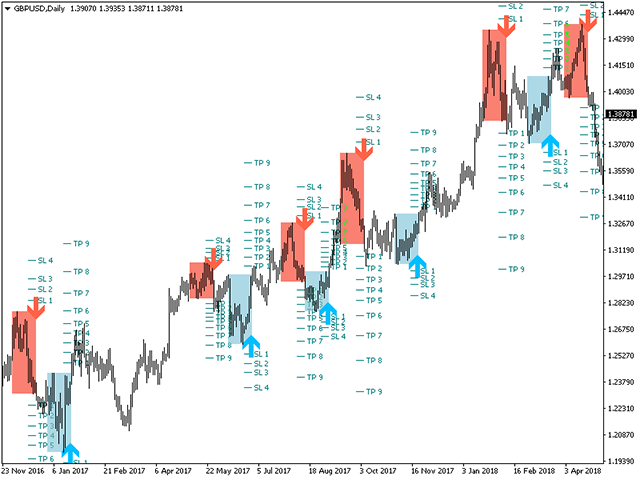
- 過去のシグナルの潜在的な利益が表示されます
- この指標は、独自の品質とパフォーマンスを分析します
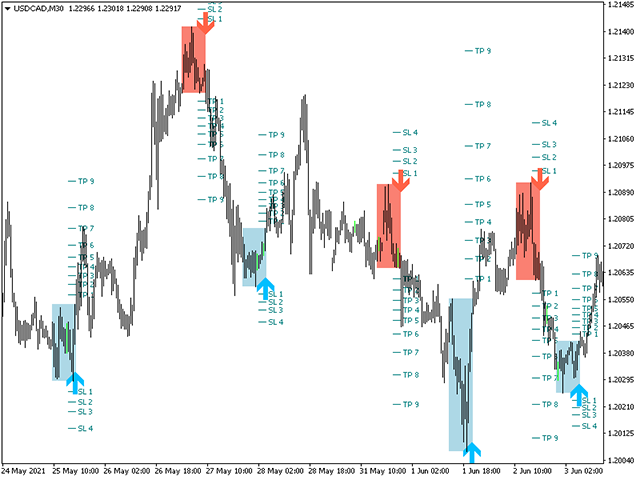
- 負けブレイクアウトは強調表示され、説明されます
- インジケータは、非バックペインティングおよび非再ペイントです
この指標は、日中のトレーダーが単一の価格反転を見逃さないようにするのに役立ちます。ただし、すべての価格反転が同じように作成されるわけではなく、実行可能な品質も同じではありません。トレードするブレイクアウトと無視するブレイクアウトの決定は、トレーダーの適切な判断に依存します。
統計の解釈方法
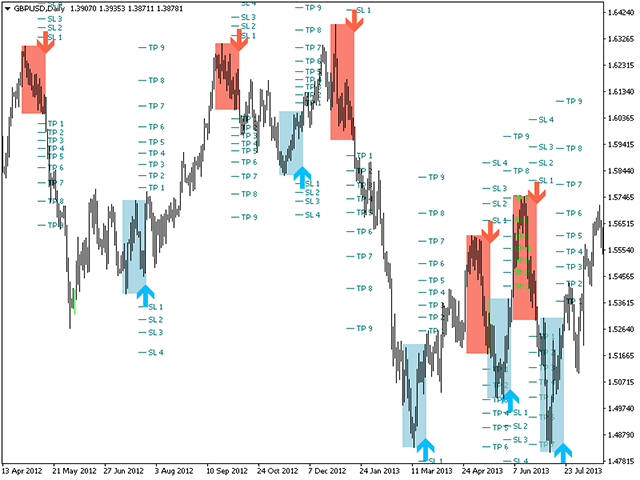
このインジケーターは、独自の信号の品質を調査し、チャートに相対的な情報をプロットします。すべての取引が分析され、全体的な履歴結果がチャートの左上隅に表示されます。これにより、特定の商品およびタイムフレームについて、インジケーターパラメーターを自分で最適化できます。各楽器とタイムフレームには独自の最適な設定があり、自分で見つけることができます。
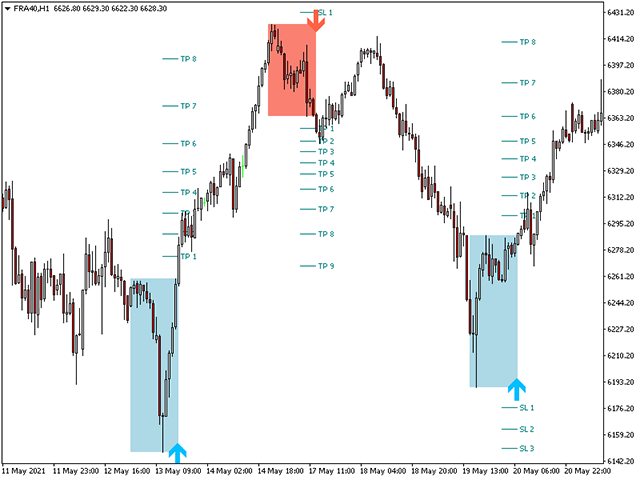
- 最大有利なエクスカーション:MFEは、任意の取引で可能な限り最良の結果です。
- 最大不利なエクスカーション:MAEは、任意の取引で最悪の結果です。
- 平均絶対期待:AAEは、MFEからMAEを差し引くことで得られる、特定の取引に期待できる絶対的な逸脱であり、エントリー戦略の真の品質を反映しています。言い換えれば、エントリー戦略は、表示されたすべてのトレードの平均可能な最高の結果と平均的な最悪の結果の間の関係によって測定されます。
- 負けトレード:チャートで負けトレードを見ると、将来パターンを失うことを避けるのに役立ちます。
このインディケーターは、2つの点線と2つの価格ラベルを使用して、すべての取引の最高の結果と最悪の結果を表示し、それらのすべてをチャートの左上隅にある統計に反映します。これらの統計を使用して、特定の機器および時間枠について、指標パラメータを自分で最適化できます。
入力パラメータ
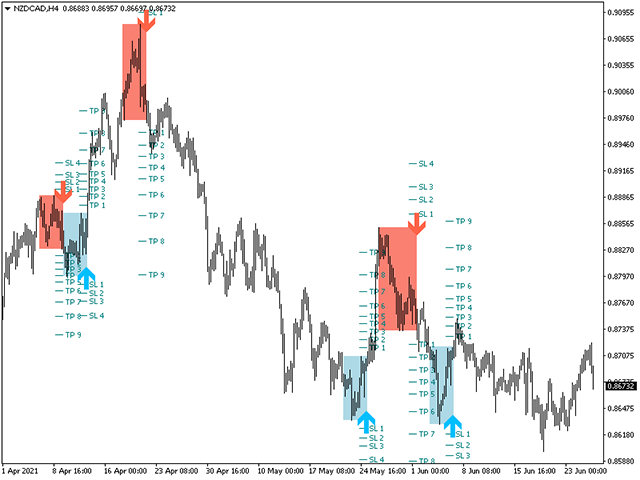
- 範囲:範囲は、ブレークアウトを有効と見なして信号を描画するために分割されるバーの最小量です。時間枠内で下がるにつれて、このパラメータを増やす必要があります。たとえば、マンスリーチャートを取引するには5の範囲が適切ですが、H1チャートを取引するには少なくとも20〜25バーの範囲が必要です。
- フィルター:フィルターの機能は、ドンチャンチャネルと作成する価格帯の乗数を使用して、代替信号を互いに分離することです。フィルターを高くすると、チャート内の信号の量は減少しますが、平均すると、好ましい最大偏位が増加します。
- 最大履歴バー:インジケーターが読み込まれたときに評価する過去のバーの量。この値を小さくすると、インジケーターの読み込みが速くなります。
- ダッシュボード:マルチタイムフレームダッシュボードウィジェットを有効または無効にします。
- 統計:統計ウィジェットを有効または無効にします。統計を使用して、各シンボルと時間枠に最適なパラメーターを見つけます。可能な限り高い精度と期待値が見つかるまで、インジケーターの入力パラメーターを段階的に変更します。
- ボックスの表示:ブレイクアウト価格帯の周りの色付きボックスを表示または非表示にします。
- 塗りつぶしボックス:ブレイクアウトボックスの内側が色で塗りつぶされているかどうかを選択します。
- 貿易分析:チャート内の個々の貿易分析を有効または無効にします。
- アラート:ブレイクアウトの表示/電子メール/プッシュ/サウンドアラートを有効にします。
サポートと質問
ヘルプデスクを使用して、質問やタイムリーなサポートを受けてください。 help@pointzero-trading.comにメールを書いてください。
著者
ArturoLópezPérez、個人投資家および投機家、ソフトウェアエンジニア、Point Zero Trading Solutionsの創設者。


All PZ tools are very well done.