Double sinus pi
- インディケータ
- Guner Koca
- バージョン: 1.0
- アクティベーション: 5
on back test use date.and not set too much back date.
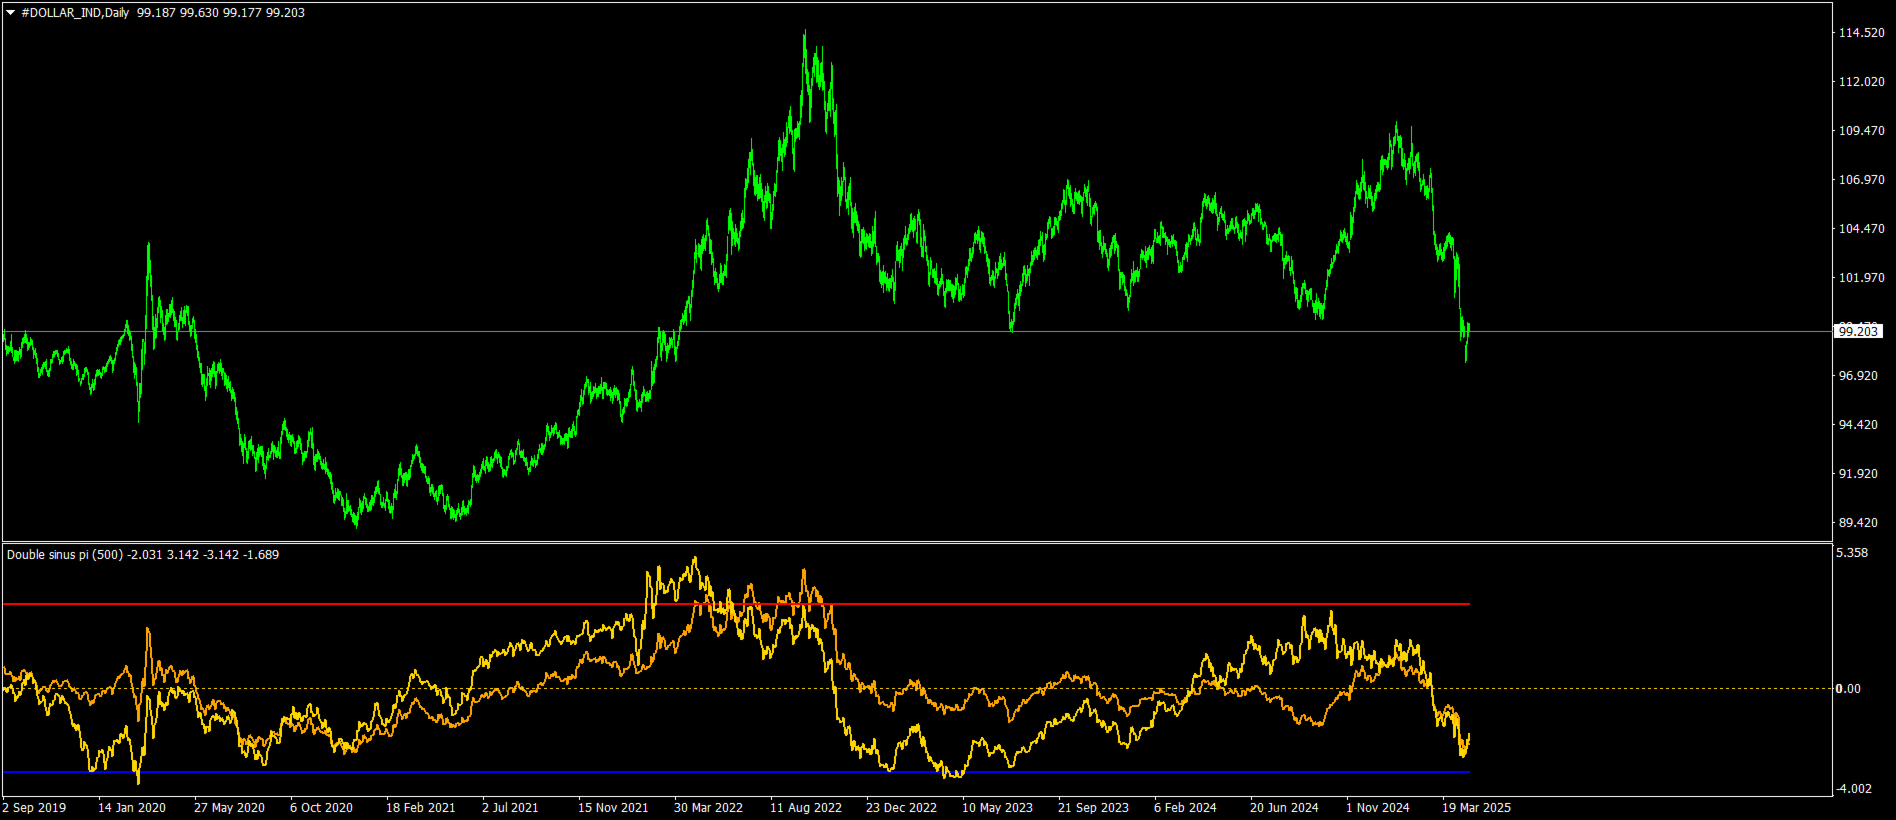
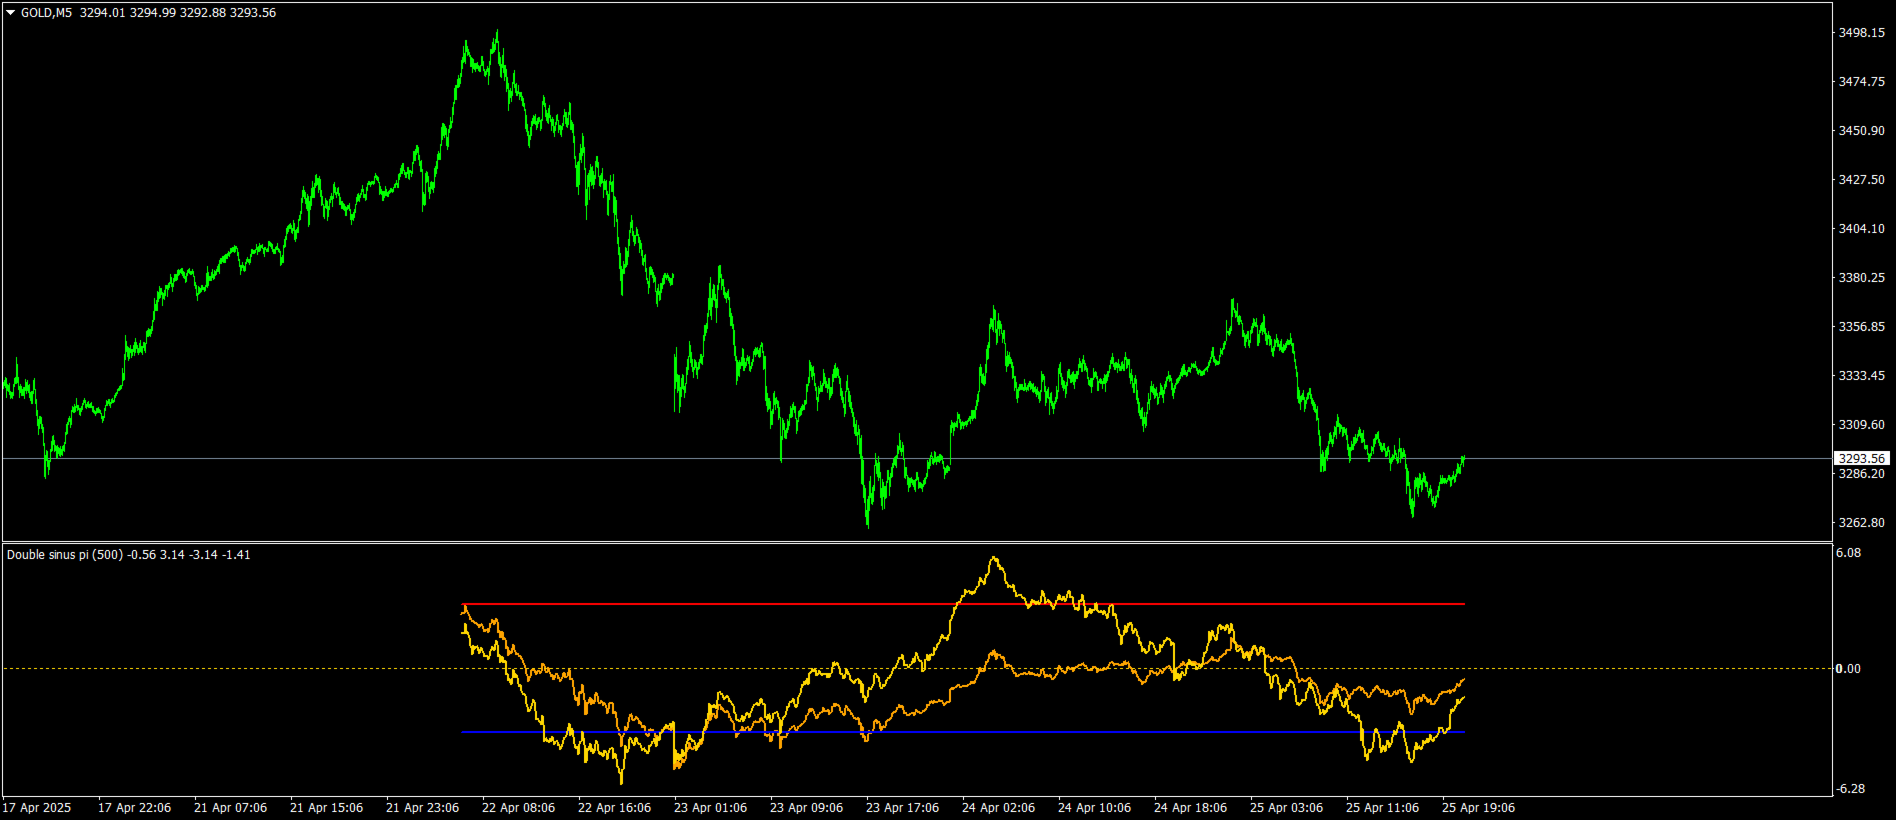
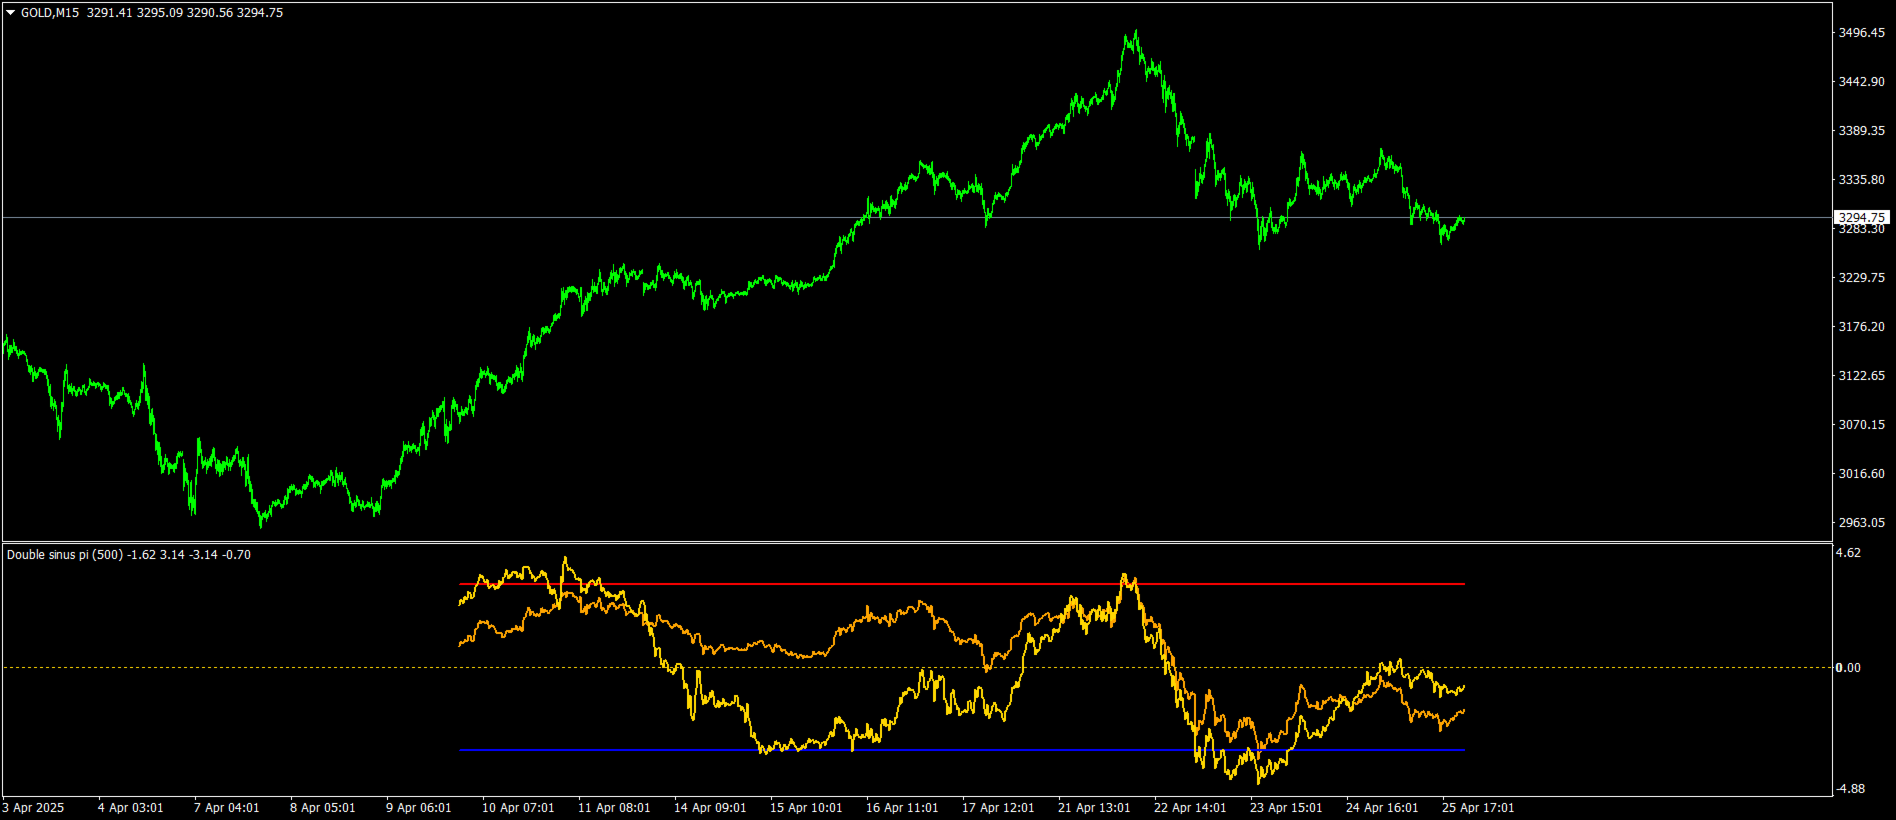
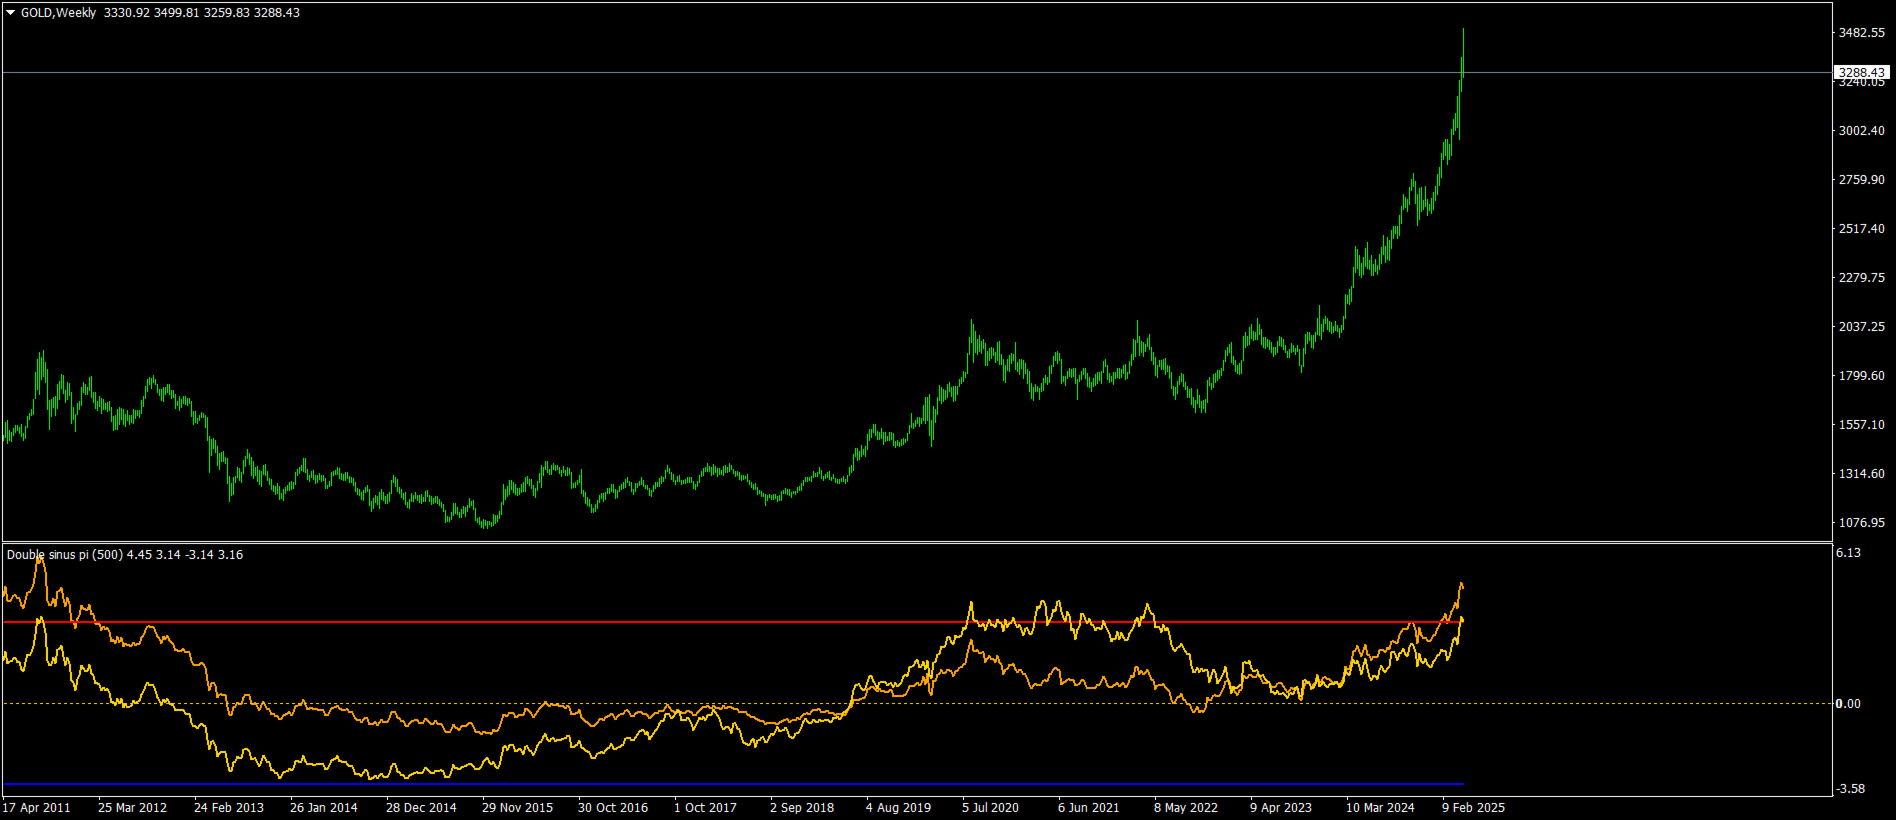
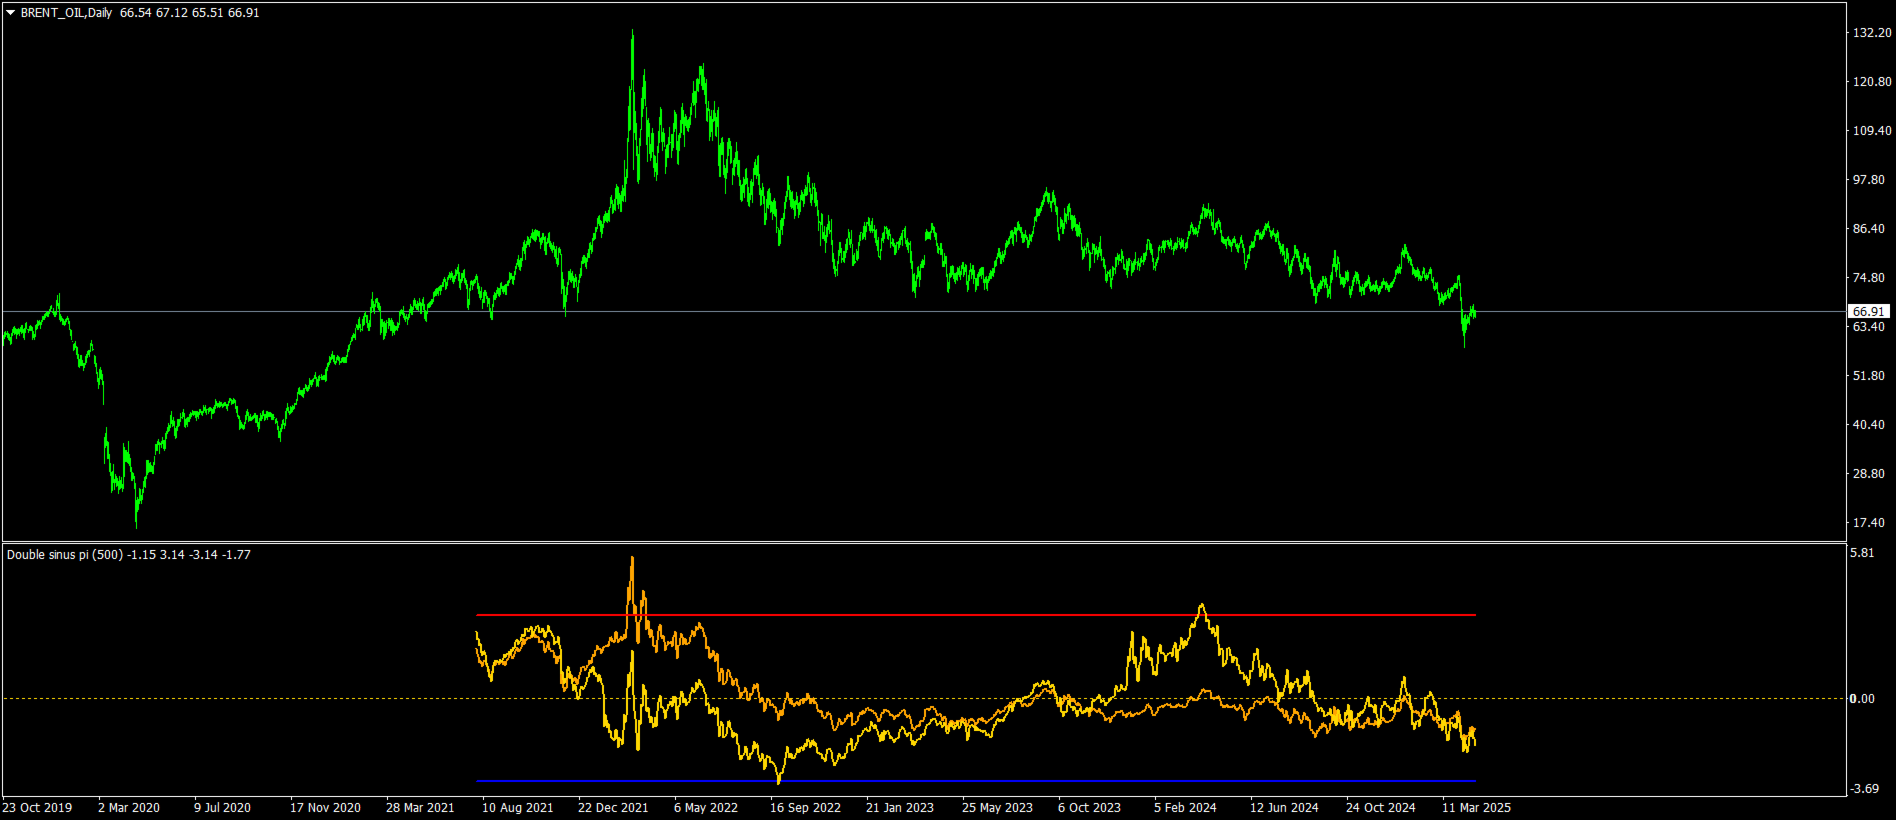
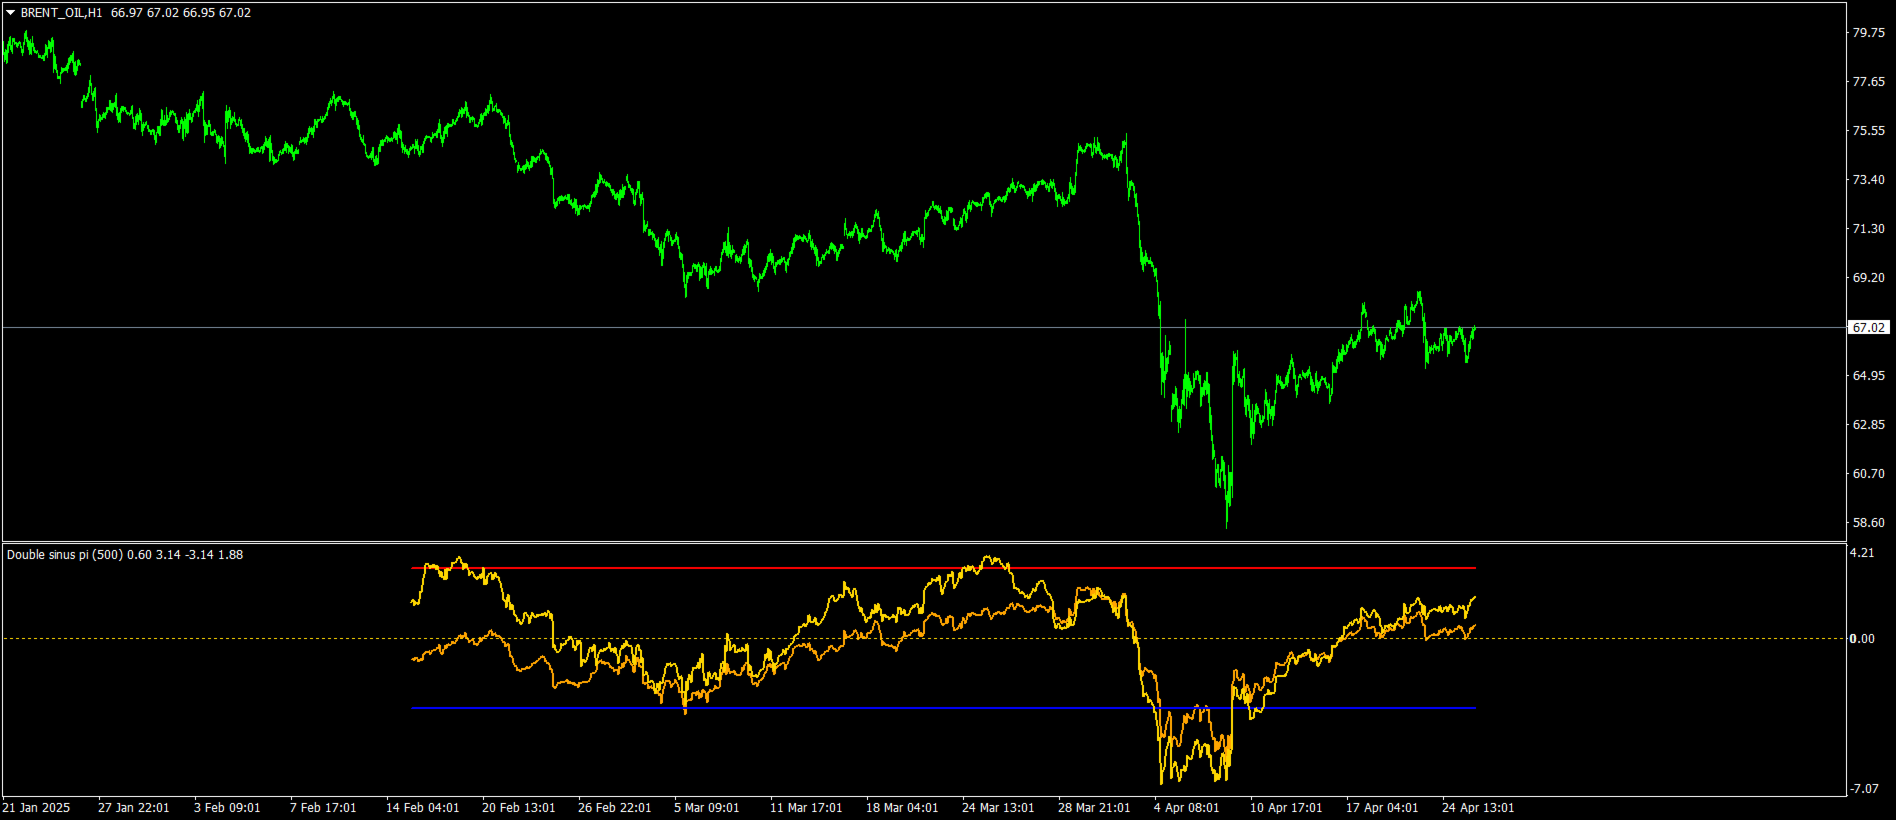
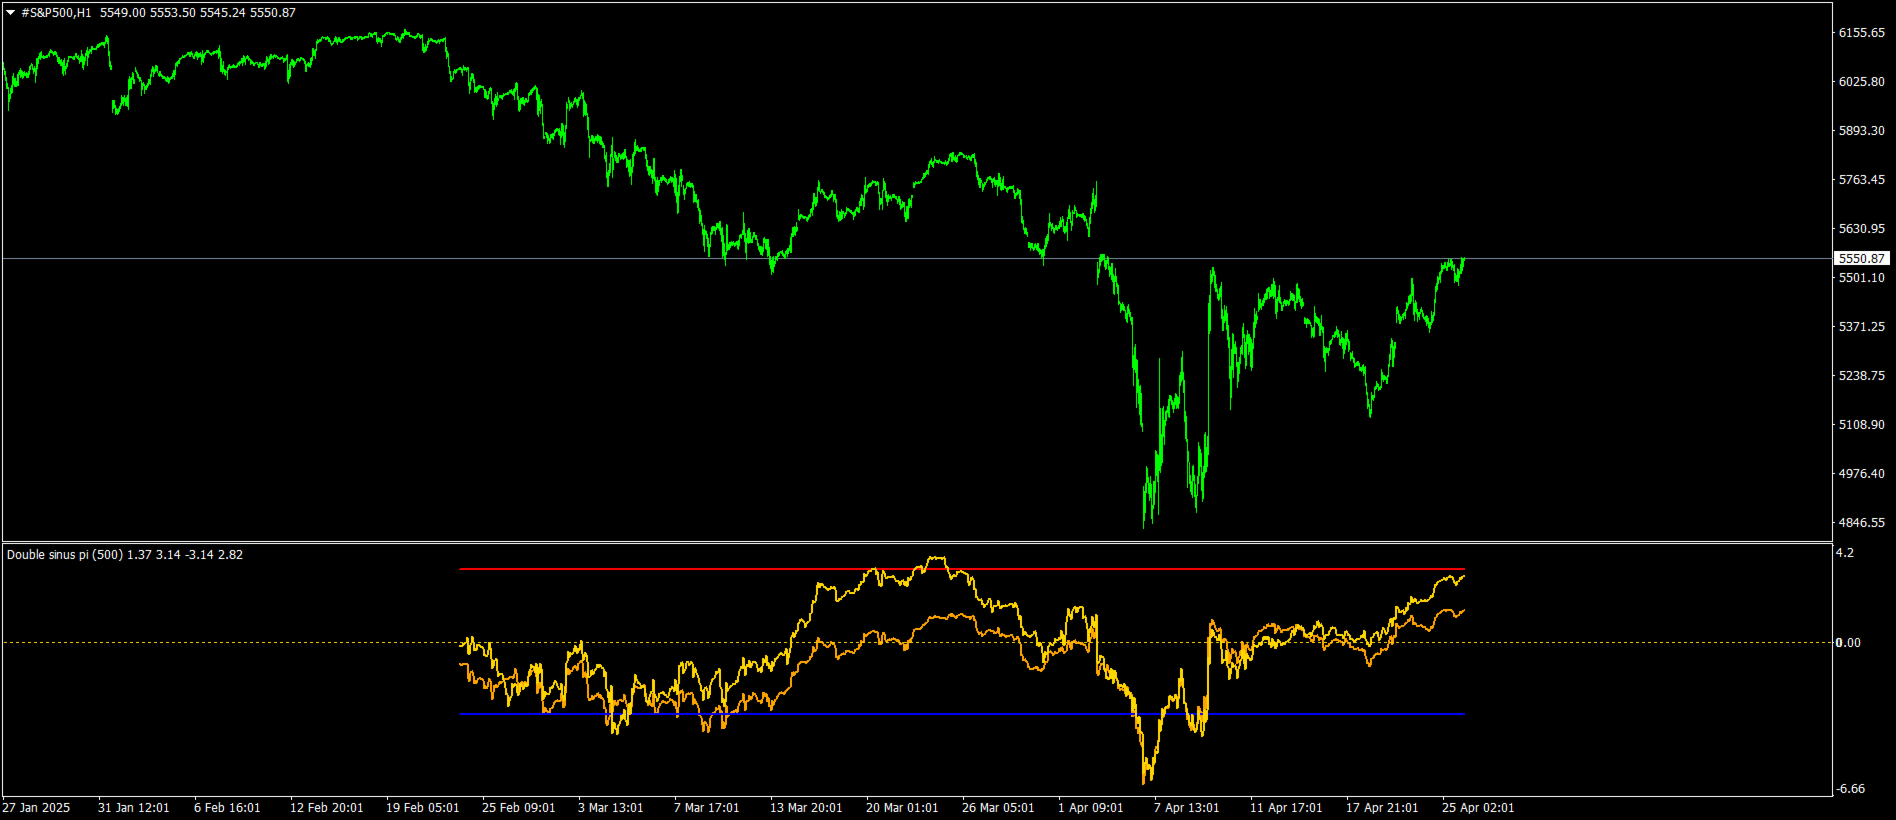
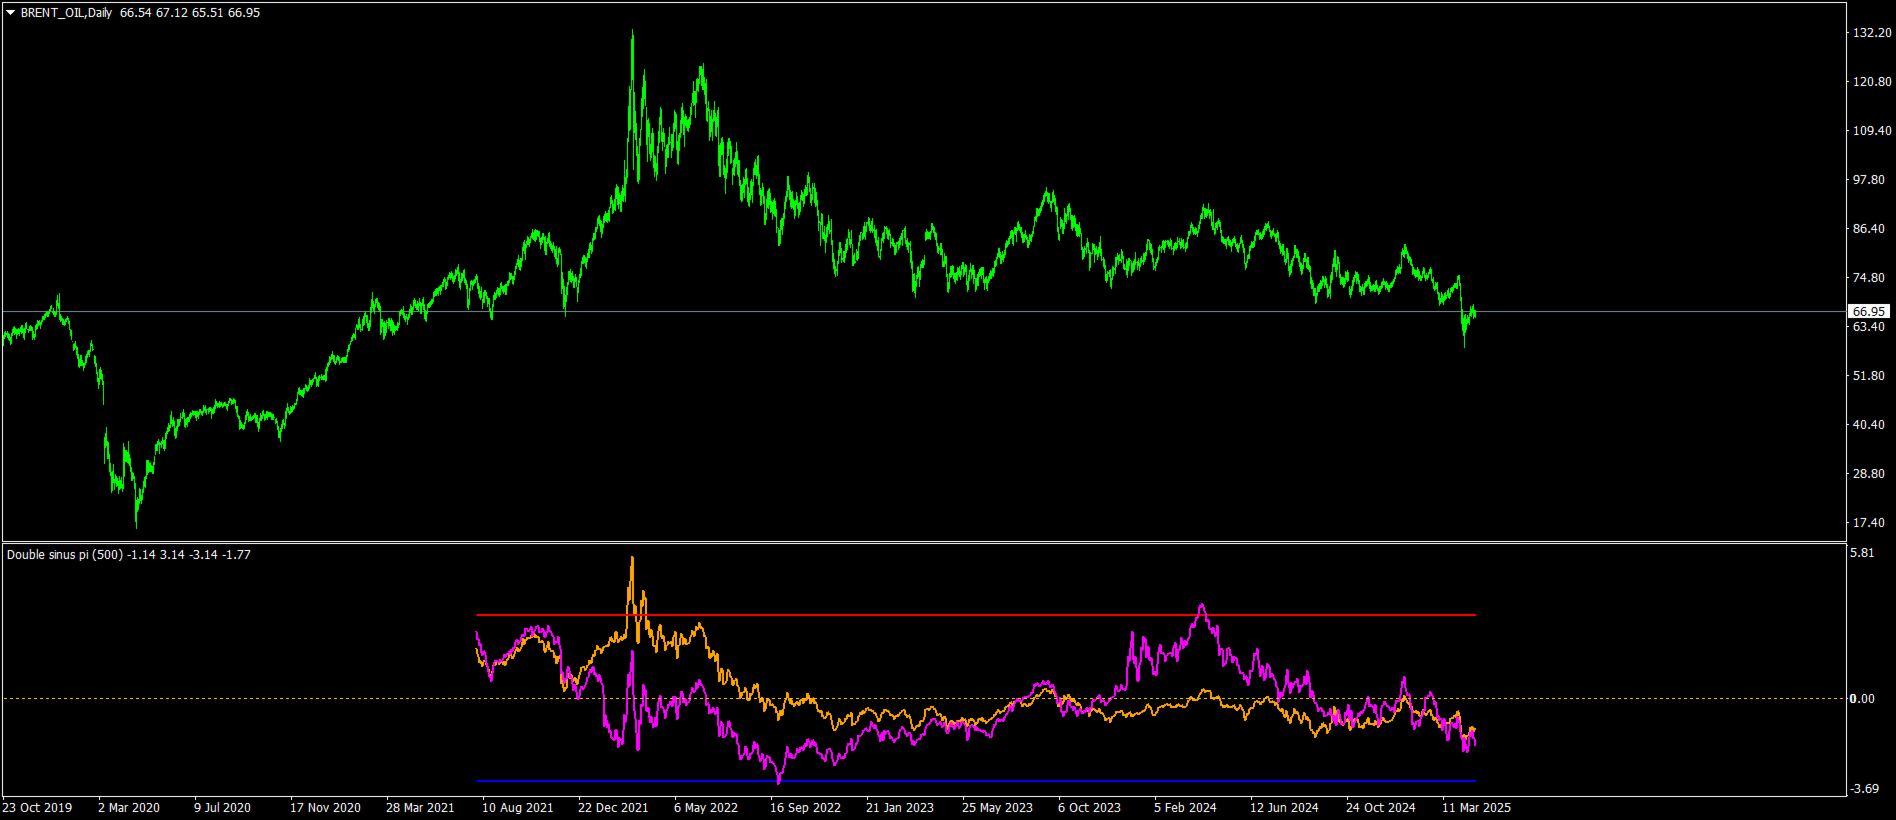
double sinus waves pi indicator is no repaint moving average and levels indicator.
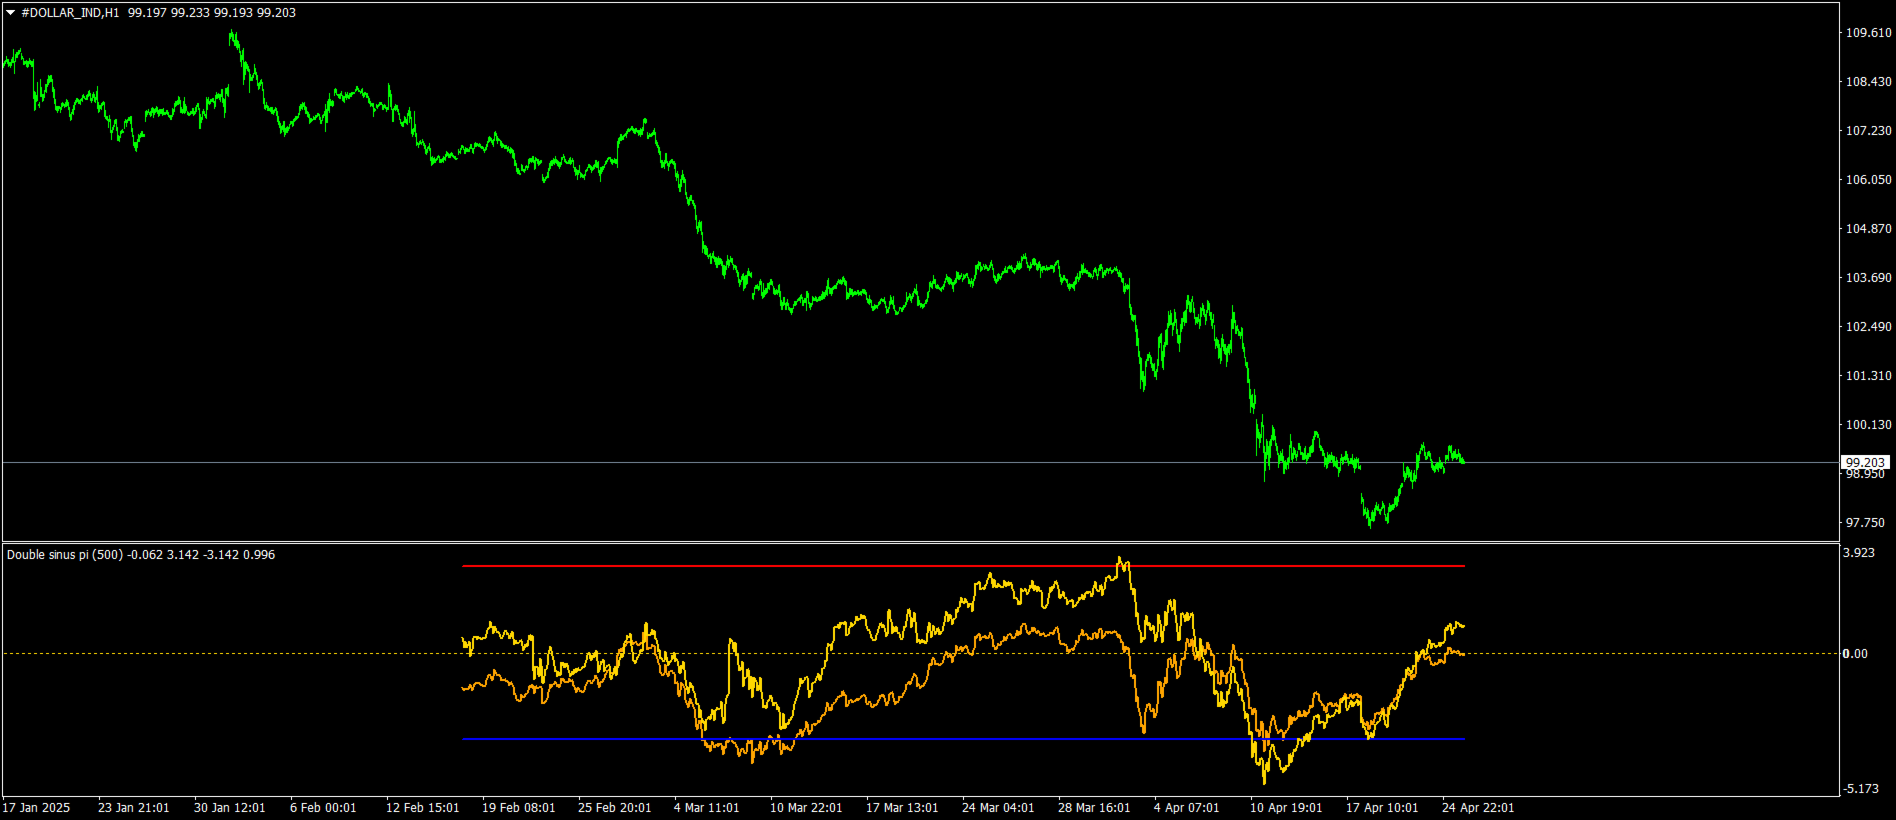
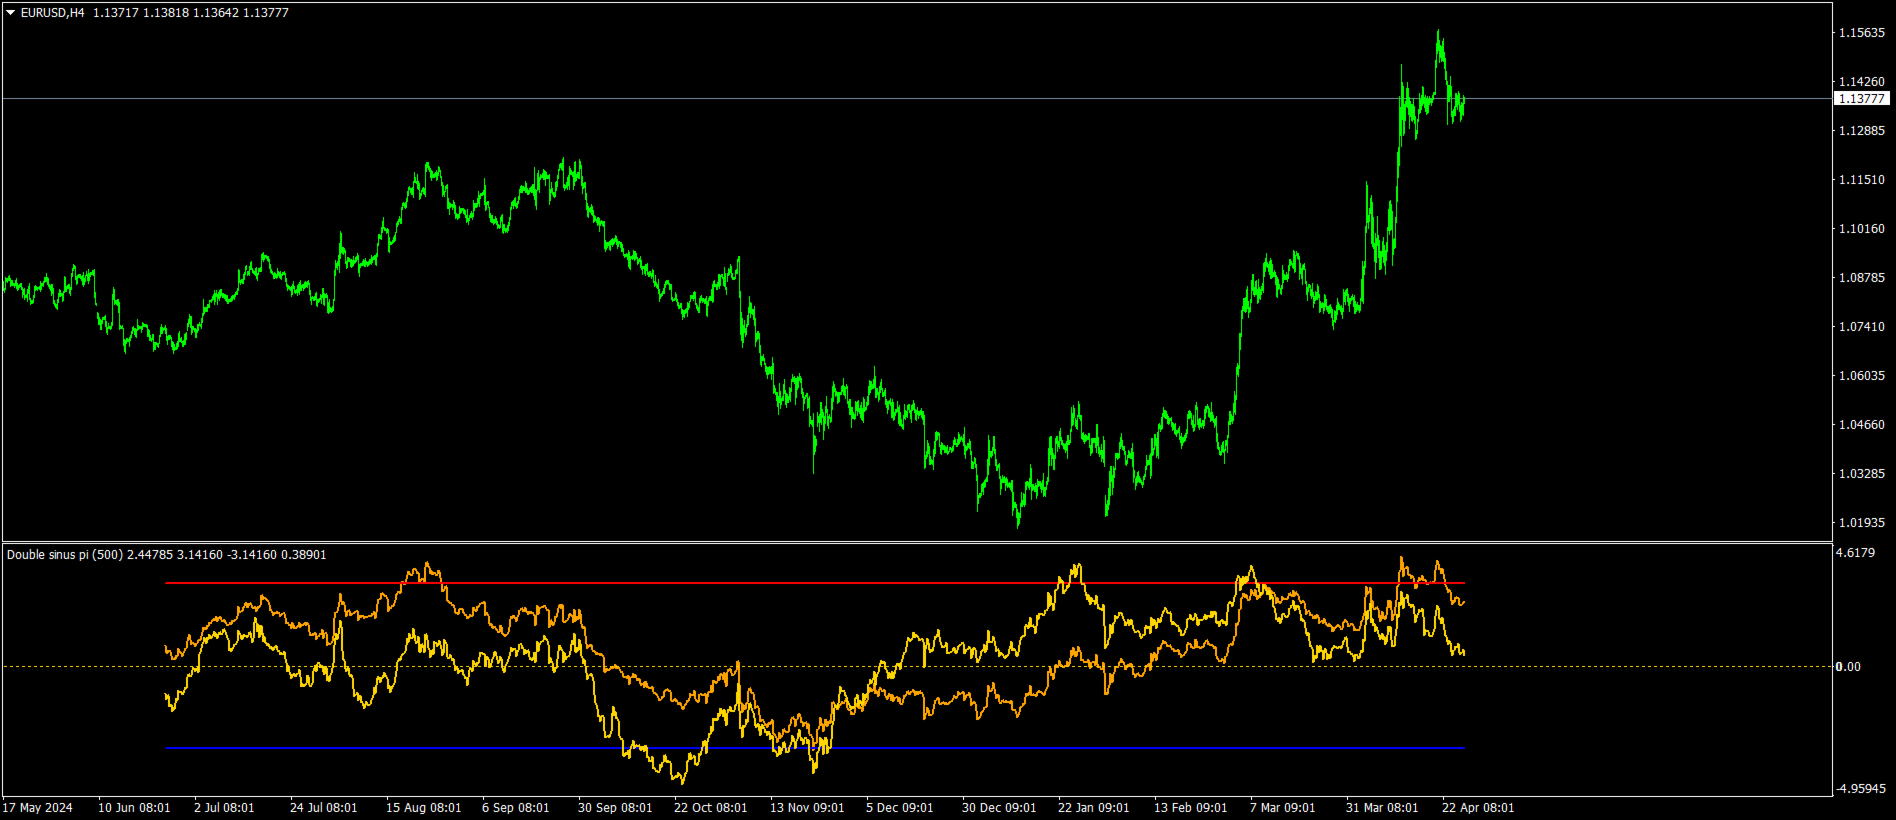
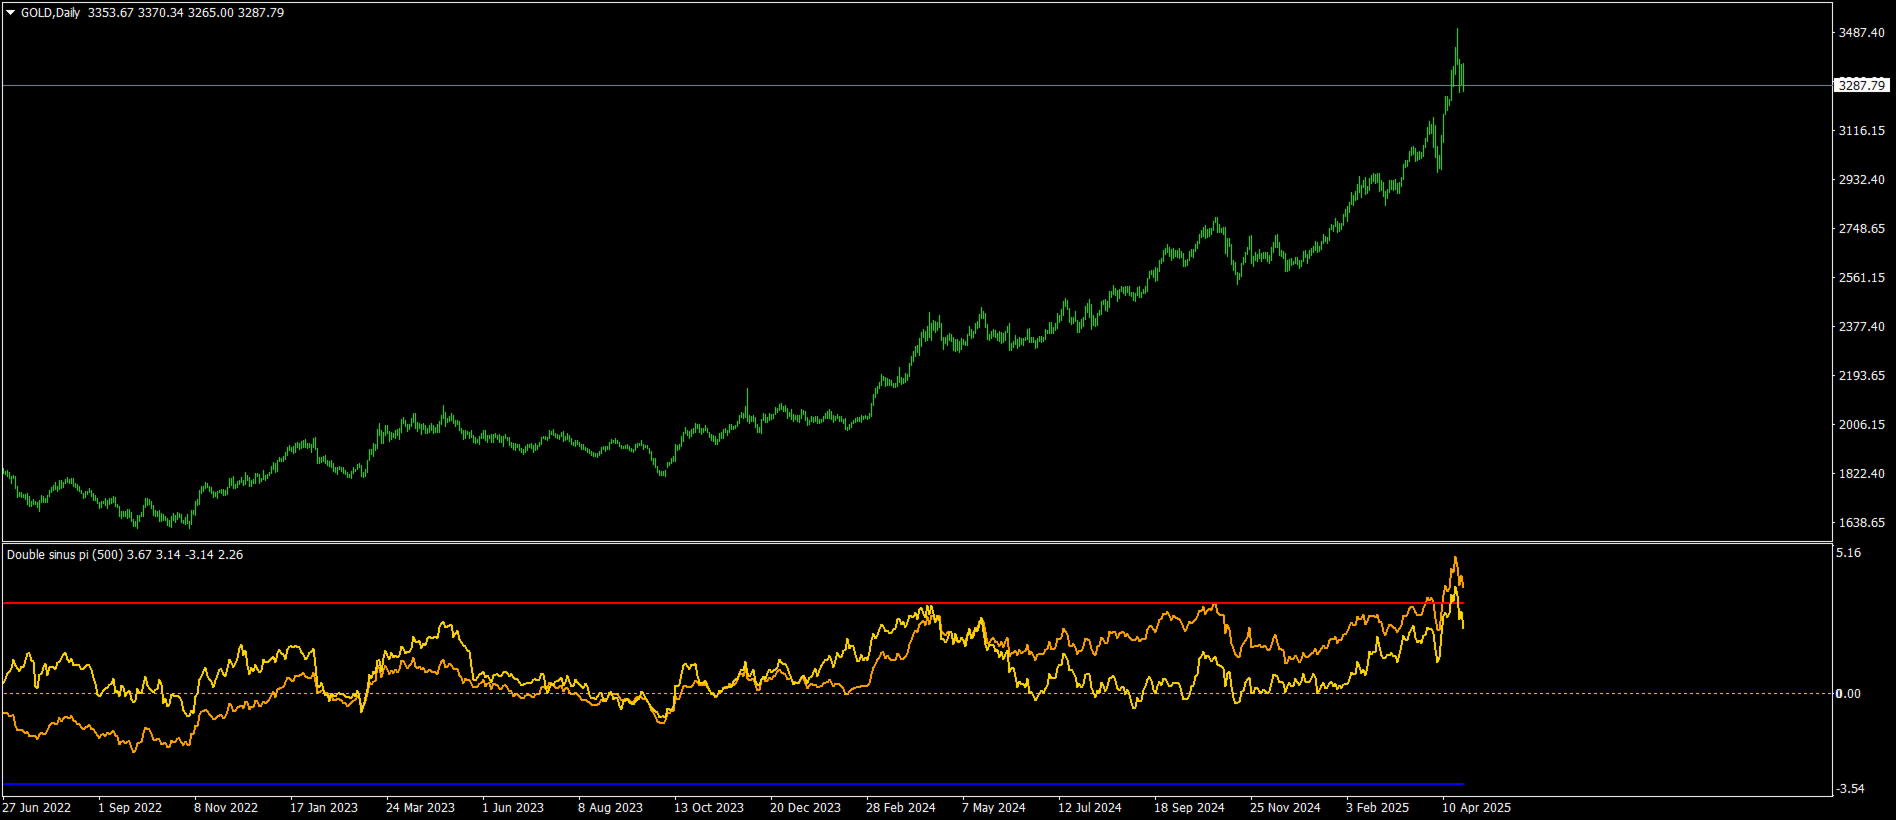
it works all timeframes and all pairs.
it is combined with sinus wave and smoothed sinus wave indicator.
and indexed to pi number over bought and oversell levels.
it is easy to to use and suitable for experienced traders and beginners.
cnt value has been set to 1000 bars.it can be increased acording to charts bar numbers.
minimum cnt value mast be higher than wave values.
waves and c value adapted wave =500 and c=pi number.