Average Daily Range ADR Indicator MT5
Average Daily Range (ADR) Indicator for MetaTrader 5
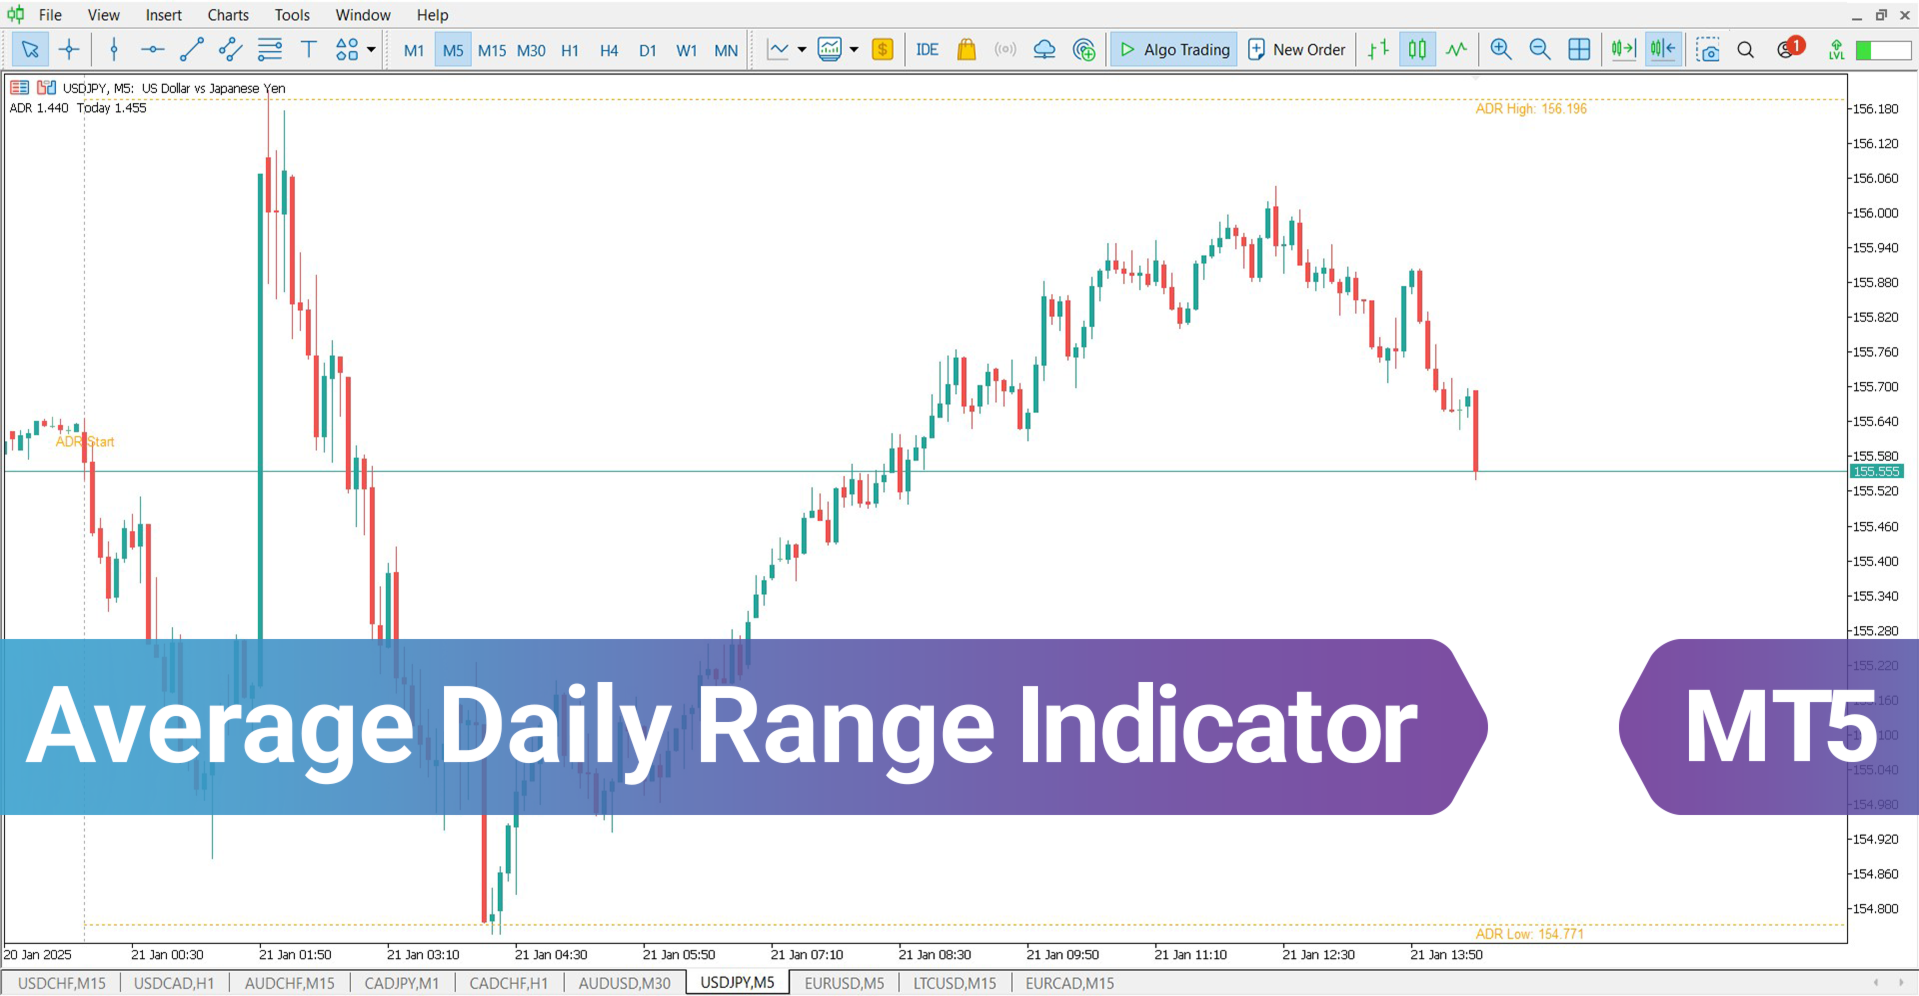
The Average Daily Range (ADR) Indicator for MetaTrader 5 is a powerful analytical tool developed for monitoring average price fluctuations within a trading day. It serves as an essential asset for evaluating market dynamics and intraday volatility.
A price movement reaching the ADR High can indicate a potential exhaustion among buyers, often hinting at an upcoming pullback. Conversely, when the price moves toward the ADR Low, it might represent weakening selling momentum, increasing the chance of a bullish reversal.
«Indicator Installation & User Guide»
MT5 Indicator Installation | Average Daily Range ADR Indicator MT4 | ALL Products By TradingFinderLab | Best MT5 Indicator: Refined Order Block Indicator for MT5 | Best MT5 Utility: Trade Assistant Expert TF MT5 | TP & SL Tool: Risk Reward Ratio Calculator RRR MT5 | Money Management: Easy Trade Manager MT5
Indicator Specifications Table
Here is a summary of the key features and functionalities of this indicator:
| Category | Market Tool – Dynamic Support & Resistance – Risk Assessment |
| Platform | MetaTrader 5 |
| Skill Level | Intermediate Users |
| Indicator Type | Reversal Zones – Range-Based Strategy |
| Timeframe | Multiple Timeframes |
| Trading Style | Intraday Focused |
| Market | Forex – Crypto – Equity Markets |
Overview of the Indicator
The indicator auto-generates the ADR zones using orange lines, giving traders a visual framework to assess price extremes throughout the day. These boundaries are instrumental in defining areas for setting stop-loss and take-profit levels.
By outlining price boundaries based on historical range behavior, this indicator equips traders with a tactical edge when building short-term strategies.
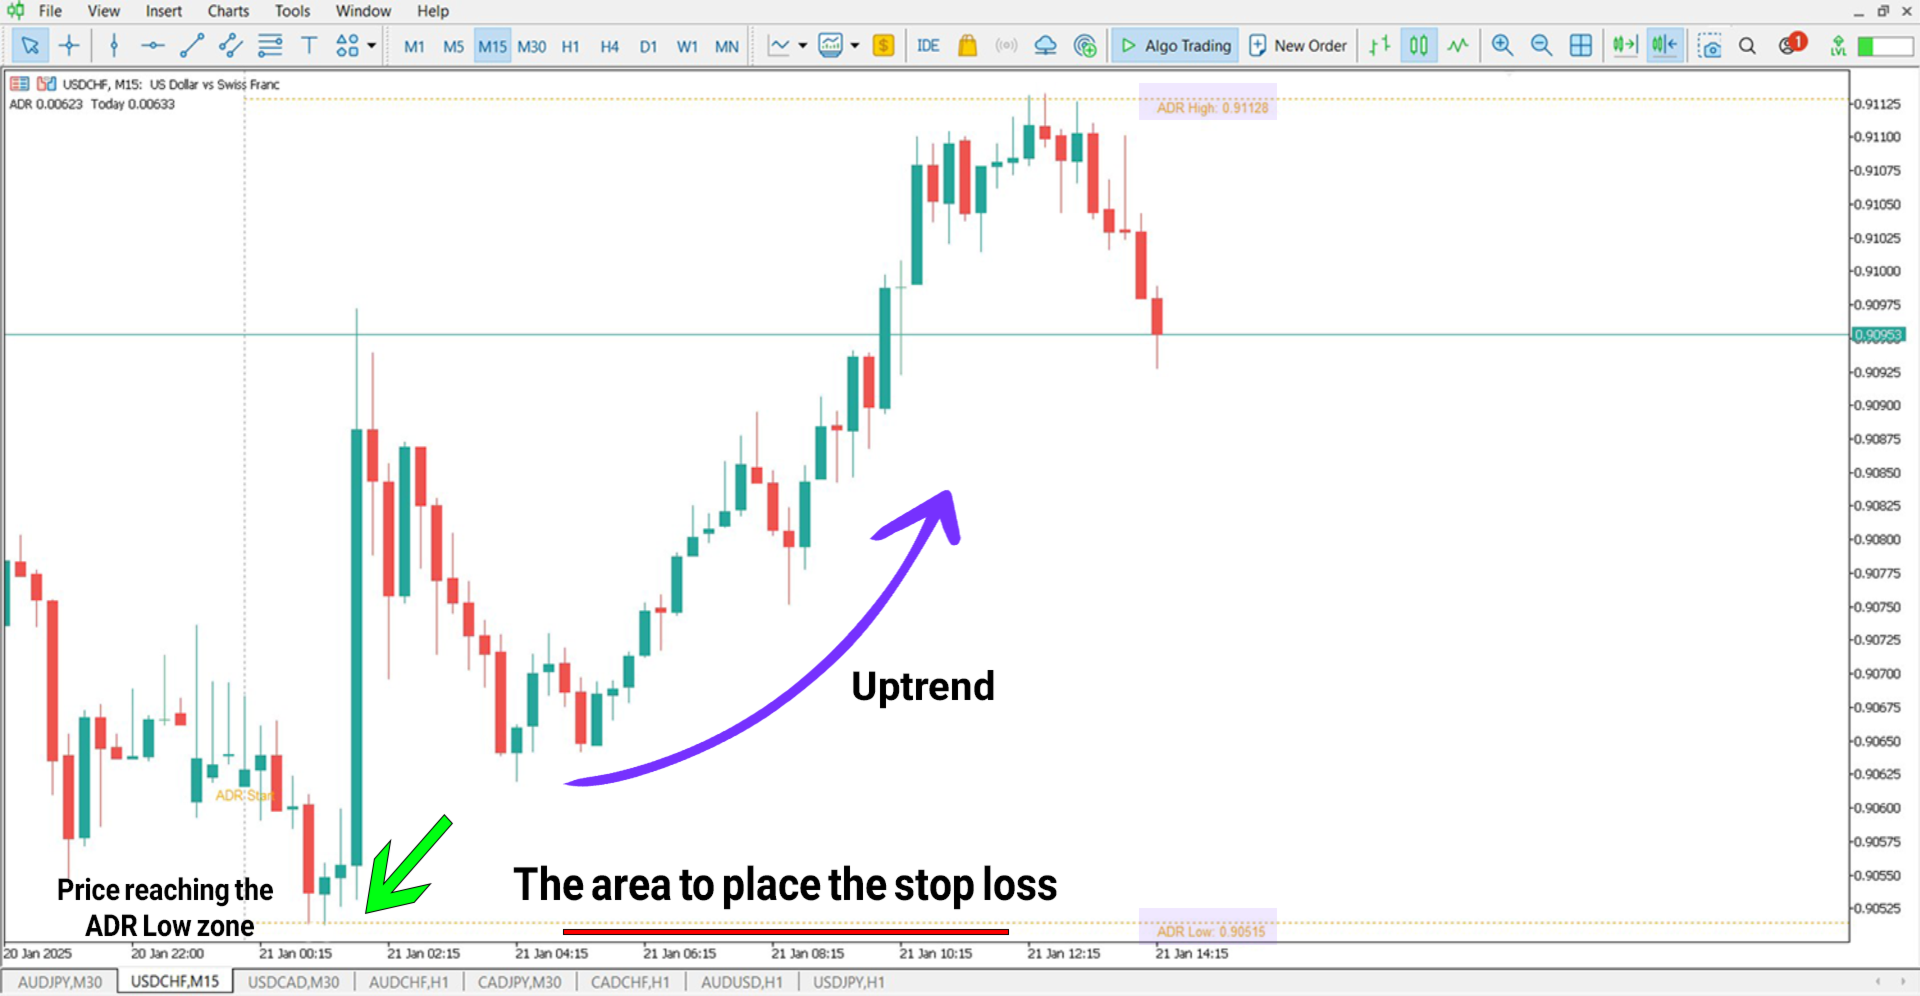
ADR in an Uptrend
When the current price falls close to the ADR Low line, it can suggest that bearish momentum is losing strength. This region often functions as a short-term support area, offering a potential opportunity for long trades.
ADR in a Downtrend
In downtrending markets, a touch on the ADR High may indicate a fading bullish force, leading to a possible retracement. This zone acts as resistance in many cases and is commonly observed for bearish entry setups.
To validate potential trend shifts, traders can look for signals such as bearish candlestick formations or declining volume on buying orders.
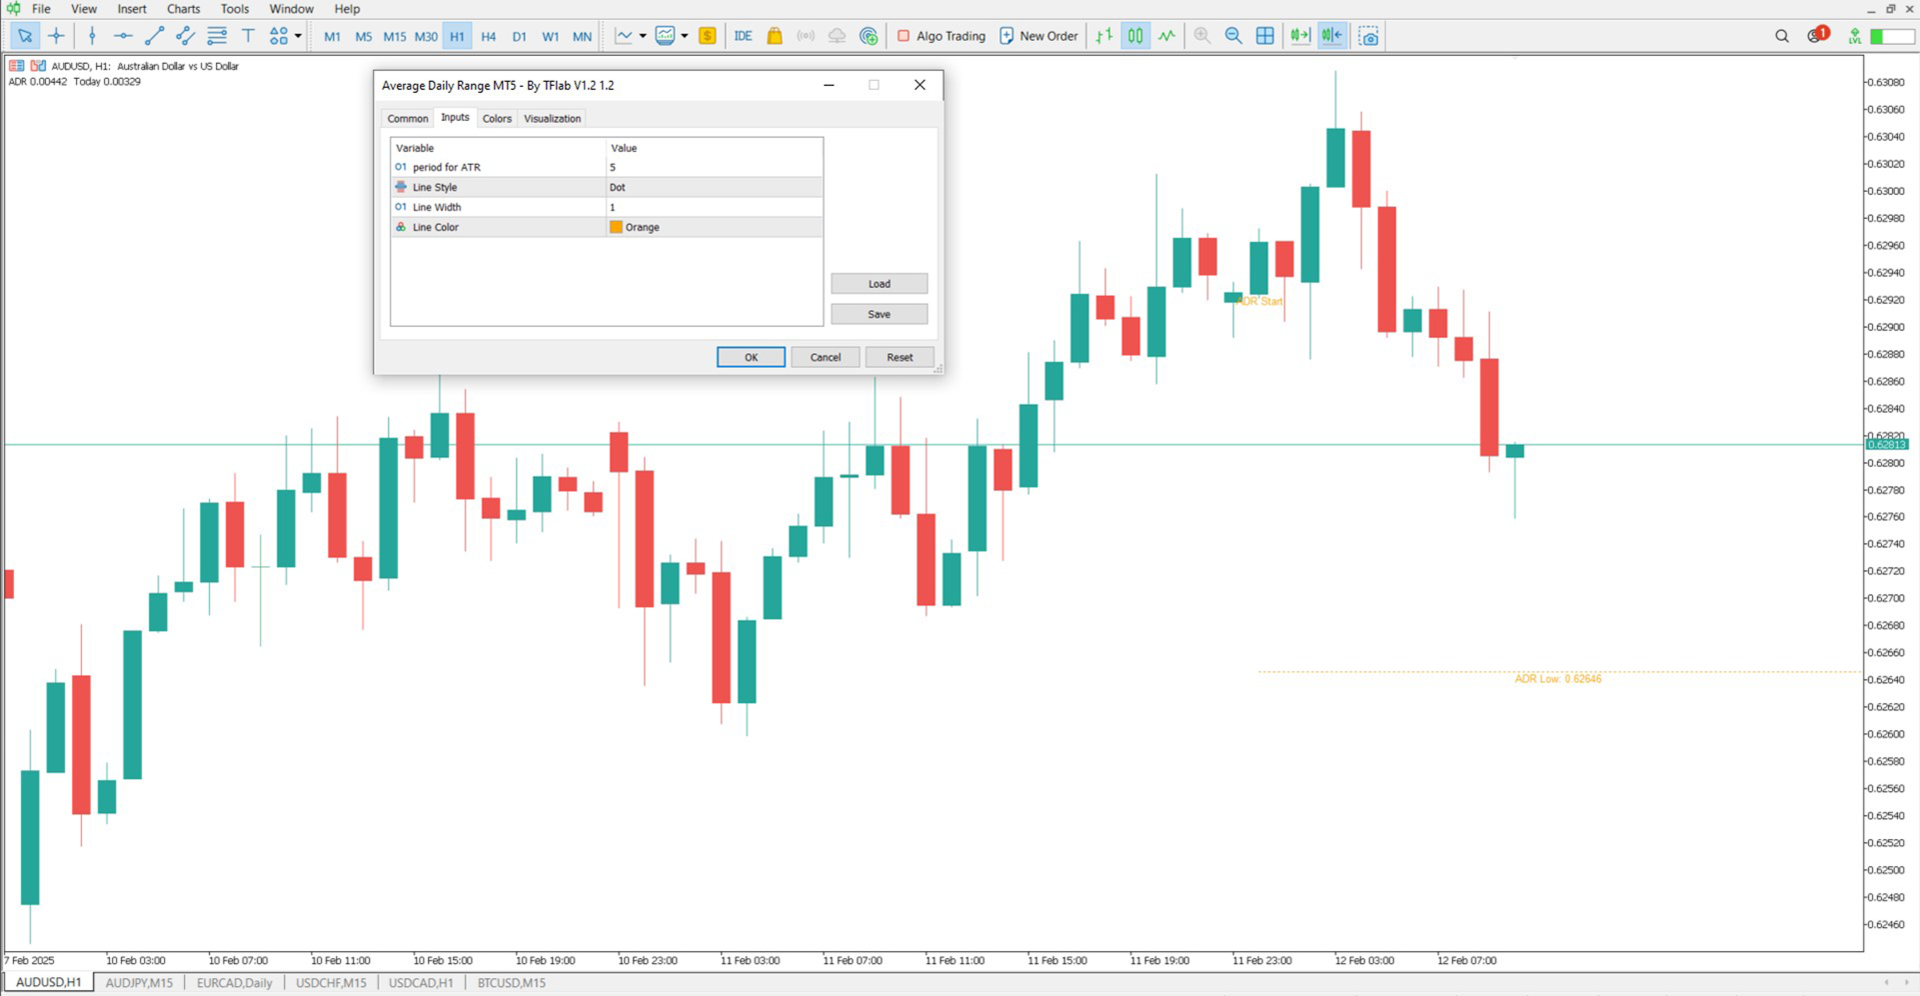
ADR Indicator Settings
Below is a snapshot of the settings available within the ADR Indicator:
- ATR Period: Sets the length of the Average True Range used to calculate ADR levels.
- Line Design: Adjusts the style (solid, dashed, dotted) of drawn levels.
- Line Thickness: Configures the width of ADR boundaries on the chart.
- Color Configuration: Selects the color used to display the upper and lower ADR zones.
Conclusion
The Average Daily Range (ADR) Indicator for MetaTrader 5 is a strategic tool for mapping key price range levels during daily trading. It enhances decision-making around entries and exits by visualizing potential turning points.
For improved results, traders are advised to pair this indicator with complementary tools, such as volume oscillators or trend confirmation indicators.