MaxVolumeTrendLines
- インディケータ
- Sergei Turov
- バージョン: 1.0
MaxVolumeTrendLines
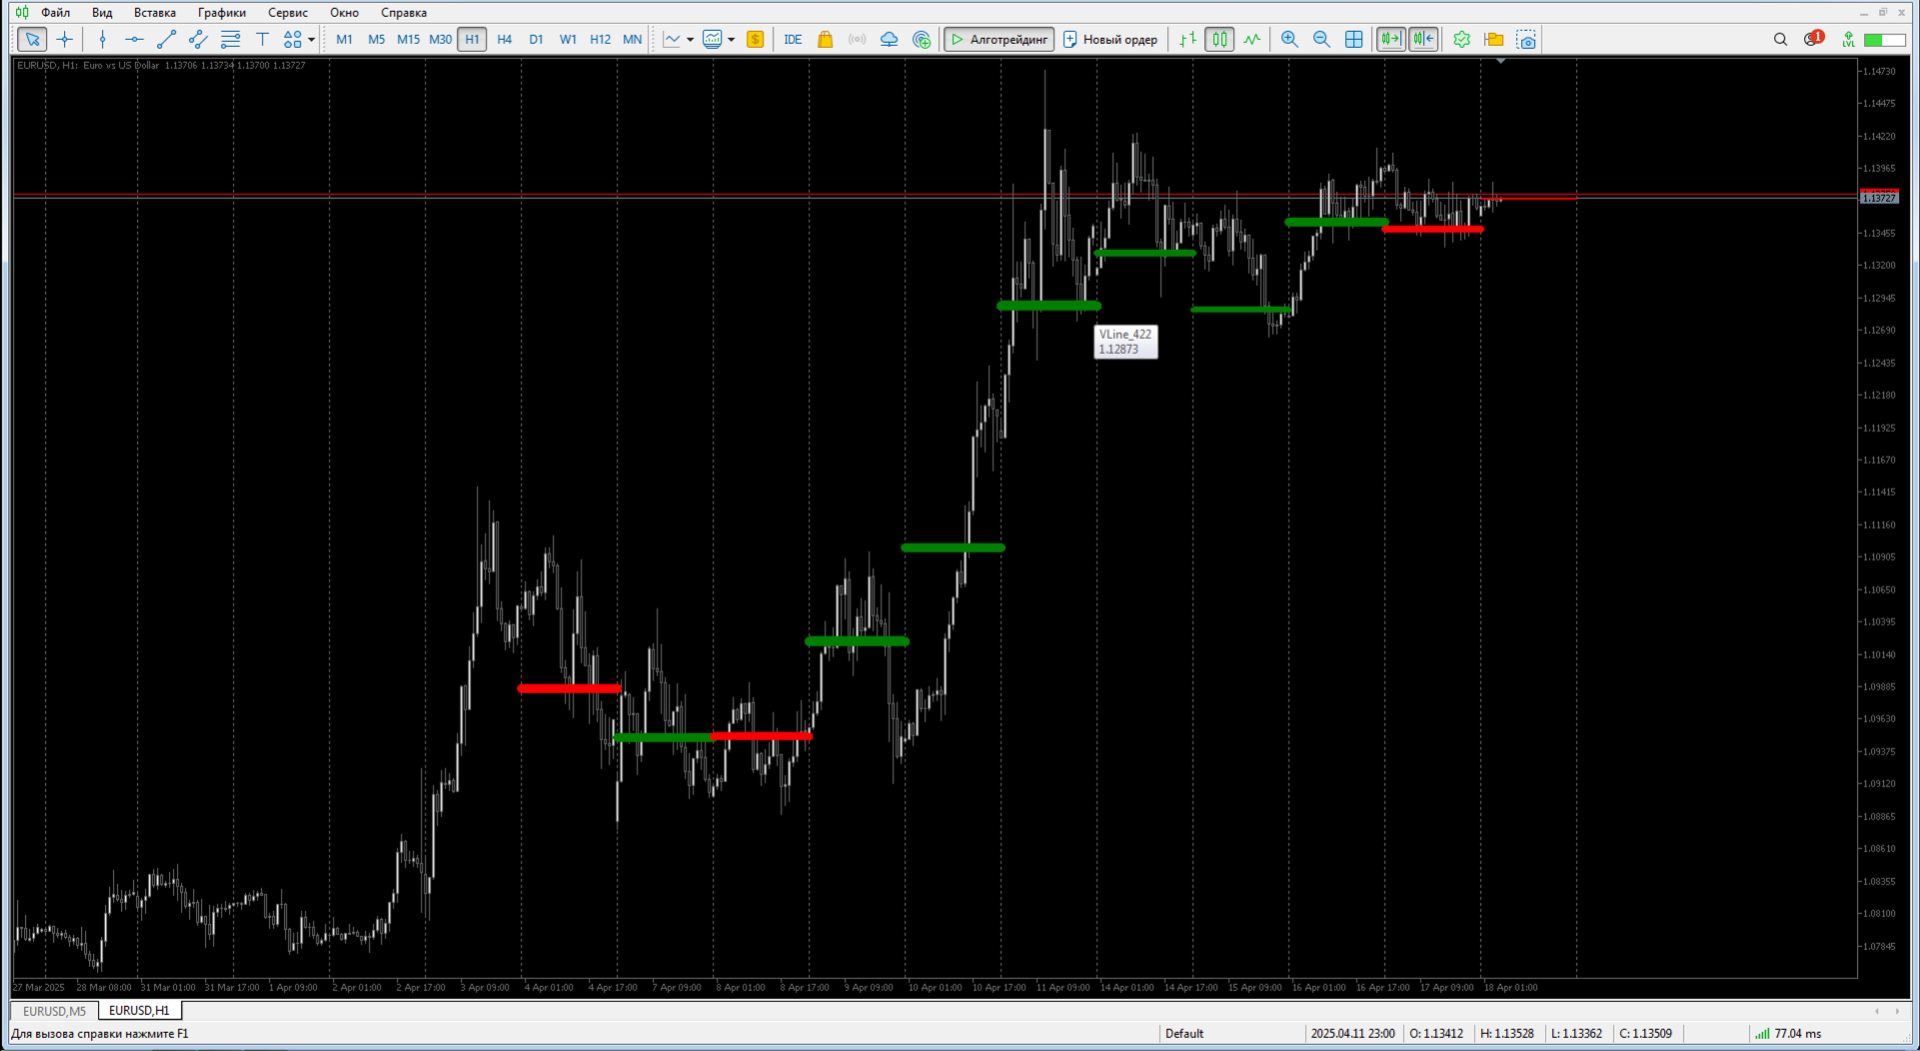
This indicator visualizes the bars with the highest tick volume for each trading day, highlighting price levels where buyers or sellers showed notable activity.
Description
MaxVolumeTrendLines automatically detects the bar with the highest tick volume within each day (for a selected number of days) and displays horizontal lines on the chart:
-
Green line at the Low — for bullish bars (close above open).
-
Red line at the High — for bearish bars (close below open).
-
Line thickness is proportional to the volume — the higher the volume, the thicker the line.
-
Real-time updates for the current day.
-
Volume labels are shown for each line to simplify visual interpretation.
Key Benefits
-
Automatic detection of key volume-based price levels.
-
Clear and intuitive visualization of the most significant bars.
-
Useful for both historical and real-time analysis.
-
Lightweight and efficient — minimal terminal load.
-
Lines are automatically removed upon indicator removal or restart.
Input Parameters
| Parameter | Description |
|---|---|
| DaysBack | Number of past trading days to analyze. |
| Timeframe | Timeframe used for volume analysis. |
| MaxLineWidth | Maximum line thickness (for highest volume). |
| MinLineWidth | Minimum line thickness (for lower volume levels). |
Compatibility
-
Platform: MetaTrader 5
-
Works with any trading instrument and timeframe.
-
Recommended usage: M5 or M15 for intraday volume tracking.
Use Cases
-
Traders applying volume-based analysis.
-
Identifying support and resistance levels.
-
Suitable for intraday and short-term trading strategies.