• 概要
  • レビュー
  • コメント

Power Trend Indicator MT5

Power Trend Indicator for MetaTrader 5

The Power Trend Indicator for MetaTrader 5 is a dynamic trading utility designed to help traders pinpoint both the direction and momentum of ongoing market trends. This oscillator uses a color-coded histogram to visually represent trend strength. A red bar signifies a trend shift, blue indicates mild trend activity, green denotes strong momentum, and black reflects a flat or indecisive market. It's particularly useful for spotting trend reversals and rapid shifts in market sentiment.

«Indicator Installation & User Guide»

MT5 Indicator Installation | Power Trend Indicator MT4 | ALL Products By TradingFinderLab | Best MT5 Indicator: Refined Order Block Indicator for MT5 | Best MT5 Utility: Trade Assistant Expert TF MT5 | TP & SL Tool: Risk Reward Ratio Calculator RRR MT5 | Money Management: Easy Trade Manager MT5


Indicator Table

Category

Oscillator – Signal & Forecasting

Platform

MetaTrader 5

Skill Level

Intermediate

Indicator Type

Reversal – Trend Continuation

Time Frame

Multi-Time Frame

Trading Style

Short-Term – Mid-Term

Trading Market

Universal – All Market Types


Indicator Overview

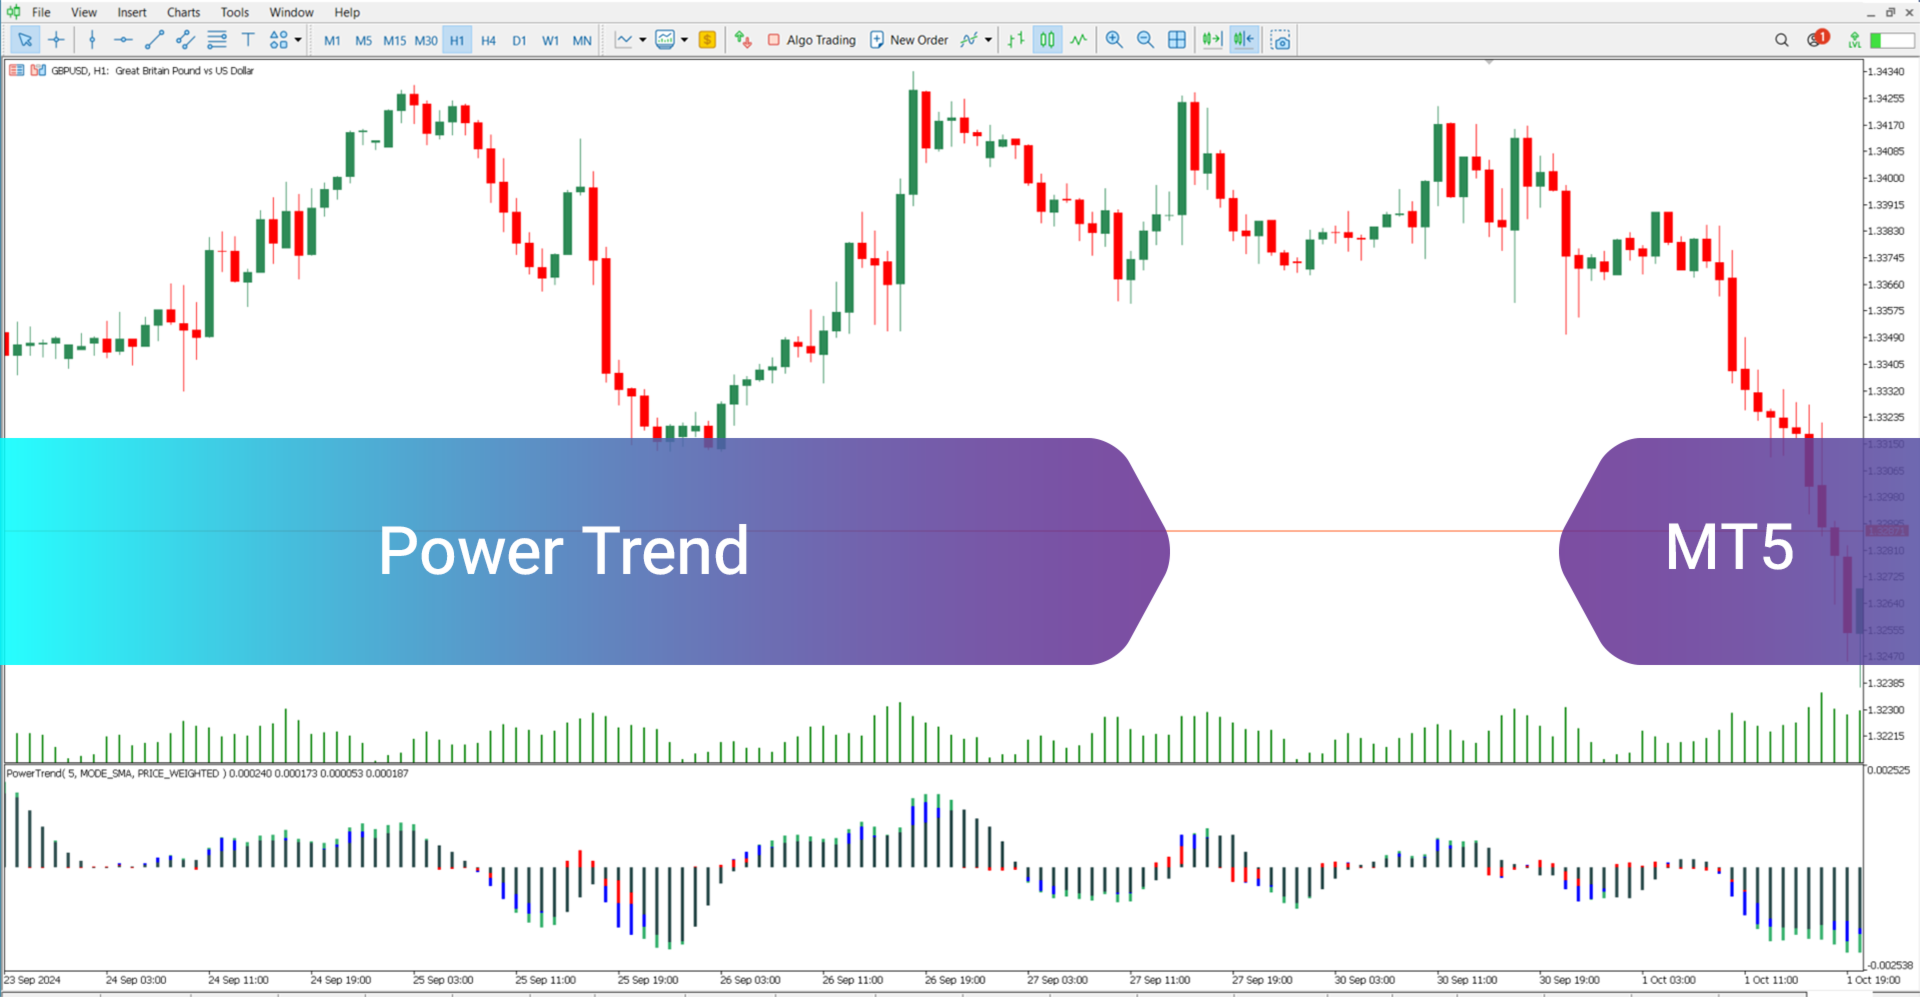
The Power Trend Oscillator offers a clear visual representation of trend momentum and direction, making it easier for traders to assess market conditions. It displays two operational zones: an upper (positive) zone, and a lower (negative) one. The positive zone highlights bullish market conditions, while the negative zone reveals bearish price behavior.


Bullish Signal Example

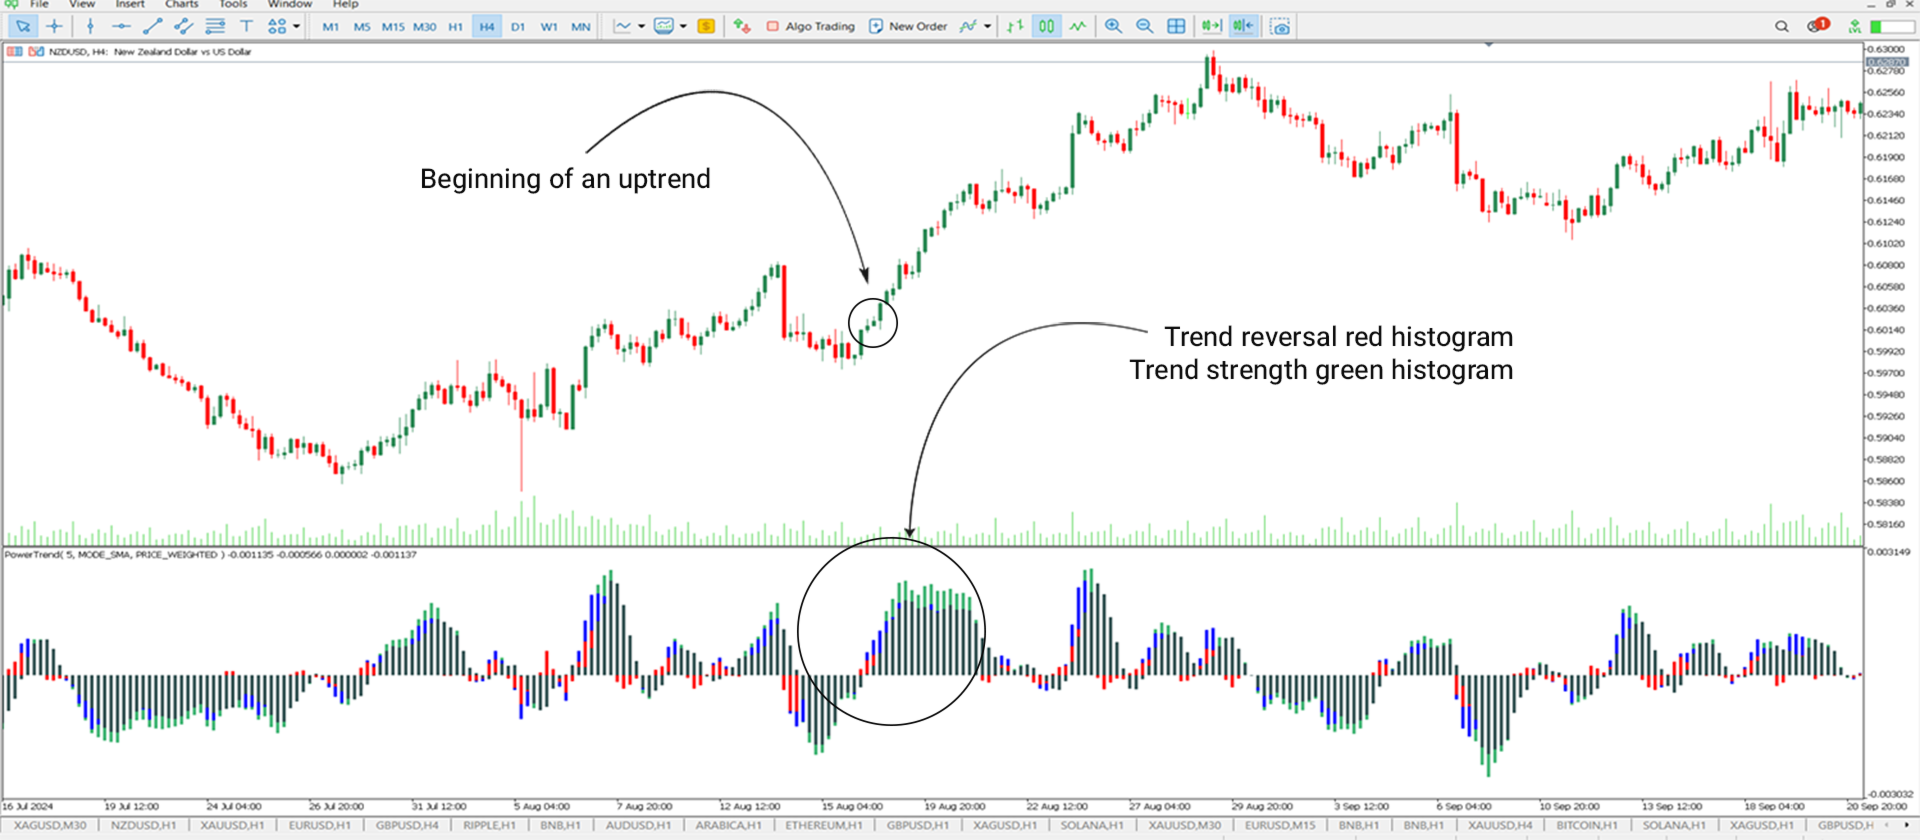
In the chart below, we analyze the NZD/USD pair using a 4-hour time frame. The transition of the histogram from below to above the zero level is evident. The red bar marks a potential trend transition, and subsequent green bars indicate a strengthening upward movement, confirming bullish conditions.


Bearish Signal Example

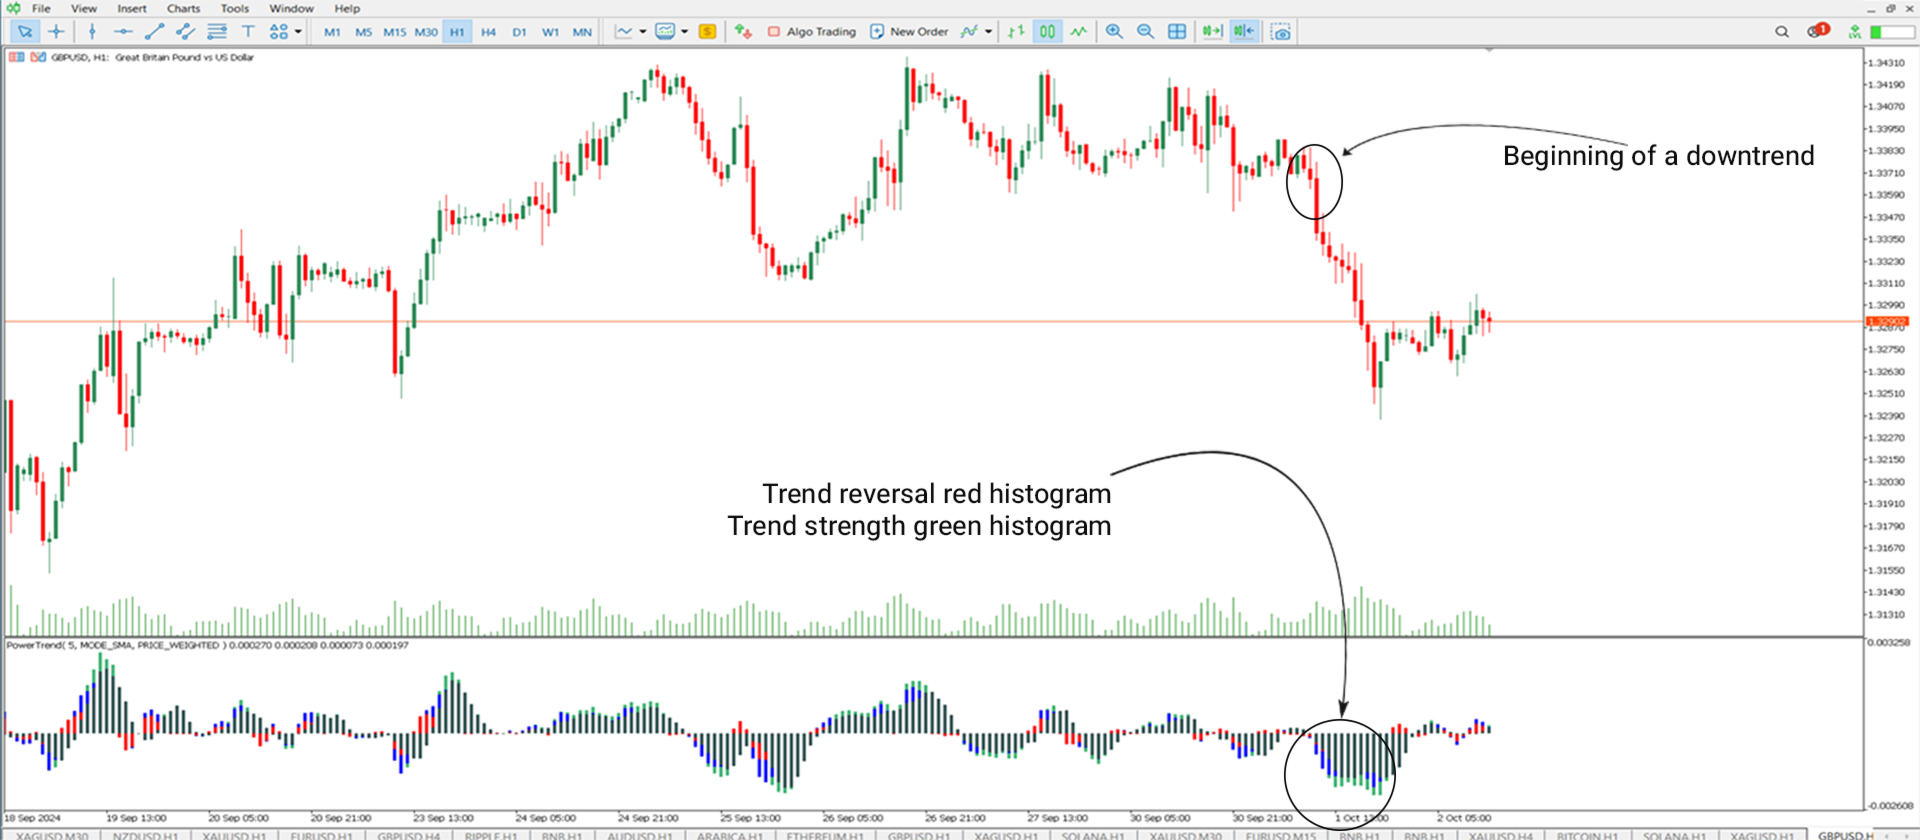
The chart below shows the GBP/USD pair on a 1-hour chart. Here, the histogram drops from the positive to the negative zone. A red bar appears as an early warning of a trend shift, followed by green bars pointing to the development of a robust bearish movement.


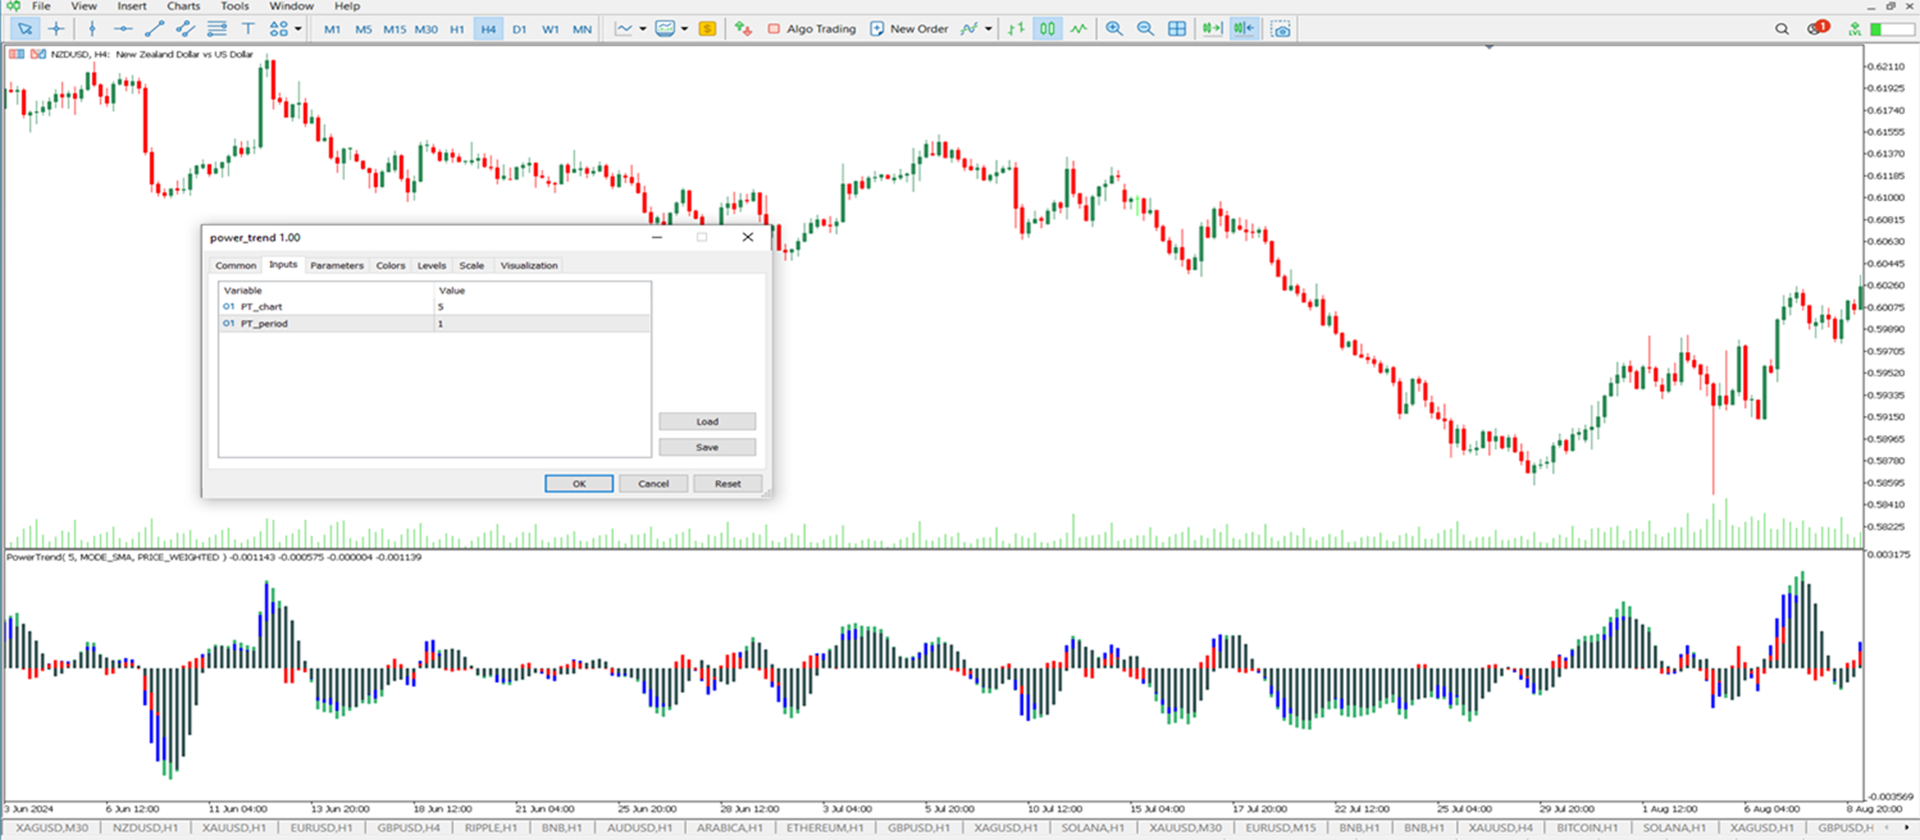
Indicator Configuration

  • PT_chart: Defines candlestick integration; set to 5
  • PT_period: Determines indicator sensitivity; set to 1


Conclusion

The Power Trend Indicator for MetaTrader 5 is a reliable companion for traders aiming to catch early signs of market transitions or validate trend strength. Whether used alone or in combination with other tools like price structures, zones of support and resistance, or divergence strategies, it helps refine market entries and exits with increased confidence.

おすすめのプロダクト
Introducing the Consecutive Green/Red Candle Alert Indicator for MT5 - Your Trend Spotting Companion! Are you ready to take your trading to the next level? We present the Consecutive Green/Red Candle Alert Indicator, a powerful tool designed to help you spot trends and potential reversals with ease. Whether you're a new trader looking for clarity in the market or an experienced pro seeking additional confirmation, this indicator is your trusted companion. Key Features of the Consecutive Green
FREE
Follow The Line MT5
Oliver Gideon Amofa Appiah
4.52 (29)
This indicator obeys the popular maxim that: "THE TREND IS YOUR FRIEND" It paints a GREEN line for BUY and also paints a RED line for SELL. (you can change the colors). It gives alarms and alerts of all kinds. IT DOES NOT REPAINT and can be used for all currency pairs and timeframes. Yes, as easy and simple as that. Even a newbie can use it to make great and reliable trades. NB: For best results, get my other premium indicators for more powerful and reliable signals. Get them here: https://www.m
FREE
Best SAR MT5
Ashkan Hazegh Nikrou
4.33 (3)
説明 :  外国為替市場(PSAR)で専門的で人気のあるインジケーターの1つに基づいた新しい無料インジケーターをご紹介します。このインジケーターは元のパラボリックSARインジケーターの新しい変更です。プロSARインジケーターでは、ドットと価格チャートのクロスオーバーを見ることができます。クロスオーバーはシグナルではありませんが、動きの終わりの可能性について話します。新しい青いドットで購入を開始し、最初の青いドットの1 atr前にストップロスを配置し、最後にドットが価格チャートを横切るとすぐに終了できます。 売買シグナルを開く方法は? 最初の青い点によるオープンバイトレードと最初の赤いドットによるオープンセルトレード 正しいストップロスはどこにありますか? 安全なストップロスは最初のドットにある可能性があります(最初の青いドットの買いの場合と最初の赤い点の売りの場合) 正しいテイクプロフィットはどこにありますか? テイクプロフィットはストップロス距離とRRに基づいて調整できるので、私の提案は2 RRで、ストップロスの2倍です。 利益を上げているのにtpを達成できなかった場合
FREE
Donchian Channel is an indicator created by Richard Donchian. It is formed by taking the highest high and the lowest low of the last specified period in candles. The area between high and low is the channel for the chosen period. Its configuration is simple. It is possible to have the average between the upper and lower lines, plus you have alerts when price hits one side. If you have any questions or find any bugs, please contact me. Enjoy!
FREE
STH, ITH & LTH ICT Indicator for MT5 – Free Download The STH, ITH & LTH Indicator is a specialized ICT tool designed for MetaTrader 5 (MT5) , utilizing Advanced Market Structure to identify key price highs across multiple timeframes. This indicator pinpoints short-term (STH), mid-term (ITH), and long-term (LTH) highs , providing traders with a broader perspective on market movements and price action behavior. «Indicator Installation & User Guide» MT5 Indicator Installation  |  STH & ITH & LTH IC
FREE
SUPERTREND; It is a trend following indicator based on the SuperTrend ATR created by Olivier Seban. It can be used to detect changes in trend direction and locate stops. When the price falls below the indicator curve, it turns red and indicates a downtrend. Conversely, when the price moves above the curve, the indicator turns green, indicating an uptrend. Like other indicators, it works well on SuperTrend when used in conjunction with other indicators such as MACD, parabolik SAR, Bollinger Band
FREE
Value Chart Candlesticks
Flavio Javier Jarabeck
4.73 (11)
The idea of a Value Chart indicator was presented in the very good book I read back in 2020 , " Dynamic Trading Indicators: Winning with Value Charts and Price Action Profile ", from the authors Mark Helweg and David Stendahl. The idea is simple and the result is pure genius: Present candlestick Price analysis in a detrended way! HOW TO READ THIS INDICATOR Look for Overbought and Oversold levels. Of course, you will need to test the settings a lot to find the "correct" one for your approach. It
FREE
The indicator is based on Robert Miner's methodology described in his book "High probability trading strategies" and displays signals along with momentum of 2 timeframes. A Stochastic oscillator is used as a momentum indicator. The settings speak for themselves period_1 is the current timeframe, 'current' period_2 is indicated - the senior timeframe is 4 or 5 times larger than the current one. For example, if the current one is 5 minutes, then the older one will be 20 minutes The rest of the s
FREE
Free automatic Fibonacci is an indicator that automatically plots a Fibonacci retracement based on the number of bars you select on the BarsToScan setting in the indicator. The Fibonacci is automatically updated in real time as new highest and lowest values appears amongst the selected bars. You can select which level values to be displayed in the indicator settings. You can also select the color of the levels thus enabling the trader to be able to attach the indicator several times with differe
FREE
Description : Rainbow MT5 is a technical indicator based on Moving Average with period 34 and very easy to use. When price crosses above MA and MA changes color to green, then this is a signal to buy. When price crosses below MA and MA changes color to red, then this is a signal to sell. The Expert advisor ( Rainbow EA MT5 ) based on Rainbow MT5 indicator is now available here . MT4 version is available here .
FREE
Coral trend is   a trend-following indicator that is widely popular among FOREX traders . It is usually used as a confluence with other indicators. It uses combinations of moving averages with complex smoothing formulas! It has two configurable parameters: Coefficient   - smoothing ratio (*) Applied price Calculation: Coral = (-0.064) * B6 + 0.672 * B5 - 2.352 * B4 + 2.744 * B3
FREE
This indicator is an automated version of the Fibonacci retracement (Fib) indicator. Deciding the best areas to use when drawing the fib can be tricky and this  indicator was made with that in mind. When you drop it on the chart it will automatically choose the best points to draw the fib with, but in case you aren't satisfied with those regions, you can adjust it as you wish.
FREE
This indicator is a straight port of a well known MetaTrader 4 indicator that is freely available on the Internet. It does not redraw at all. It implements a type of breakout strategy. The arrows indicate market direction. Use the indicator on M15 charts and higher. The indicator draws two bands near price action and generates signals when the price closes below the lower band and also above the upper band. The indicator uses periodic highs and lows to calculate upper and lower threshold bands.
FREE
Introduction Reversal Candles is a cutting-edge non-repainting   forex indicator designed to predict price reversals with remarkable accuracy through a sophisticated combination of signals. Signal Buy when the last closed candle has a darker color (customizable) and an up arrow is painted below it Sell when the last closed candle has a darker color (customizable) and a down arrow is painted above it
FREE
Are you tired of drawing trendlines every time you're analyzing charts? Or perhaps you would like more consistency in your technical analysis. Then this is for you. This indicator will draw trend lines automatically when dropped on a chart. How it works Works similar to standard deviation channel found on mt4 and mt5. It has 2 parameters: 1. Starting Bar 2. Number of bars for calculation The   starting bar   is the bar which drawing of the trend lines will begin, while the   number of bars for c
FREE
RSI on Moving Average Indicator for MT5 The RSI on MA Indicator integrates Moving Average Crossovers with the Relative Strength Index (RSI) to enhance trend detection and momentum analysis. By merging these technical elements, it improves precision in identifying market movements. The indicator displays two oscillating lines ranging from 0 to 100, making it easier to pinpoint buy and sell opportunities while clarifying trend directions. «Indicator Installation & User Guide» MT5 Indicator Instal
FREE
RSI abcd
Francisco Gomes Da Silva
RSI ABCDパターンファインダー:テクニカル戦略 1. インジケーターの仕組み 古典的RSI と ABCD調和パターン の自動検出を組み合わせたものです。 主要コンポーネント 標準RSI (調整可能な期間) 高値・安値マーカー (矢印) ABCDパターン (緑/赤の線) 過買(70)・過売(30)フィルター 2. MT5設定 period = 14 ; // RSI期間 size = 4 ; // 最大パターンサイズ OverBought = 70 ; // 過買水準 OverSold = 30 ; // 過売水準 Filter = USE_FILTER_ YES ; // 確認フィルター 3. 取引戦略 3.1. 買いエントリー(強気ABCD) 条件: RSIが以下を形成: 谷( A )→ 山( B )→ より高い谷( C ) D が過売域(30)より上だが C より下 確認:A-B-C-Dを結ぶ緑色の線 目標: TP1: B-Cの61.8% TP2: B-Cの100% ストップロス: D より下 3.2. 売りエントリー(弱気ABCD) 条件: RSIが以下を形成: 山( A
FREE
Weis Waves
Flavio Javier Jarabeck
2.83 (18)
The original author is David Weis, an expert in the Wyckoff Method. The Weis Wave is a modern adaptation of the 1930's Wyckoff Method, another expert in Tape Reading techniques and Chart Analysis. Weis Waves takes market volume and stacks it into waves according to price conditions giving the trader valuable insights about the market conditions. If you want to learn more about this subject you can find tons of videos in YouTube. Just look for "The Wickoff Method", "Weis Wave" and "Volume Spread
FREE
Indicator and Expert Adviser  EA Available in the comments section of this product. Download with Indicator must have indicator installed for EA to work. Mt5 indicator alerts for bollinger band and envelope extremes occurring at the same time. Buy signal alerts occur when A bullish candle has formed below both the lower bollinger band and the lower envelope  Bar must open and close below both these indicators. Sell signal occur when A bear bar is formed above the upper bollinger band and upper
FREE
Combining the best of Price Action , Directional Movement , and Divergence/Convergence analysis, Candle Color Trend is a easy and reliable way to identify trend direction. The indicator automatically paints the candles according to the assumption that an uptrend is defined by prices that form a series of higher highs and higher lows. In contrast, a downtrend is defined by prices that form a series of lower highs and lower lows. Additionally, ADX Wilder indicator is used to measure trend weakness
FREE
トレンドキャッチャー: アラートインジケーター付きのトレンドキャッチャーストラテジーは、市場トレンドやポテンシャルなエントリーポイントやエグジットポイントを特定するのに役立つ多目的な技術分析ツールです。動的なトレンドキャッチャーストラテジーを備えており、市場状況に適応してトレンドの方向を明確に視覚化します。トレーダーは、自身の好みやリスク許容度に合わせてパラメーターをカスタマイズできます。このインジケーターはトレンドの識別を支援し、ポテンシャルなリバーサルをシグナルし、トレイリングストップのメカニズムとして機能し、市場への迅速な対応のためのリアルタイムアラートを提供します。 特徴: - トレンドの識別:上昇トレンドと下降トレンドをシグナルします。 - トレンドのリバーサル:ローソク足の色が上昇から下降に変わった場合やその逆の場合に、ポテンシャルなリバーサルを警告します。 - リアルタイムアラート:新しいトレンドの識別に対するアラートを生成します。 推奨事項: - 通貨ペア:EURUSD、AUDUSD、XAUUSDなど... - タイムフレーム:H1。 - アカウントタイプ:
FREE
インジケーター   Haven FVG   は、市場を分析するためのツールで、チャート上で非効率性の領域(Fair Value Gaps、FVG)を特定することができ、トレーダーに価格分析と取引決定のための主要なレベルを提供します。 他の製品 ->  ココ 主な特徴: 個別のカラー設定: ブルFVGの色   (Bullish FVG Color)。 ベアFVGの色   (Bearish FVG Color)。 柔軟なFVGの視覚化: FVGを検索するための最大ローソク足数。 FVGゾーンの追加延長(特定のバー数)。 FVGの塗りつぶしを有効にするオプション。 中央線(Middle Line): 線の色とスタイルの選択(例:点線)。 線の太さの調整。 一般設定: FVGを現在のバーまで拡張。 塗りつぶしのある歴史的なFVGを除外し、最新のデータに焦点を当てる。 チャート上の非効率性の領域を分析し、根拠のある取引決定を行う簡単で効果的な方法。
FREE
インジケーター   "Haven Key Levels PDH PDL"   は、トレーダーがチャート上の重要なレベルを視覚化するのを支援します。次のレベルを自動的にマークします: DO (Daily Open)   — 日の開始レベル。 NYM (New York Midnight)   — ニューヨークの真夜中レベル。 PDH (Previous Day High)   — 前日の最高値。 PDL (Previous Day Low)   — 前日の最安値。 WO (Weekly Open)   — 週の開始レベル。 MO (Monthly Open)   — 月の開始レベル。 PWH (Previous Week High)   — 前週の最高値。 PWL (Previous Week Low)   — 前週の最安値。 その他の製品 ->  ここ ツールのカスタマイズオプション: 色とラインの太さの選択: レベルの色設定:   NYM, DO, WO, MO, PDH, PDL, PWH, PWL. ラインの太さの調整。 レベルの表示制御: レベルのライン表示のオン/オフ:
FREE
The Half ma arrow indicator for the MetaTrader 5 trading terminal is a simple but effective tool that gives a signal about a change in the current trend. The Half ma indicator looks like a solid dynamic line that changes color at the points where the trend changes. At these points, the indicator draws arrows of the corresponding color and direction.The Half ma arrow indicator for the MT5 terminal is not an independent source of input signals. It will be most effective to use it as a trend filte
SuperTrend for MT5
Ulises Calderon Bautista
5 (4)
人気のある「スーパートレンド」インジケーターは、金融市場でのトレンドの方向と可能なエントリーポイントまたはエグジットポイントを特定するのに役立つテクニカル分析ツールです。このインジケーターは、価格の範囲に基づいて市場のボラティリティを測定する平均真のレンジ(ATR)に基づいています。他のプラットフォームでは無料で提供されており、ここでも同様です! 一般的に次の3つの方法で使用されます: 現在のトレンドの特定:価格がこのラインの上にある場合、上昇トレンドと見なされ、価格が下にある場合は下降トレンドと見なされます。 ストップロスレベルとして使用されます。 ダイナミックなサポート/レジスタンスとして:上昇トレンドでは、このラインは価格の下にあり、ダイナミックなサポートレベルとして機能します。下降トレンドでは、このラインは価格の上にあり、ダイナミックなレジスタンスレベルとして機能します。
FREE
平均足(ヘイキンアシ)MT5インジケーター 平均足(ヘイキンアシ)MT5インジケーターは、標準的な価格データをより滑らかでトレンドに沿ったローソク足に変換し、市場トレンドや潜在的な反転ポイントをより簡単に識別できるようにする強力なツールです。 主な特徴: 明確なトレンド識別: 異なるローソク足の色で上昇トレンドと下降トレンドを視覚的に区別します。 ノイズの低減: 価格変動をフィルタリングし、 市場の主要な動きをより明確に表示します。 早期トレンド検出: 標準チャートでトレンドの変化が明らかになる前に、 潜在的なトレンド変化を予測します。 汎用性: 単独で使用することも、 他のテクニカル指標と組み合わせて総合的な分析を行うこともできます。 カスタマイズ可能な設定: インジケーターを特定の取引設定や戦略に合わせて調整できます。 メリット: トレンドを特定し、 潜在的なエントリーポイントと出口ポイントを識別する能力を向上させます。 市場ノイズの影響を減らし、 重要な価格変動に集中します。 市場ダイナミクスをより明確に理解することで、 より情報に基づいた取引決定を行うことができます。 検証済
FREE
High Low Open Close
Alexandre Borela
4.98 (43)
このプロジェクトが好きなら、5つ星レビューを残してください。 このインジケータは、指定されたためのオープン、ハイ、ロー、クローズ価格を描画します 特定のタイムゾーンの期間と調整が可能です。 これらは、多くの機関や専門家によって見られた重要なレベルです トレーダーは、彼らがより多くのかもしれない場所を知るために有用であり、 アクティブ。 利用可能な期間は次のとおりです。 前の日。 前週。 前の月。 前の四半期。 前年。 または: 現在の日。 現在の週。 現在の月。 現在の四半期。 現年。
FREE
インディケータはチャート上にトレンドラインを描画します。このインジケーターには6つの入力があります。ユーザーは両方の行に代替ラベルを指定できます。インジケーターの複数のインスタンスが使用される場合、ラベルは異なっている必要があります。ユーザーは、線の幅と色、および使用する重要なピークを指定する深さを設定できます。たとえば、Depth = 10は、現在の山と谷を使用してトレンドラインを設定します。この山と谷は、左右に少なくとも10本のバーがあり、高/低がピークの高/低よりも小さい/大きいです。インジケーターは、以前の山と谷もペイントします。インジケーターには、価格がサポート/レジスタンスラインから事前に設定された距離にあるときにユーザーに通知するために使用できるアラート機能が追加されています。アラート距離はピップで設定されます。
FREE
Super Trend Alert Indicator for MT5 is a powerful tool designed to help traders identify and follow market trends with precision. This indicator uses a proprietary algorithm to analyze price movements and provide clear trend signals, making it suitable for traders across all experience levels. You can find the MT4 version here Key features of the Super Trend Indicator include: Advanced trend analysis with real-time market scanning to detect potential trend directions. Real-time alerts that not
FREE
Dual RSI
Paul Conrad Carlson
3 (1)
Indicator alerts for Dual Relative strength index rsi. Large rsi preset at 14 is below 30 small rsi preset at 4 is below 10 for buy bullish signals . Large rsi preset are 14 is above 70 small rsi preset at 4 is above 90 for sell bearish signals . Includes mobile and terminal alerts. draws lines when alerts. This indicator can help identify extremes and then the tops or bottoms of those extremes .
FREE
このプロダクトを購入した人は以下も購入しています
トレンド スクリーナー インジケーターでトレンド取引の力を解き放ちます。ファジー ロジックと複数通貨システムを活用した究極のトレンド取引ソリューションです。 ファジー ロジックを活用した革新的なトレンド インジケーターである Trend Screener を使用して、トレンド取引を向上させます。 これは、13 を超えるプレミアム ツールと機能、および 3 つの取引戦略を組み合わせた強力なトレンド追跡インジケーターであり、Metatrader をトレンド アナライザーにする多用途の選択肢となります。 期間限定オファー : トレンド スクリーナー インジケーターは、わずか 100 ドルで生涯ご利用いただけます。 (元の価格 50$ ) (オファー延長) Trend Screener の 100% 非再描画精度の揺るぎない精度を体験して、取引の決定が過去の価格変動の影響を受けないようにしてください。 マルチタイムフレームおよびマルチ通貨機能の多用途性を解放し、比類のない自信を持って外国為替、商品、暗号通貨、インデックスの世界を取引できるようにします。 Trend Screener の包括的な
このインジケーターを購入された方には、以下の特典を 無料 で提供しています: 各トレードを自動で管理し、ストップロスとテイクプロフィットを設定し、戦略ルールに基づいてポジションを決済する補助ツール 「Bomber Utility」 様々な銘柄に合わせたインジケーターの設定ファイル(セットファイル) 「最小リスク」、「バランスリスク」、「待機戦略」 の3つのモードで使用できる Bomber Utility 用の設定ファイル このトレーディング戦略をすぐに導入・設定・開始できる ステップバイステップのビデオマニュアル ご注意: 上記の特典を受け取るには、MQL5のプライベートメッセージシステムを通じて販売者にご連絡ください。 オリジナルのカスタムインジケーター 「Divergence Bomber(ダイバージェンス・ボンバー)」 をご紹介します。これは、MACDのダイバージェンス(乖離)戦略に基づいた 「オールインワン」型のトレーディングシステム です。 このテクニカルインジケーターの主な目的は、価格とMACDインジケーターの間に発生するダイバージェンスを検出 し、将来の価格の動きを示す
PUMPING STATION – あなた専用の「オールインワン」戦略 PUMPING STATIONは、あなたのトレードをより楽しく、そして効果的に変えてくれる革新的なFXインジケーターです。ただの補助ツールではなく、強力なアルゴリズムを備えた本格的なトレーディングシステムで、より安定したトレードのスタートをサポートします。 この商品をご購入いただくと、以下の特典を無料でお付けします: 専用セットファイル:自動設定による最大パフォーマンスを実現。 ステップバイステップのビデオマニュアル:PUMPING STATION戦略の使い方を学べます。 Pumping Utility:PUMPING STATION専用の半自動トレードボットで、より快適かつシンプルな運用を可能にします。 ※ご購入後すぐにご連絡ください。追加リソースへのアクセスを提供いたします。 PUMPING STATIONの仕組み: トレンド管理:市場のトレンド方向を即座に判断。トレンドはあなたの最高の味方です。 エントリーサイン:チャート上の矢印で、取引のタイミングと方向を明確に示します。 明確な目標設定:インジケーターが自
Golden Trend Indicator MT5
Noha Mohamed Fathy Younes Badr
4.89 (18)
Golden Trend indicator  is The best indicator for predicting trend movement this indicator never lags and never repaints and never back paints    and give  arrow buy and sell    before the candle appear  and it will help you and  will make your trading decisions clearer its work on all currencies and  gold and crypto and all time frame This unique  indicator uses very secret algorithms to catch the  trends, so you can trade using this indicator and see the trend clear on charts  manual guide and
VERSION MT4        —        ИНСТРУКЦИЯ RUS           —        INSTRUCTIONS  ENG 主な機能: レンダリングなしで正確な入力信号! シグナルが表示されると、それは関連性を維持します。これは、シグナルを提供してからそれを変更し、その結果、入金された資金が失われる可能性があるリドローインジケーターとの重要な違いです。より高い確率と精度で市場に参入できるようになりました。矢印が表示された後、ターゲットに到達する (利益確定) か反転シグナルが表示されるまで、ローソク足に色を付ける機能もあります。 STOP-LOSS/TAKE-PROFITゾーンの表示 エントリーポイントを検索する際の視覚的な明瞭さを改善するために、最適な市場エントリーポイントが検索される購入/販売ゾーンを最初に表示するモジュールが作成されました。ストップロスレベルを操作するための追加のインテリジェントロジックは、時間の経過とともにそのサイズを縮小するのに役立ち、それによって取引に参加するときの初期リスクを軽減します(Move SL)。 より高いタイ
今、147ドル(いくつかの更新後に499ドルに増加します) - 無制限のアカウント(PCSまたはMac) RelicusRoad ユーザー マニュアル + トレーニング ビデオ + プライベート Discord グループへのアクセス + VIP ステータス 市場の新しい見方 RelicusRoad は、外国為替、先物、暗号通貨、株式、および指数の世界で最も強力な取引インジケーターであり、トレーダーに収益を維持するために必要なすべての情報とツールを提供します。初心者から上級者まで、すべてのトレーダーが成功するためのテクニカル分析と取引計画を提供します。これは、将来の市場を予測するのに十分な情報を提供する重要な取引指標です。意味をなさないチャート上のいくつかの異なる指標ではなく、完全な解決策を信じています.これは、信号、矢印 + 価格アクション情報を表示するオールインワンのインジケーターで、他に類を見ない非常に正確です。 強力な AI に基づいて、RelicusRoad は不足している情報とツールを提供して、あなたを教育し、トレーディングのプロ、成功したトレーダーにします。 ほと
サポートとレジスタンススクリーナーは、1つのインジケーター内に複数のツールを提供するMetaTraderの1つのレベルインジケーターにあります。 利用可能なツールは次のとおりです。 1.市場構造スクリーナー。 2.強気のプルバックゾーン。 3.弱気プルバックゾーン。 4.デイリーピボットポイント 5.毎週のピボットポイント 6.毎月のピボットポイント 7.ハーモニックパターンとボリュームに基づく強力なサポートとレジスタンス。 8.銀行レベルのゾーン。 期間限定オファー:HVサポートおよびレジスタンスインジケーターは、50ドルと生涯でのみご利用いただけます。 (元の価格125 $) MQL5ブログにアクセスすると、分析例を含むすべてのプレミアム指標を見つけることができます。 ここをクリックしてください。 主な機能 ハーモニックおよびボリュームアルゴリズムに基づく強力なサポートおよびレジスタンスゾーン。 ハーモニックおよびボリュームアルゴリズムに基づく強気および弱気のプルバックゾーン。  市場構造スクリーナー 毎日、毎週、毎月のピボットポイント。 ドキュメント すべてのサポートおよび
Gold Stuff mt5
Vasiliy Strukov
4.93 (179)
Gold Stuff mt5 は、金専用に設計されたトレンド指標であり、あらゆる金融商品にも使用できます。 インジケーターは再描画せず、遅れません。 推奨時間枠 H1. 設定と個人的なボーナスを得るために、購入後すぐに私に連絡してください!  トレンド スキャナーの強力なサポートを利用して、無料のインジケーターを入手し、プライバシーを守ります。あーみー!   設定 矢印を描く - オンオフ。 チャートに矢印を描く。 アラート - 可聴アラートのオンオフ。 メール通知 - オンオフ。 電子メール通知。 プチ通知 - オンオフ。 プッシュ通知。 次に、色域を調整します。 Gold Stuff mt5 は、金専用に設計されたトレンド指標であり、あらゆる金融商品にも使用できます。 インジケーターは再描画せず、遅れません。 推奨時間枠 H1. 設定と個人的なボーナスを得るために、購入後すぐに私に連絡してください!   設定 矢印を描く - オンオフ。 チャートに矢印を描く。 アラート - 可聴アラートのオンオフ。 メール通知 - オンオフ。 電子メール通知。 プチ通知 - オンオ
Matrix Arrow Indicator MT5
Juvenille Emperor Limited
5 (13)
マトリックスアローインジケーターMT5は、すべてのシンボル/商品(外国為替、商品、暗号通貨、インデックス、株式)で使用できる100%再描画されていないマルチタイムフレームインジケーターに続くユニークな10in1トレンドです。マトリックスアローインジケーターMT5は、初期段階で現在のトレンドを判断し、最大10の標準インジケーターから情報とデータを収集します。 平均方向移動指数(ADX) 商品チャネルインデックス(CCI) クラシック平研アシキャンドル 移動平均 移動平均収束発散(MACD) 相対活力指数(RVI) 相対力指数(RSI) 放物線SAR ストキャスティクス ウィリアムズのパーセント範囲 すべてのインジケーターが有効な買いまたは売りシグナルを与えると、対応する矢印がチャートに印刷され、次のろうそく/バーの開始時に強い上昇トレンド/下降トレンドを示します。ユーザーは、使用するインジケーターを選択し、各インジケーターのパラメーターを個別に調整できます。マトリックスアローインジケーターMT5は選択されたインディケーターからのみ情報を収集し、それらのデータのみに基づいてアローを印刷
MonetTrend — Премиум-индикатор для торговли по тренду (M30, H1, H4) MonetTrend — это мощный и визуально понятный трендовый индикатор, созданный для торговли на таймфреймах M30, H1 и H4. Он идеально подходит для работы с волатильными инструментами, такими как: • Золото (XAUUSD) • Криптовалюты (BTCUSD) • Валютные пары (EURUSD, USDJPY и др.) Ключевые особенности MonetTrend: • Автоматическое отображение Take Profit 1 (TP1) и Stop Loss (SL): После появления сигнала индикатор сразу показывает: • TP
FX Power: 通貨の強弱を分析して、より賢い取引を実現 概要 FX Power は主要通貨と金の実際の強弱をあらゆる市場状況で理解するための必須ツールです。強い通貨を買い、弱い通貨を売ることで、 FX Power は取引の意思決定を簡素化し、高い確率の取引機会を見出します。トレンドを追従する場合でも、極端なデルタ値を使用して反転を予測する場合でも、このツールはあなたの取引スタイルに完全に適応します。ただ取引するだけではなく、 FX Power で賢く取引をしましょう。 1. なぜ FX Power がトレーダーにとって非常に有益なのか 通貨と金のリアルタイム強弱分析 • FX Power は主要通貨と金の相対的な強弱を計算し、マーケットダイナミクスに関する明確な洞察を提供します。 • どの資産がリードしているか、または後れを取っているかを監視して、取引するペアを賢く選びましょう。 マルチタイムフレームの包括的なビュー • 短期、中期、長期のタイムフレームで通貨と金の強弱を追跡し、マーケットトレンドに基づいて取引戦略を調整できます。 • スキャルピングからスイングトレード
FX Volume MT5
Daniel Stein
4.82 (17)
FX Volume:ブローカー視点で捉える本物の市場センチメント クイック概要 トレード手法をさらに高めたいとお考えですか? FX Volume は、リテールトレーダーやブローカーのポジション状況をリアルタイムで提供します。これは、COTのような遅延レポートよりもはるかに早く知ることができます。安定した利益を目指す方も、さらなる優位性を求める方も、 FX Volume は大きな不均衡を見極め、ブレイクアウトを確認し、リスク管理を洗練させるのに役立ちます。今すぐ始めて、実際の出来高データがどのように意思決定を変革するかを体感してください! 1. FX Volume がトレーダーにとって非常に有益な理由 高精度の早期警戒シグナル • 各通貨ペアを売買しているトレーダー数を、他者よりも早く、ほぼリアルタイムで把握できます。 • FX Volume は、複数のリテールブローカーから得られる本物の出来高データを収集し、分かりやすい形式で提供する 唯一 のツールです。 強力なリスク管理 • ロングやショートの大きな偏り(インバランス)を特定し、潜在的なトレンド転換を見逃しません。ストップ
反転ゾーン / ピークボリューム / 主要プレーヤーのアクティブゾーン =       TS TPSプロシステム 説明書 RUS       /       説明書     英語     /           バージョン MT4        このインジケーターを購入したすべての購入者は、さらに以下を無料で受け取ります: RFI SIGNALS サービスからの取引シグナルへの 6 か月間のアクセス - TPSproSYSTEM アルゴリズムに従った既製のエントリ ポイント。 定期的に更新されるトレーニング資料 - 戦略に没頭し、プロフェッショナル レベルを高めます。 平日は 24 時間 365 日サポート、非公開のトレーダー チャットへのアクセス - コミュニケーション、サポート、市場状況の分析。 著者の設定ファイル - 余分な労力をかけずに最大の結果を達成するための自動インジケーター設定。 主な機能: 売り手と買い手のアクティブなゾーンを表示します。 このインジケーターは、購入と販売の正しい最初のインパルス レベル/ゾーンをすべて表示します。これらのレベル/ゾーンがアクティブに
Quantum TrendPulse を ご紹介します。これは、   SuperTrend   、   RSI   、および Stochastic のパワーを 1 つの包括的なインジケーターに組み合わせて、取引の可能性を最大限に引き出す究極の取引ツールです。精度と効率を求めるトレーダー向けに設計されたこのインジケーターは、市場のトレンド、勢いの変化、最適なエントリー ポイントとエグジット ポイントを自信を持って特定するのに役立ちます。 主な特徴: SuperTrend 統合: 現在の市場動向に簡単に追従し、収益性の波に乗ることができます。 RSI精度: 買われすぎと売られすぎのレベルを検出し、市場の反転のタイミングに最適で、SuperTrendのフィルターとして使用されます。 確率的精度: 確率的振動を活用して、変動の激しい市場で隠れたチャンスを見つけます。SuperTrend のフィルターとして使用されます。 マルチタイムフレーム分析:   M5 から H1 または H4 まで、さまざまなタイムフレームで市場を常に把握します。 カスタマイズ可能なアラート: カスタム取引条件が満たされ
FX Levels: あらゆる市場における非常に高精度なサポート&レジスタンス 概要 通貨ペア、株式指数、個別銘柄やコモディティなど、どのような市場でも信頼できるサポートとレジスタンスを特定したいですか? FX Levels は伝統的な “Lighthouse” メソッドと先進的な動的アプローチを融合し、ほぼ汎用的な精度を実現します。ブローカーの実務経験を活かし、自動化されたデイリー更新とリアルタイム更新を組み合わせることで、 FX Levels は反転ポイントを見つけ、利益目標を設定し、自信をもってトレードを管理するための手助けをします。今すぐ試してみて、サポート/レジスタンス分析の正確性がどれほどトレードを向上させるかを実感してください! 1. FX Levels がトレーダーにとって非常に有用な理由 非常に正確なサポート&レジスタンスゾーン • FX Levels は異なるブローカー環境でもほぼ同一のゾーンを生成するよう設計されており、データフィードの差異や時刻設定のずれによる不一致を解消します。 • つまり、どのブローカーを利用していても一貫したレベルが得られるため、戦
FourAverageは、トレンド検出の新しい単語です。 情報技術の発展と多数の参加者に伴い、金融市場は時代遅れの指標による分析にあまり適していなくなっています。 移動平均や確率などの従来のテクニカル分析ツールは、純粋な形でトレンドの方向やその反転を決定することはできません。 1つの指標は、14年の歴史に基づいて、そのパラメータを変更することなく、将来の価格の正しい方向を示すことができますか? 同時に、横向きの市場の動きで妥当性を失うことはありませんか? 答え:はい、それはできます。 私たちのチームは、変化する市場の状況に適応するためのかなり強力で効果的なメカニズムを持つ指標を開発しました。 2025年には、主要なトレンド指標"Four平均"は開発の新しい段階に入っています。 現代の暗号通貨と株式市場は、この指標のために作成されたようです。 独自の平滑化式を使用すると、通貨ペアまたは他の楽器の任意の機能のための指標を調整(パターンを識別)することができます。 さて、利益を上げるためには、1つの指標で十分であり、これはほんの始まりに過ぎません。 他のツールと組み合わせて、または信号フィル
「Entry In The Zone」と「SMC Multi Timeframe」は、スマートマネーコンセプト(SMC)に基づいたリアルタイム市場分析ツールです。このツールは、反転信号を効果的に統合し、マルチタイムフレーム構造検出を通じて主要な反転ゾーンを自動的に識別します。また、注目すべきポイント(POI)の識別も行います。これにより、トレーダーはより自信を持って、より構造化されたアプローチで取引計画を立て、意思決定を行うことができます。 主な機能: 自動市場構造検出(BOS CHoCH、mBOS mCHoCH) オーダーブロック、供給と需要ゾーン、フェアバリューギャップ(FVG)の識別 流動性ゾーン、プレミアムおよびディスカウントエリア、同一高値および同一安値 注目すべき同一高値 & 同一安値イント(POI) 取引セッションのタイミング(東京、ロンドン、ニューヨーク) 独自の取引スタイルに合わせたカスタマイズ可能なダッシュボード リアルタイムでの動作、シグナルの再描画なし。完全なマルチタイムフレームカバレッジで 自信を持った取引決定をサポートします。 *** SMC | スマー
MetaBands M5
Vahidreza Heidar Gholami
4.5 (2)
MetaBandsは、強力でユニークなアルゴリズムを使用してチャンネルを描画し、トレンドを検出して、トレーダーに取引の入出ポイントを提供することができます。チャンネル指標に加えて、強力なトレンド指標でもあります。入力パラメータを使用して新しいチャンネルを作成するために、異なるタイプのチャンネルを統合することができます。MetaBandsは、市場のイベントについてユーザーに通知するために、すべてのタイプのアラートを使用します。 特徴 ほとんどのチャンネルアルゴリズムをサポート 強力なトレンド検出アルゴリズム 異なるタイプのチャンネルを統合する能力 マルチタイムフレームおよびマルチカレンシー(シグナルマトリックス) すべてのタイプのアラート機能(サウンド、画面フラッシャー、プッシュ通知、メール、ポップアップ、矢印) 再描画しない トレンド検出 MetaBandsは、チャネル内を振動する青いラインを使用してトレンドを検出します。ラインがチャネルの上部バンドに達すると、下降トレンドの開始を示し、下部バンドに達すると上昇トレンドの開始を示します。青いラインが中心ラインに近づくと、市場はコンソリ
MONEYTRON – ТВОЙ ЛИЧНЫЙ СИГНАЛ НА УСПЕХ! XAUUSD | AUDUSD | USDJPY | BTCUSD Поддержка таймфреймов: M5, M15, M30, H1 Почему трейдеры выбирают Moneytron? 82% успешных сделок — это не просто цифры, это результат продуманной логики, точного алгоритма и настоящей силы анализа. Автоматические сигналы на вход — не нужно гадать: когда покупать, когда продавать. 3 уровня Take Profit — ты сам выбираешь свой уровень прибыли: безопасный, уверенный или максимум. Четкий Stop Loss — контролируешь риск
まず第一に、この取引インジケーターは再描画されず、再描画されず、遅延しないことを強調する価値があります。これにより、手動取引とロボット取引の両方に理想的なものになります。 ユーザーマニュアル:設定、入力、戦略。 アトミックアナリストは、価格の強さとモメンタムを利用して市場でより良いエッジを見つけるためのPA価格アクションインジケーターです。ノイズや誤ったシグナルを除去し、取引ポテンシャルを高めるための高度なフィルターを備えています。複雑なインジケーターの複数のレイヤーを使用して、アトミックアナリストはチャートをスキャンし、複雑な数学的計算をシンプルなシグナルと色に変換します。これにより、どのような初心者トレーダーでも理解して使用し、一貫した取引の決定を行うことができます。 「アトミックアナリスト」は、新規および経験豊富なトレーダー向けにカスタマイズされた包括的な取引ソリューションです。プレミアムインジケーターとトップノッチの機能を1つの取引戦略に組み合わせ、すべてのタイプのトレーダーにとって汎用性のある選択肢にします。 デイリートレーディングとスキャルピング戦略:高速で正確なデイ
まず第一に、この取引ツールはノンリペイント、ノンリドロー、ノンラグの指標であり、プロの取引に理想的ですことを強調する価値があります。 オンラインコース、ユーザーマニュアル、デモ。 スマートプライスアクションコンセプトインジケーターは、新米から経験豊富なトレーダーまで、非常 に強力なツールです。Inner Circle Trader AnalysisやSmart Money Concepts Trading Strategiesなど、20以上の有用な指標を1つに組み合わせています。このインジケーターはスマートマネーコンセプトに焦点を当て、大手機関の取引方法を提供し、彼らの動きを予測するのに役立ちます。 特に、流動性分析に優れており、機関がどのように取引しているかを理解しやすくしています。市場のトレンドを予測し、価格の動きを慎重に分析するのに優れています。機関の戦略とトレードを合わせることで、市場の動向についてより正確な予測ができます。このインジケーターは多目的であり、市場構造を分析し、重要な注文ブロックを特定し、さまざまなパターンを認識するのに優れています。 このインジケーター
CBT Quantum Maverick 高効率バイナリーオプション取引システム CBT Quantum Maverickは、高いパフォーマンスとシンプルさを追求するトレーダー向けに設計されたバイナリーオプション取引システムです。カスタマイズの必要がなく、最適化された状態で使用を開始できます。シグナルに従うだけで、少しの練習でマスターできます。 主な特徴: シグナルの精度: 現在のローソク足を基に次のローソク足の取引シグナルを生成し、頻繁な再描画がありません。 多様な市場対応: バイナリーオプション取引に特化し、さまざまなブローカーや資産クラスに対応しています。 対応可能: Deriv Synthetic Charts :すべてのタイムフレームで使用可能。 OTCチャート :Quotex、PocketOption、Binomo、Stockity、IQOption、Exnova、OlympTrade、Deriv、Binolla、Homebrokerなどのブローカーに対応。MT5へのインポートは最初の1週間無料、その後は有料サービス。 FX、仮想通貨、商品市場 :幅広い資産利用が可能
このダッシュボードは、選択されたシンボルの最新の利用可能なハーモニックパターンを表示するので、時間を節約し、より効率的に /   MT4バージョン 。 無料インジケーター:   Basic Harmonic Pattern インジケーター列 Symbol : 選択したシンボルが表示されます。 Trend :   強気または弱気 Pattern : パターンの種類(ガートレー、バタフライ、バット、カニ、サメ、サイファー、ABCD) Entry : エントリー価格 SL: ストップロス価格 TP1: 1回目の利食い価格 TP2: 2回目の利食い価格 TP3:   3回目の利食い価格 Current price :   現在値 Age (in bars):    最後に描画されたパターンの年齢 主な入力項目 Symbols:   "28 Major Currency Pairs "または "Selected Symbols "から選択。 Selected Symbols:   カンマで区切られた監視したいシンボル("EURUSD,GBPUSD,XAUUSD")。ブローカーがペアに接
トレンド検出インジケーターはあらゆる戦略を補完し、独立したツールとしても使用できます。 インジケーターの操作に関する推奨事項、コメント   #8   でダウンロードできます 利点 使いやすく、不要な情報でチャートを過負荷にしません。 あらゆる戦略のフィルターとして使用できます。 利益を得るのとストップロスを設定するの両方に使用できる動的なサポートとレジスタンスのレベルが組み込まれています。 ローソク足が閉じた後、インジケーターの色は変わりません。  株式市場、指数、石油、金、およびすべての時間枠で機能します。 トースト通知、電子メール通知、プッシュ通知、サウンドアラートの機能があります。 私の他の開発はここで見つけることができます: https://www.mql5.com/ja/users/mechanic/seller 入力パラメータ Alert-オン/オフ。アラート; Push Notification-オン/オフ。プッシュ通知; Mail-オン/オフ電子メール通知; Fibo 1,2,3,4,5,6,7,11,21,31,41,51,61,71-動的サポートと抵抗レベル
IX Power: 指数、商品、暗号資産、外国為替市場の洞察を発見 概要 IX Power は、指数、商品、暗号資産、外国為替市場の強弱を分析するための多用途ツールです。 FX Power が全ての利用可能な通貨ペアデータを活用して外為ペアで最高の精度を提供する一方、 IX Power は基礎資産の市場データにのみ焦点を当てています。この特性により、 IX Power は非外為市場に最適であり、単純な外為分析にも信頼性の高いツールです。どのチャートでもスムーズに機能し、取引判断を向上させるための明確で実行可能な洞察を提供します。 1. IX Power がトレーダーにとって価値がある理由 複数市場での強弱分析 • IX Power は指数、商品、暗号資産、外為シンボルの強弱を計算し、それぞれの市場に合わせた洞察を提供します。 • US30、WTI、ゴールド、ビットコイン、または通貨ペアなどの資産を監視して取引機会を発見できます。 幅広い市場に適応 • 外為取引では、 FX Power が関連する全ての通貨ペアを分析することで比類のない精度を提供します。 • IX Power
FX Dynamic: カスタマイズ可能なATR分析でボラティリティとトレンドを把握 概要 FX Dynamic は平均的な真のレンジ(ATR)の計算を活用して、日次および日中ボラティリティに関する卓越した情報をトレーダーに提供する強力なツールです。80%、100%、130%などのボラティリティ閾値を設定することで、通常の範囲を超えた際にすぐに警告を受け取ったり、有望な利益機会を素早く捉えられます。 FX Dynamic はブローカーのタイムゾーンに合わせて調整でき、安定したボラティリティ測定を維持しながら、リアルタイム分析のためにMetaTraderとシームレスに連携します。 1. なぜFX Dynamicがトレーダーにとって非常に有益か リアルタイムのATRインサイト • 日次・日中のボラティリティをひと目で把握。価格がATRの80%、100%、130%などに達したときに警告を受け取り、重要な水準にあるかどうかを確認できます。 • ボラティリティが完全に爆発する前に潜在的な反転やブレイクアウトを先取り可能。 幅広いマーケットへの適用 • 外国為替、コモディティ、株価指数な
まず最初に、このトレーディングインジケーターは「再描画なし」「再描画なし」「遅延なし」であることを強調する価値があります。これにより、手動取引とアルゴリズム取引の両方に最適です。 ユーザーマニュアル、プリセット、オンラインサポートが含まれています。 AI Trend Pro Maxは、精度、力、シンプルさを求めるトレーダーのために設計された洗練されたオールインワンのトレーディングシステムです。以前のインジケーターを通じて何年もの開発を経ており、これは現在までの最も進化したバージョンで、複数の信号層、プロフェッショナルグレードのフィルター、およびスマートなユーザーインターフェースを備えています。 初心者でもプロのトレーダーでも、AI Trend Pro Maxは、どんな市場状況でも自信を持って取引するために必要なすべてを提供します。 主要な戦略とシステムのロジック: マルチレイヤー信号エンジン:トレンドモメンタム、価格強度、ボリューム、RSI、ボリンジャーバンド、そしてキャンドルカラー論理を組み合わせ、高確率のエントリーを提供します。 トレンドモメンタム:トレンドが強化されているの
The Trend Forecaster indicator utilizes a unique proprietary algorithm to determine entry points for a breakout trading strategy. The indicator identifies price clusters, analyzes price movement near levels, and provides a signal when the price breaks through a level. The Trend Forecaster indicator is suitable for all financial assets, including currencies (Forex), metals, stocks, indices, and cryptocurrencies. You can also adjust the indicator to work on any time frames, although it is recommen
Auto Order Block with break of structure based on ICT and Smart Money Concepts (SMC) Futures Break of Structure ( BoS )             Order block ( OB )            Higher time frame Order block / Point of Interest ( POI )    shown on current chart           Fair value Gap ( FVG ) / Imbalance   -  MTF      ( Multi Time Frame )    HH/LL/HL/LH  -  MTF      ( Multi Time Frame )  Choch  MTF      ( Multi Time Frame )  Volume Imbalance     ,  MTF          vIMB Gap’s Power of 3 Equal High / Low’s  
Easy Buy Sell is a market indicator for opening and closing positions. It becomes easy to track market entries with alerts. It indicates trend reversal points when a price reaches extreme values ​​and the most favorable time to enter the market. it is as effective as a Fibonacci to find a level but it uses different tools such as an algorithm based on ATR indicators and Stochastic Oscillator. You can modify these two parameters as you wish to adapt the settings to the desired period. It cannot
作者のその他のプロダクト
Refined Order Block Indicator for MT5 Designed with the principles of ICT and Smart Money strategies, the Refined Order Block (OBR) indicator is an essential tool for traders on the MetaTrader 5 (MT5) platform. It identifies and highlights significant price levels by marking bullish order blocks in green and bearish order blocks in brown. These levels represent potential price reversal areas, often influenced by large institutional and bank orders. As price reaches these key zones, it is likely
FREE
TP & SL Calculator Indicator for MT5    The Take Profit & Stop Loss Calculator Indicator serves as a valuable risk and capital management tool for determining and setting take profit (TP) and stop loss (SL) levels . These levels can be easily drawn directly on the chart using the indicator. This tool enhances capital management by providing a separate box that includes the following features: The ability to create and manage take profit and stop loss levels for both Buy and Sell positions; Det
FREE
Easy Trade Manager Expert in MT5  The Easy Trade Manager Expert is a risk and position management tool for MetaTrader 5 . This specialized product offers a panel for easily setting Stop Loss and Take Profit levels in several straightforward ways. The management panel includes settings, a theme change for the chart, and a Risk to Reward ratio calculation based on user input. «Indicator Installation & User Guide» MT5 Indicator Installation  |  Easy Trade Manager MT4  | ALL Products By   TradingFin
FREE
Three 3TP Easy Trade Pad Expert for MetaTrader 5  The 3TP Easy Trade Pad Expert is an advanced, specialized tool for capital management, risk management, and trading in the MetaTrader 5 (MT5) platform, designed.This expert utilizes a special panel to provide specialized functionalities for trade management. Key features of this expert include setting the risk-to-reward ratio, calculating stop loss , setting multiple take profits , and managing both take profits and stop losses, alongside other p
FREE
Risk Reward Ratio Calculator Indicator MT5 The R/R Ratio Calculator is an essential tool designed to help traders set Take Profit and Stop Loss levels directly on the chart while analyzing each trade's risk reward ratio . This indicator features a user-friendly management panel for adjusting levels and a movable box that clearly displays the Take Profit , Entry Point , and Stop Loss values. Traders can create these levels using two methods either by dragging the lines on the chart or by manually
FREE
Order Block Indicator for MT5 The Order Block Indicator (OB) is a highly efficient tool tailored for traders utilizing ICT and Smart Money trading methodologies. Specifically built for the MetaTrader 5 (MT5) platform, this indicator enables traders to pinpoint crucial price zones where major financial institutions execute their orders. These areas often act as key decision points, where price movements tend to reverse after encountering liquidity. Traders can leverage this tool to refine their
FREE
Market Structure Indicator BOS CHOCH MT5 The Market Structure Indicator (BOS-CHOCH) is a specialized ICT-style tool designed for MetaTrader 5 (MT5) . This indicator detects both primary and secondary market character shifts (CHOCH) and breaks in structure (BOS) across multiple levels, offering valuable insights for ICT and Smart Money traders . By helping traders analyze price behavior, it enhances market structure recognition and provides more precise trade opportunities. «Indicator Installati
FREE
Trade Assistant Expert TF MT5 The Trade Assistant Expert is a specialized trading tool developed for MetaTrader 5, featuring an interactive chart-based control panel for seamless trade execution and risk oversight. This expert advisor incorporates key functionalities such as automatically adjusting Stop Loss to the entry point (Break Even), activating Trailing Stop, and displaying the countdown until the next candlestick formation. «Indicator Installation & User Guide» MT5 Indicator Installation
FREE
BOS and CHOCH with Label Indicator MT5  The BOS-CHOCH market structure shift detector is an advanced tool designed for traders who analyze internal price movements on the MetaTrader 5 (MT5) platform . This indicator leverages sophisticated algorithms to cater specifically to traders following ICT (Inner Circle Trader) and Smart Money trading methods . It automatically detects Break of Structure (BOS) and Change of Character (CHOCH) and marks them on the chart with clearly labeled annotations. A
FREE
Refined Order Block Indicator for MT4 The Refined Order Block (OBR) indicator is a specialized tool tailored for traders utilizing ICT and Smart Money (SMC) methodologies on the MetaTrader 4 (MT4) platform. This indicator pinpoints bullish order blocks in green and bearish order blocks in brown, assisting traders in recognizing pivotal market zones. Order block regions are critical price areas where substantial institutional orders can heighten the probability of trend reversals or directional
FREE
Fair Value Gap Void MT5 The Fair Value Gap and Void (FVG + Void) indicator is specifically designed for ICT and Smart Money (SMC) traders, utilizing sophisticated algorithms to detect and highlight imbalance zones and FVGs on price charts. This tool is tailored for the MetaTrader 5 (MT5) platform, where bullish FVGs are represented in green and bearish FVGs in brown, allowing traders to quickly recognize critical trading areas. When the price revisits these zones, the indicator marks the portio
FREE
Easy Trade Manager Expert in MT4   The Easy Trade Manager Expert is a specialized product designed for effective trade management and risk reduction within the MT4 platform. This tool features a user-friendly panel to easily set Stop Loss and Take Profit levels automatically. The management panel includes settings for adjusting chart themes and calculating the Risk-to-Reward ratio. «Indicator Installation & User Guide» MT4 Indicator Installation  |  Easy Trade Manager Expert MT5   | ALL Product
FREE
ZigZag Indicator for MT5 The ZigZag Indicator is a valuable tool available in MetaTrader 5, designed to highlight the highs and lows on a price chart. By marking pivotal turning points in price—commonly referred to as Pivot Highs and Lows (HH-HL-LH-LL)—it simplifies the process of identifying price trends. In any price movement, consecutive peaks and troughs are formed. Understanding these patterns correctly is essential for recognizing the direction of the overall market trend or short-term fl
FREE
BOS and CHOCH with Label Indicator MT4  The BOS-CHOCH with Label Indicator is an essential tool for traders who employ ICT and Smart Money trading strategies. Utilizing a sophisticated algorithm, this indicator detects and marks price structure breakouts (known as BOS, or Break of Structure) and shifts in market behavior (CHOCH, or Change of Character) directly on the chart. By showcasing every structural shift and market transformation, traders can efficiently observe both significant and subt
FREE
Fair Value Gap (FVG) Indicator for MetaTrader 4 – Download and Guide Traders rely on a variety of tools and strategies to discover profitable investment opportunities. Among these, the Fair Value Gap (FVG) indicator in MetaTrader 4 stands out as a highly effective tool. An FVG represents a price gap within the market structure where supply and demand are not balanced. These gaps emerge during sharp price movements. In simple terms, when three candlesticks form, the gap between the first and thi
FREE
Risk Reward Ratio Calculator Indicator MT4 The Risk Reward Ratio Calculator Indicator is a practical tool that helps traders easily define take profit (TP) and stop loss (SL) levels, while calculating the risk-to-reward ratio (R/R) for each trade. This indicator includes a management panel where traders can set the TP, SL, and R/R values. The indicator displays TP and SL levels as green and red boxes, respectively. These boxes are adjustable, allowing traders to either manually set the levels o
FREE
TP & SL Calculator Indicator for MT4 The Take Profit & Stop Loss Calculator Indicator is a valuable tool designed for the MetaTrader 4 platform . It enables traders to calculate and display the profit and loss for each trade. This indicator features a dedicated management box that provides several essential tools for efficient trade handling, including: Creating Take Profit and Stop Loss levels for buy and sell positions ; Determining trade volume in lots; Displaying the Risk to Reward (R/R) ra
FREE
Order Block Indicator for ICT and Smart Money Trading in MT4 The Order Block Indicator is an essential tool for traders using ICT (Inner Circle Trader) and Smart Money Concepts on the MetaTrader 4 (MT4) platform. This indicator helps identify crucial price zones where institutional orders are likely to be concentrated, allowing traders to pinpoint potential reversals or high-impact market levels. Bullish order blocks appear in green , while bearish order blocks are displayed in brown . When pri
FREE
Improved Fair Value Gap Void MT5 The Improved Fair Value Gap (iFVG + Void) indicator for MetaTrader 5 is an advanced iteration of the traditional Fair Value Gap "FVG" indicator. Fair Value Gaps emerge following sharp price movements, marking crucial zones where supply and demand are unbalanced. Price action often gravitates back to these levels. This indicator visually marks bullish Fair Value Gaps (FVG) with green boxes and bearish Fair Value Gaps with red boxes. Additionally, it shades the us
FREE
Market structure indicator BOS CHOCH MT4 The BOS-CHOCH Market Structure Indicator is an ICT-style tool developed for MetaTrader 4 (MT4). It is designed to assist traders who follow ICT methodologies in recognizing shifts in the market’s dominant and secondary trends. By pinpointing structural breakouts and market character changes, traders can refine their technical analysis for more precise decision-making. «Indicator Installation & User Guide» MT4 Indicator Installation  |    Market structur
FREE
Order Block Void Indicator MT5 The Order Block + Void Indicator in MetaTrader 5 is an advanced tool designed to detect key liquidity areas and highlight them as order blocks. These zones are frequently utilized by institutional traders, making them ideal reference points for determining support and resistance levels. This indicator visually marks bullish order blocks with green boxes and bearish order blocks with red boxes. Additionally, once an order block is consumed, it turns gray to indic
FREE
Three 3TP Easy Trade Pad Expert for MT4 Download  The 3TP Easy Trade Pad Expert is a specialized tool developed for capital management , risk management, and trading on the MetaTrader 4 (MT4) platform. This advanced tool, with its functional and specialized panel, allows traders to easily manage their stop loss (SL) and take profit (TP) levels. This expert includes features for setting acceptable loss and expected profit (R/R) and managing trades with advanced options, providing traders with a p
FREE
Order Block Void Indicator MT4 Order Blocks represent critical price zones where institutional traders place significant buy and sell orders. These areas often serve as key support and resistance levels on price charts. The Order Block + Void indicator for MetaTrader 4 autonomously marks these order blocks on the chart. One of its notable features is displaying the percentage of the order block that has been utilized, turning the consumed section gray. This tool highlights bullish order blocks
FREE
Propulsion Block Indicator for MT5 The Propulsion Block Indicator (ICT Propulsion Block) in MetaTrader 5 is an advanced analytical tool designed to detect price shifts and liquidity zones. These propulsion blocks emerge after the last candle revisits an order block, absorbing liquidity following notable price movements. This indicator pinpoints critical areas where order blocks intersect with Supply and Demand Zones , automatically updating the chart once the price enters one of these designate
FREE
Rejection Block Indicator and Void MT5 The Rejection Block Indicator is a powerful tool designed to detect market reversal zones in MetaTrader 5 . By analyzing candle wicks, this indicator marks crucial rejection block areas where long upper shadows near price highs and lower shadows near price lows act as potential reversal points. Additionally, the Void (absorbed portion) within the rejection blocks is highlighted in gray. Once this void is entirely filled, it signals that the level has lost
FREE
Download the Laguerre RSI Indicator for MT5    The Laguerre RSI indicator is a powerful trend-following oscillator designed for MetaTrader 5. It can function independently as a trading tool or serve as a supporting confirmation indicator within broader strategies. Unlike the traditional RSI, it significantly reduces signal lag, particularly in extended time frames. Additionally, it employs a gamma (Γ) filter that minimizes price fluctuations, leading to fewer misleading signals. «Indicator Ins
FREE
Easy Reward to Risk RRR Indicator for MT5 The Easy Reward to Risk RRR Indicator is a powerful trading assistant that streamlines technical analysis. It calculates and visualizes the risk-to-reward ratio in real time. This tool simplifies trading decisions by displaying two distinct areas on the chart a red zone for stop-loss levels and a green zone for take-profit levels . These zones help traders visualize potential losses and gains . «Indicator Installation & User Guide» MT5 Indicator Install
FREE
Unicorn Indicator MT5 The Unicorn Indicator is a sophisticated MetaTrader 5 tool designed to identify price gaps and highlight them using Breaker Blocks on the price chart. A Breaker Block represents an order block that initially gets broken but later acts as a strong support level when the price revisits it. A Unicorn zone emerges when a Breaker Block coincides with a Fair Value Gap (FVG). The indicator visually marks bullish Unicorn zones in green and bearish Unicorn zones in red, displaying
FREE
Trade Assistant Expert TF MT4 The Trade Management Assistant is a specialized trading tool designed to enhance capital allocation and mitigate risks within the MetaTrader 4 (MT4) environment. This expert advisor features an intuitive control panel that facilitates seamless trade execution, risk oversight, and fund distribution. It also incorporates key functionalities such as automatic breakeven adjustments and a Trailing Stop system for optimized trade security. «Indicator Installation & User
FREE
Fair Value Gap (FVG) Indicator for MetaTrader 5 The Fair Value Gap (FVG) Indicator is an effective tool designed to spot trading opportunities in MetaTrader 5 by identifying imbalances in supply and demand. These imbalances, known as FVGs, emerge when the price moves aggressively. To explain simply, imagine three candlesticks: the gap between the first and third candlestick forms the " FVG ." This indicator highlights these gaps as dynamic boxes—green for bullish FVGs and red for bearish FVGs.
FREE
フィルタ:
レビューなし
レビューに返信