Liquidity indicator 2
- インディケータ
- Tomas Bystriansky
- バージョン: 1.0
- アクティベーション: 5
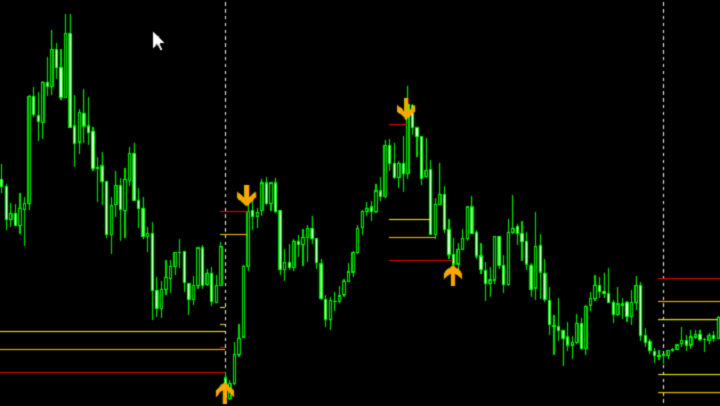
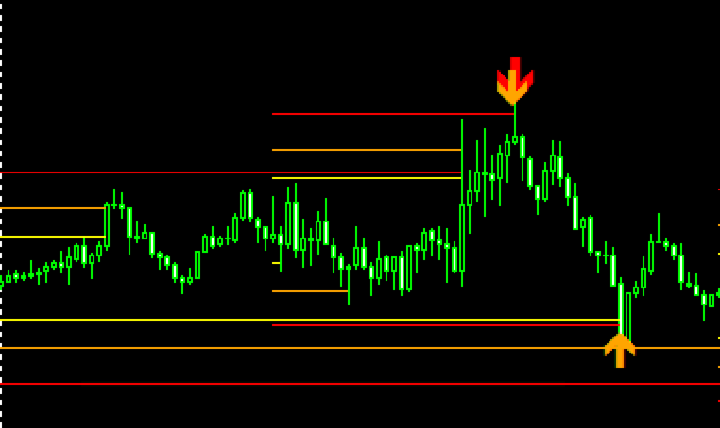
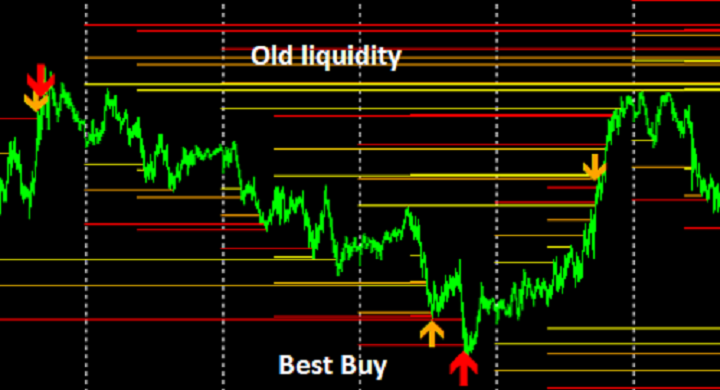
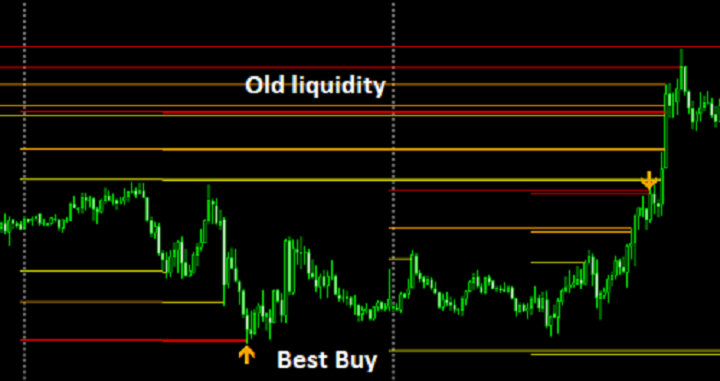
The indicator is based on the calculation of liquidity on the market and thus shows where the market can most likely turn..
It shows the places of liquidity where the price will reach sooner or later...
The indicator can be set to several types of liquidity and therefore can display several levels on the graph..
It is a unique tool that can help you very well in your trading
The indicator is suitable for currency pairs with the most liquidity (Forex,EURUSD,GBPUSD...)
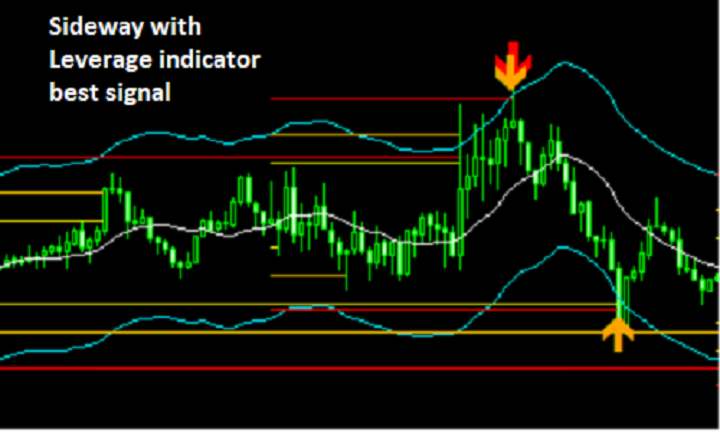
The indicator is suitable for markets that are in sideways movement, I recommend combining it with my Leverage indicator for the best signals
I wish you a lot of fun with the indicator because it will give you a completely different view of the chart.