• 概要
  • レビュー
  • コメント

Heat map Indicator

📊 Dynamic Heatmap for MetaTrader 5 — Instantly Spot Market Opportunities

Revolutionize the way you see the markets with the most complete and intelligent Heatmap for MetaTrader 5.

Designed for traders who demand speed and clarity in decision-making, our Heatmap creates a powerful visual representation of market performance in real time.

🚀 Key Benefits

Instant Read of Market Strength

  • Instantly see which assets are leading or lagging.

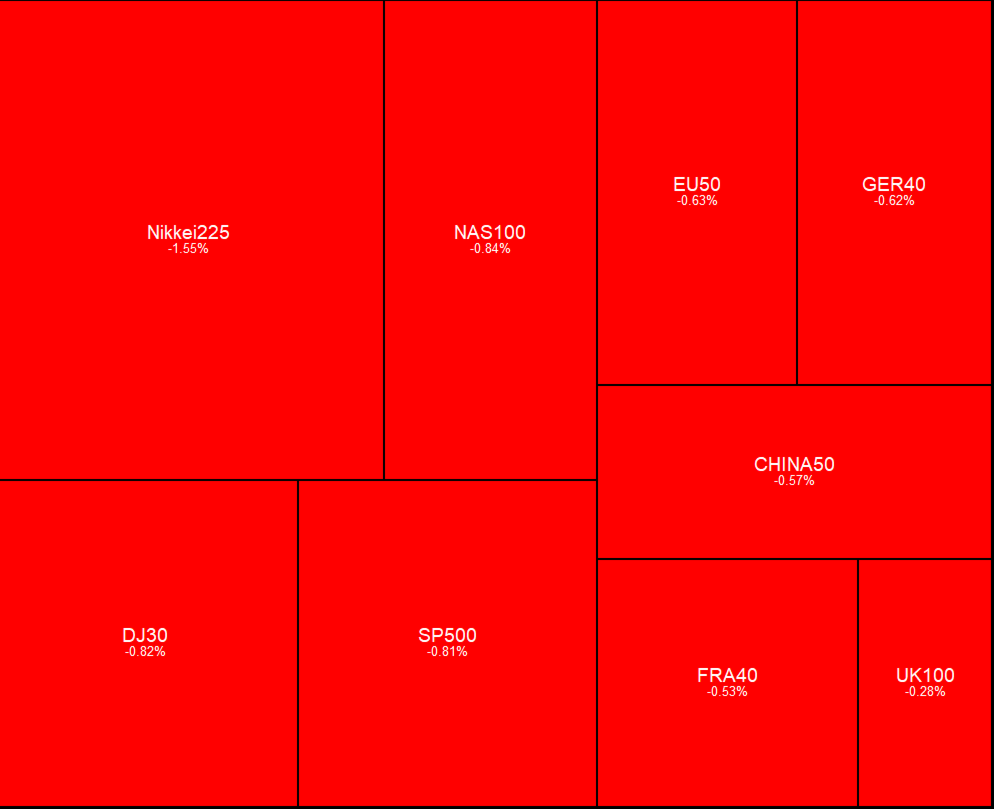
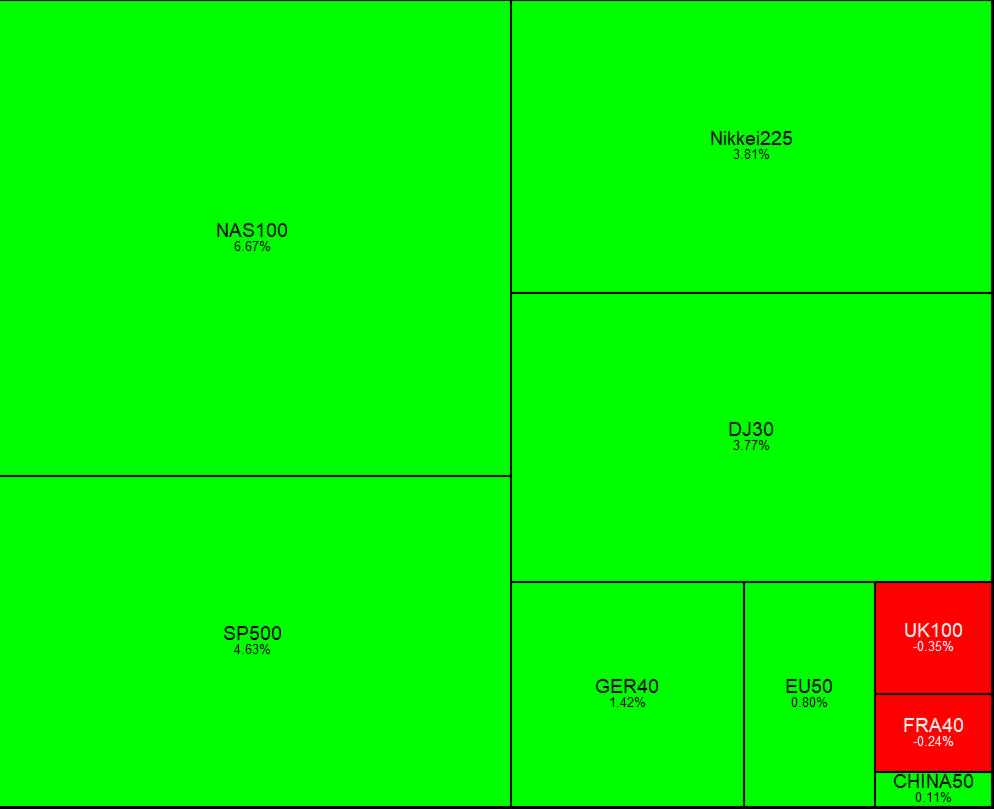
  • Dynamic color coding for quick identification: green for rising assets, red for falling ones, and neutral tones for stable markets.

Real-Time Price & Percentage Change

  • Track price movements as they happen.

  • Each block on the Heatmap displays both the price and its percentage variation, giving you immediate insight.

High Performance, No Lag

  • Fully optimized to run smoothly, even on basic VPS setups.

  • Smart, efficient updates for seamless performance even when monitoring multiple assets.

Professional Bloomberg-Style Layout

  • Clean, modern visual inspired by Bloomberg terminals, for serious traders.

  • Automatically organized, with block sizes proportional to market movement, highlighting the hottest opportunities.

Multi-Market Monitoring

  • Compatible with indices, stocks, cryptocurrencies, commodities, and more!

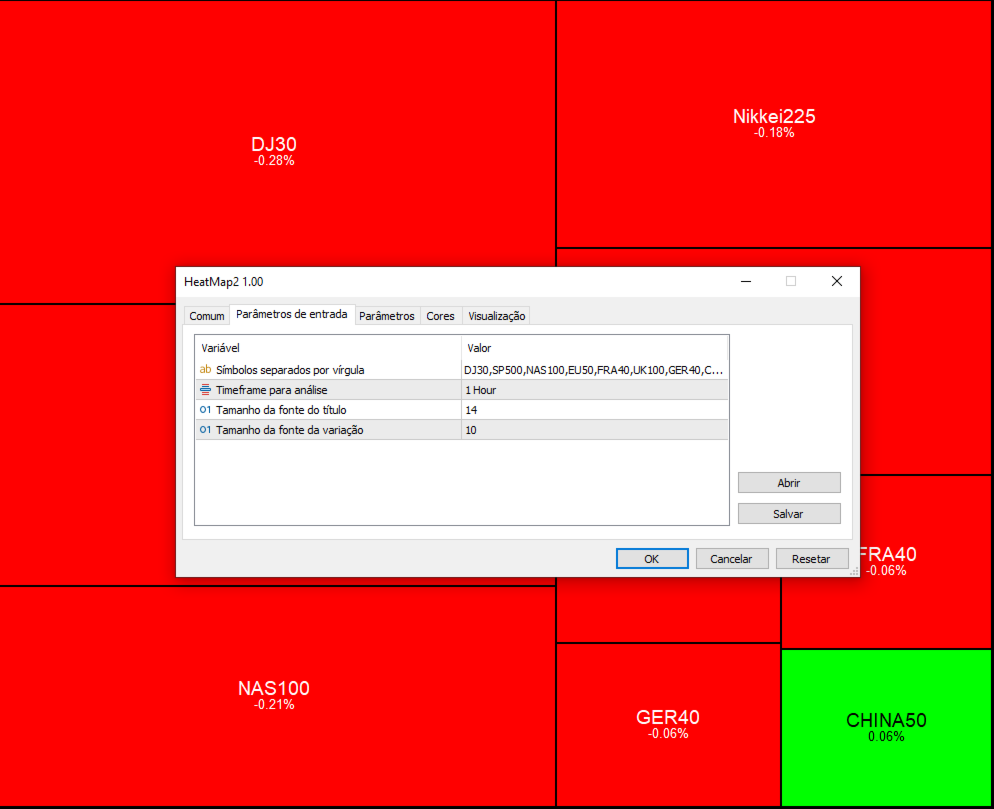
  • Customize your asset list for a fully personalized control panel.

Works Across All Trading Sessions

  • Perfect for London, New York, Asian sessions — or even 24/7 crypto markets.

📈 Who Is This Heatmap For?

✔️ Traders who want faster market reading.
✔️ Anyone looking to anticipate movements and quickly spot opportunities or risks.
✔️ Scalpers, day traders, or swing traders seeking a panoramic view of the market.
✔️ Professionals who want to trade with high-level tools, just like the top trading desks around the world.

🎯 Real-Time Results, Right On Your Screen

  • Save valuable analysis time.

  • Forget switching between dozens of charts.

  • Boost your operational efficiency with a clear, instant market overview.


おすすめのプロダクト
Visual Heatmap Book Analyser This indicator monitors the market liquidity and generates colors based on order patterns, quantities, and renewal activities in the book. This allows you to visualize the order flow and identify areas of high and low liquidity and activity. The indicator uses machine learning techniques to analyze the order behavior in the book, enabling it to detect patterns and trends in orders, allowing you to make informed decisions about your trading operations. The color pale
This product is designed for the MT5 platform and offers two key features: VWAP (Volume Weighted Average Price) calculation and Volume Profile analysis. Advantages: VWAP Calculation: The product calculates the VWAP, which is a popular indicator used by traders to determine the average price of a security based on its trading volume. It helps identify potential buying or selling opportunities by comparing the current price to the average price weighted by volume. Volume Profile Analysis: The prod
WAPV Box Effort x Result
Eduardo Da Costa Custodio Santos
MT5のWA_PV_BOX_EFFORTXRESULT WAPV Box Effort x Result Indicatorは、Package Indicatorsグループ(Wyckoff Academy Wave Market)の一部です。 MT5のWAPVボックスエフォートx結果インジケーターは、価格とボリュームを読み取るのに役立ちます。その読みは、努力×結果の特定を支援することで構成されています グラフによって作成された波で。 ボックスが緑色の場合のMT5のWAPVボックスの労力x結果インジケーターは、ボリュームが需要に有利であり、ボックスが赤色の場合を意味します ボリュームは供給に有利です。 ボックスが大きいほど、価格に対するボリュームの変位が大きくなります。価格の上昇波がボックスのサイズに比例しない場合、 努力×結果。 非常に視覚的な方法で、ボリュームと価格の間のこの相違を識別できます。 MT5のWAPVBoxEffort x Result Indicatorを使用すると、インジケーターをゼロ軸の下に配置することで、視覚化を向上させることもできます。 ティックボリュームとリア
Do you use volume in your reading of the market? Certainly many traders use it, and do not imagine operating without it. The Color Histogram Volume Set indicator allows the user to choose the value that he considers interesting to monitor. When you pass this you will have visual confirmation and if you want you will also have the audible alert that is given by the indicator. Of course, there are other ways to try to find a high volume, such as assessing whether the volume is above av
Value Chart Candlesticks
Flavio Javier Jarabeck
4.73 (11)
The idea of a Value Chart indicator was presented in the very good book I read back in 2020 , " Dynamic Trading Indicators: Winning with Value Charts and Price Action Profile ", from the authors Mark Helweg and David Stendahl. The idea is simple and the result is pure genius: Present candlestick Price analysis in a detrended way! HOW TO READ THIS INDICATOR Look for Overbought and Oversold levels. Of course, you will need to test the settings a lot to find the "correct" one for your approach. It
FREE
Scalper gun  - главное оружие для торговли скальпингом и свингом, с визуализацией и алертом точек входа. Индикатор работает как в трендовых, так и в нетрендовых рыночных условиях. Подходит начинающим и опытным трейдерам.  SCALPER GUN превосходит по скорости, качеству визуализации и точности входа популярные топовые индикаторы этого сайта!!! Перед покупкой скачайте демо Scalper gun и сравните с аналогичными индикаторами для скальпинга в тестере MT4. Особенности Это готовая торговая система с визу
Adjustable Consecutive Fractals  looks for 2 or more fractals in one direction and sends out a on screen alert, sound alert and push notification, for strong reversal points . Adjustable Consecutive Fractals, shows the fractals on chart along with a color changing text for buy and sell signals when one or more fractals appear on one side of price. Adjustable Consecutive Fractals is based Bill Williams Fractals . The standard Bill Williams fractals are set at a non adjustable 5 bars, BUT withe th
MW Volume
Martin Bittencourt
3.8 (5)
The Martinware Volume indicator plots a colored moving average over volume bars. The coloring uses three colors and can be done in different ways choosable by the user and is applied both to the average as to the volume bars. Three types of coloring are possible: None: no coloring is done Increasing or decreasing: changes the color depending on the current value being bigger or lesser than the previous one Volume relative to average: colors vary if the current volume is bigger or lesser then
FREE
Aggression Volume
Flavio Javier Jarabeck
4.2 (15)
Aggression Volume Indicator is the kind of indicator that is rarely found in the MQL5 community because it is not based on the standard Volume data provided by the Metatrader 5 platform. It requires the scrutiny of all traffic Ticks requested on the platform... That said, Aggression Volume indicator requests all Tick Data from your Broker and processes it to build a very special version of a Volume Indicator, where Buyers and Sellers aggressions are plotted in a form of Histogram. Additionally,
FREE
DESCRIÇÃO O indicador   EasyFollowerTrader-Bot2-DayTrade   opera apenas a favor da tendência. Assim, o indicador, em primeiro momento, observar a tendência de três médias síncrona com o time-frame selecionado. Em seguida, o indicador observar a tendência do gráfico diário. Quando estes dois gráficos estiverem se movimentando na mesma direção, teremos a maior probabilidade de ganhos. Chamaremos esta região como região de alta probabilidade de ganho. Na região de alta probabilidade de ganho, o ind
Wave Box Market Frenquency
Jean Jacques Huve Ribeiro
4.75 (4)
Totally linked to the result of a movement and the duration he had. Its height records how many ticks the asset walked during a given movement, its width shows us the duration that movement had. Its configuration must be in line with the Weis Wave Indicator configuration to observe the movement force and can indicate a possible accumulation or distribution of the movement;
FREE
Vanguard's Volatility indicator is based on the analysis of long and short price volatility. It helps to determine market entry points by displaying favorable entry points with arrows. This indicator can be used as a filter in trading or as a tool to show the exact direction of the trend. It is suitable for both scalping on small time intervals and long-term trading. It is important to remember that successful trading requires a comprehensive approach, and additional information is needed to en
Automatic Vwap Midas
Ricardo Almeida Branco
5 (1)
The 3 Automatic Vwap (Midas) Indicator can be used for Price and Volume studyers to map the movement of market drivers. It automatically plots 3 Vwaps, two of which are dynamic and will be updated throughout the day if new highs or new lows emerge. The third Vwap is daily and can help if the trend is up or down. Also, an auxiliary indicator that plots (also dynamic) points of interest with OHLC prices (Open, High and Low of the current day and Close of the previous day) was inserted. Success and
RAD CRITICAL LEVES RAD indicator tracks “Relevant Volume” in real time, identifying accumulation and distribution processes, projecting them in the chart as SUPPORT or RESISTANCE zones. Natural   support   and resistance levels are generated by Volume Accumulation and Distribution processes. As these processes evolve, levels at which the relevant volume in the market place is positioned, become difficult areas to cross upwards or downwards. By using this information, traders can identify very s
The best Vwap Midas coding for Metatrader 5 you can find in White Trader indicators. The indicator has been optimized not to recalculate (improving performance) and has several visual settings for you to adapt in your own way. TRY IT FOR FREE by clicking the free demo button Where and why to use Vwap Midas (and Auto Zig Vwap Midas) can be used on a variety of indices, currencies, forex, cryptocurrencies, stocks, indices and commodities. Many successful traders use price and volume to get the
Waves Sizer
Flavio Javier Jarabeck
3.67 (6)
Wyckoff fans, enjoy! Ideally to be used with the Weis Waves indicator, but it can be easily used alone, the Waves Sizer puts the range (in resulting Price movement) done by the Price on its market swings. You can control how accurate or loose will be the swings. This tool is very helpful for visually know how much the Price has traveled in your Timeframe. This way you can confront this level of effort with the resulting Volume, etc... Weis Waves indicator: https://www.mql5.com/en/market/produc
FREE
Swiss VWAPsimple Motivation Did not find free VWAP that works, the one that I found craseh. So I created a VWAP which calculates values only for the actual day. So computer resouces are not over stressed. What is VWAP, how is it used?  VWAP stands for Volume Weighed Average Price, it calculates the running sum of tick volume and the runnung sum of price times tickvolume. The division of these sums result in a weighed price (Sum P*V/Sum V). The calculation starts normally at midnight. The values
FREE
Stackable VWAP
Flavio Javier Jarabeck
3.5 (4)
Volume Weighted Average Price (VWAP) is a trading benchmark commonly used by Big Players that gives the average price a Symbol has traded throughout the day. It is based on both Volume and price. Additionally we put in this indicator the MVWAP (Moving Volume Weighted Average Price). For those who do not know the usage and the importance od this indicator I recommend a great article about this subject at Investopedia ( https://www.investopedia.com/articles/trading/11/trading-with-vwap-mvwap.asp
FREE
CVD SmoothFlow Pro
Thalles Nascimento De Carvalho
CVD SmoothFlow Pro - すべての資産に対応した無制限のボリューム分析! CVD SmoothFlow Pro は、精密で無制限のボリューム分析を求めるトレーダーに最適なソリューションです。Cumulative Volume Delta(CVD)の計算と高度なノイズフィルタリングを使用することで、プロ版はあらゆる金融資産の取引に必要な柔軟性と精度を提供します。 CVD SmoothFlow Pro が提供するもの: クリアな分析 :ノイズをフィルタリングし、すべての金融資産における重要なボリュームの動きを際立たせます。 ️ 正確な計算 :買いと売りの差を監視し、外為、インデックス、暗号通貨などの資産におけるボリュームの詳細な動きを提供します。 直感的なインターフェース :データの表示が明確で、分析がわかりやすく効率的です。 トレンドの特定 :市場のトレンドを自信を持って特定し、情報に基づいた意思決定をサポートします。 実用的な用途: リアルタイムで任意の資産における買い手と売り手のバランスを監視します。 ボリュームに基づいてトレンドの反転
Simple Vwap with the daily, weekly and monthly VWAP is the abbreviation for   volume-weighted average price , which is a technical analysis tool that shows the ratio of an asset's price to its total trade volume. It provides traders and investors with a measure of the average price at which a stock is traded over a given period of time. How it's used Identify entry and exit points:   Traders can use VWAP to determine when to buy or sell an asset.   Understand price trends :  Traders can use V
FREE
Was: $69  Now: $49   Blahtech VWAP - Volume Weighted Average Price (VWAP) is the ratio of price to total volume. It provides an average price over a specified time interval.  Links [  Install  |  Update  |  Documentation   ] Feature Highlights Configurable VWAP Line Sessions, intervals, anchored or continuous Previous day settlement line Standard Deviation bands Alerts at bar close or real time Automatic Broker or Tick volumes Significantly reduced CPU usage Input Parameters Expert Advisor Mo
VWAP Volume And Price is the indicator for Volume Weighted Average Price, designed according to regular calculation. The average price is calculated using typical price - (high + low + close) / 3 - and weighted by volume for each candle. So, the indicator can be used to trend trades, balanced with volume. Try other products and expert advisors too. Any doubt, PM.
The indicator enables very quick orientation in the market phase (re/accumulation, re/distribution, up/down trend). It is counted only from price data (without volume). It is based on the assumptions of Wyckoff's law of Causa and Effect. Oscillations are an expression of the level of market uncertainty and point to the presence of Big Money. Such a "storm" is followed by a calmer trend that needs to be exited. You need to use other tools or shorter period of the same indicator for that. I keep t
6-BAND VWAP (Volume Weighted Average Price) Fully customized and EA-friendly VWAP Bands Indicator. Main Features: Choose the period of VWAP calculation reset (Daily, Weekly or Monthly): For day trading use the Daily VWAP, and for longer term analysis use the Weekly or Monthly calculations. Choose how many bands (deviations) you want to show, up to 6. Choose zero to display only the main VWAP line. Fine adjustment of the deviation of the bands: Find the best band’s deviation for the instrum
Mini Indice Composition
Thalles Nascimento De Carvalho
Mini Índice Composition: A Revolução na Análise do Mini Índice! O Mini Índice Composition é um indicador inovador que monitora em tempo real as principais ações que compõem o mini índice, trazendo uma visão quantitativa poderosa sobre o fluxo de ordens do mercado! Como Funciona? Diferente de outros indicadores que utilizam apenas dados históricos, o Mini Índice Composition faz uma leitura ao vivo das ordens que entram e saem das ações, pesando o impacto direto no mini índice. Com
「この秘密のトレーディングツールはプロップ会社によって禁止されている(彼らはあなたに知られたくない!)」 EAなしで究極のトレーディング・エッジを発見!(トレーダーのために、トレーダーによって作られました。 ロボットではなく、純粋なトレーディング・パワーです。) 偽のブレイクアウト、突然の反転、市場操作に苦戦していませんか?この強力なトレーディングツールは、マーケットが速く動くときでも、レーザー精度のシグナルを提供します! --------------------------------------------------------------------------------------------------- 私のおすすめ:- 最高の電波強度設定 FXペア、金、指数、暗号通貨など、あらゆる種類のシグナルに対応。 ご希望のTFを選択し、バックテスト前に入力タブからシグナル値を変更してください。 >> ( 4または5 ) >> 1m / 5m / 15m / 30m / 1H / 4H の場合 >> (2または3) >>日足/週足/月足用 -----------------
This z-score indicator shows the correct z-score of an asset, as it uses the normalized price data for calculation, which is the only correct way. Z-score is only applicable for normal distributed data, therefore not the actual price is considered, but the normalised returns, which were assumed to follow a normal distribution. Returns are mean reverting and assumed to follow a normal distribution, therefore z-score calculation of returns is more reliable than z-score on price, as price is NOT m
The indicator measures the balance of aggression. The formula is as follows:   Aggression  = Purchase Volume - Sales Volume. Note : It is rec ommended to use the default configuration and VPS values. It does not work in Forex. Meet Our Products     Parameters : Numbers of days prior to the current one for calculation; Volume Divider e; Enables calculation of the current candle; Histogram Line style and; Size; Line Line style and; Size;  Follow us on our website to check the next news.
Weis Waves
Flavio Javier Jarabeck
2.83 (18)
The original author is David Weis, an expert in the Wyckoff Method. The Weis Wave is a modern adaptation of the 1930's Wyckoff Method, another expert in Tape Reading techniques and Chart Analysis. Weis Waves takes market volume and stacks it into waves according to price conditions giving the trader valuable insights about the market conditions. If you want to learn more about this subject you can find tons of videos in YouTube. Just look for "The Wickoff Method", "Weis Wave" and "Volume Spread
FREE
This indicator is a volume indicator it changes the color of the candles according to a certain number of ticks, and this number of ticks can be informed by the user both the number of ticks and the color of the candles, this indicator works in any graphical time or any asset, provided that the asset has a ticker number to be informed. This indicator seeks to facilitate user viewing when analyzing candles with a certain number of ticks.
FREE
このプロダクトを購入した人は以下も購入しています
PUMPING STATION – あなた専用の「オールインワン」戦略 PUMPING STATIONは、あなたのトレードをより楽しく、そして効果的に変えてくれる革新的なFXインジケーターです。ただの補助ツールではなく、強力なアルゴリズムを備えた本格的なトレーディングシステムで、より安定したトレードのスタートをサポートします。 この商品をご購入いただくと、以下の特典を無料でお付けします: 専用セットファイル:自動設定による最大パフォーマンスを実現。 ステップバイステップのビデオマニュアル:PUMPING STATION戦略の使い方を学べます。 Pumping Utility:PUMPING STATION専用の半自動トレードボットで、より快適かつシンプルな運用を可能にします。 ※ご購入後すぐにご連絡ください。追加リソースへのアクセスを提供いたします。 PUMPING STATIONの仕組み: トレンド管理:市場のトレンド方向を即座に判断。トレンドはあなたの最高の味方です。 エントリーサイン:チャート上の矢印で、取引のタイミングと方向を明確に示します。 明確な目標設定:インジケーターが自
Golden Trend Indicator MT5
Noha Mohamed Fathy Younes Badr
4.89 (18)
Golden Trend indicator  is The best indicator for predicting trend movement this indicator never lags and never repaints and never back paints    and give  arrow buy and sell    before the candle appear  and it will help you and  will make your trading decisions clearer its work on all currencies and  gold and crypto and all time frame This unique  indicator uses very secret algorithms to catch the  trends, so you can trade using this indicator and see the trend clear on charts  manual guide and
このインジケーターを購入された方には、以下の特典を 無料 で提供しています: 各トレードを自動で管理し、ストップロスとテイクプロフィットを設定し、戦略ルールに基づいてポジションを決済する補助ツール 「Bomber Utility」 様々な銘柄に合わせたインジケーターの設定ファイル(セットファイル) 「最小リスク」、「バランスリスク」、「待機戦略」 の3つのモードで使用できる Bomber Utility 用の設定ファイル このトレーディング戦略をすぐに導入・設定・開始できる ステップバイステップのビデオマニュアル ご注意: 上記の特典を受け取るには、MQL5のプライベートメッセージシステムを通じて販売者にご連絡ください。 オリジナルのカスタムインジケーター 「Divergence Bomber(ダイバージェンス・ボンバー)」 をご紹介します。これは、MACDのダイバージェンス(乖離)戦略に基づいた 「オールインワン」型のトレーディングシステム です。 このテクニカルインジケーターの主な目的は、価格とMACDインジケーターの間に発生するダイバージェンスを検出 し、将来の価格の動きを示す
反転ゾーン / ピークボリューム / 主要プレーヤーのアクティブゾーン =       TS TPSプロシステム 説明書 RUS       /       説明書     英語     /           バージョン MT4        このインジケーターを購入したすべての購入者は、さらに以下を無料で受け取ります: RFI SIGNALS サービスからの取引シグナルへの 6 か月間のアクセス - TPSproSYSTEM アルゴリズムに従った既製のエントリ ポイント。 定期的に更新されるトレーニング資料 - 戦略に没頭し、プロフェッショナル レベルを高めます。 平日は 24 時間 365 日サポート、非公開のトレーダー チャットへのアクセス - コミュニケーション、サポート、市場状況の分析。 著者の設定ファイル - 余分な労力をかけずに最大の結果を達成するための自動インジケーター設定。 主な機能: 売り手と買い手のアクティブなゾーンを表示します。 このインジケーターは、購入と販売の正しい最初のインパルス レベル/ゾーンをすべて表示します。これらのレベル/ゾーンがアクティブに
今、147ドル(いくつかの更新後に499ドルに増加します) - 無制限のアカウント(PCSまたはMac) RelicusRoad ユーザー マニュアル + トレーニング ビデオ + プライベート Discord グループへのアクセス + VIP ステータス 市場の新しい見方 RelicusRoad は、外国為替、先物、暗号通貨、株式、および指数の世界で最も強力な取引インジケーターであり、トレーダーに収益を維持するために必要なすべての情報とツールを提供します。初心者から上級者まで、すべてのトレーダーが成功するためのテクニカル分析と取引計画を提供します。これは、将来の市場を予測するのに十分な情報を提供する重要な取引指標です。意味をなさないチャート上のいくつかの異なる指標ではなく、完全な解決策を信じています.これは、信号、矢印 + 価格アクション情報を表示するオールインワンのインジケーターで、他に類を見ない非常に正確です。 強力な AI に基づいて、RelicusRoad は不足している情報とツールを提供して、あなたを教育し、トレーディングのプロ、成功したトレーダーにします。 ほと
FX Volume MT5
Daniel Stein
4.82 (17)
FX Volume:ブローカー視点で捉える本物の市場センチメント クイック概要 トレード手法をさらに高めたいとお考えですか? FX Volume は、リテールトレーダーやブローカーのポジション状況をリアルタイムで提供します。これは、COTのような遅延レポートよりもはるかに早く知ることができます。安定した利益を目指す方も、さらなる優位性を求める方も、 FX Volume は大きな不均衡を見極め、ブレイクアウトを確認し、リスク管理を洗練させるのに役立ちます。今すぐ始めて、実際の出来高データがどのように意思決定を変革するかを体感してください! 1. FX Volume がトレーダーにとって非常に有益な理由 高精度の早期警戒シグナル • 各通貨ペアを売買しているトレーダー数を、他者よりも早く、ほぼリアルタイムで把握できます。 • FX Volume は、複数のリテールブローカーから得られる本物の出来高データを収集し、分かりやすい形式で提供する 唯一 のツールです。 強力なリスク管理 • ロングやショートの大きな偏り(インバランス)を特定し、潜在的なトレンド転換を見逃しません。ストップ
MetaForecast M5
Vahidreza Heidar Gholami
5 (3)
MetaForecastは、価格データのハーモニクスに基づいて、どんな市場の未来を予測し視覚化します。市場が常に予測可能ではありませんが、価格にパターンがある場合、MetaForecastは可能な限り正確な未来を予測できます。他の類似製品と比較して、MetaForecastは市場のトレンドを分析することでより正確な結果を生成することができます。 入力パラメータ Past size (過去のサイズ) MetaForecastが将来の予測を生成するために使用するバーの数を指定します。モデルは選択したバー上に描かれた黄色の線で表されます。 Future size (将来のサイズ) 予測すべき将来のバーの数を指定します。予測された将来は、ピンクの線で表示され、その上に青い回帰線が描かれます。 Degree (程度) この入力は、MetaForecastが市場で行う分析のレベルを決定します。 Degree 説明  0 Degree 0の場合、価格の全てのピークや谷、そして詳細をカバーするために、「Past size」の入力に大きな値を使用することが推奨されています。  1 (推奨) Degre
Gold Stuff mt5
Vasiliy Strukov
4.93 (178)
Gold Stuff mt5 は、金専用に設計されたトレンド指標であり、あらゆる金融商品にも使用できます。 インジケーターは再描画せず、遅れません。 推奨時間枠 H1. 設定と個人的なボーナスを得るために、購入後すぐに私に連絡してください!  トレンド スキャナーの強力なサポートを利用して、無料のインジケーターを入手し、プライバシーを守ります。あーみー!   設定 矢印を描く - オンオフ。 チャートに矢印を描く。 アラート - 可聴アラートのオンオフ。 メール通知 - オンオフ。 電子メール通知。 プチ通知 - オンオフ。 プッシュ通知。 次に、色域を調整します。 Gold Stuff mt5 は、金専用に設計されたトレンド指標であり、あらゆる金融商品にも使用できます。 インジケーターは再描画せず、遅れません。 推奨時間枠 H1. 設定と個人的なボーナスを得るために、購入後すぐに私に連絡してください!   設定 矢印を描く - オンオフ。 チャートに矢印を描く。 アラート - 可聴アラートのオンオフ。 メール通知 - オンオフ。 電子メール通知。 プチ通知 - オンオ
このダッシュボードは、選択されたシンボルの最新の利用可能なハーモニックパターンを表示するので、時間を節約し、より効率的に /   MT4バージョン 。 無料インジケーター:   Basic Harmonic Pattern インジケーター列 Symbol : 選択したシンボルが表示されます。 Trend :   強気または弱気 Pattern : パターンの種類(ガートレー、バタフライ、バット、カニ、サメ、サイファー、ABCD) Entry : エントリー価格 SL: ストップロス価格 TP1: 1回目の利食い価格 TP2: 2回目の利食い価格 TP3:   3回目の利食い価格 Current price :   現在値 Age (in bars):    最後に描画されたパターンの年齢 主な入力項目 Symbols:   "28 Major Currency Pairs "または "Selected Symbols "から選択。 Selected Symbols:   カンマで区切られた監視したいシンボル("EURUSD,GBPUSD,XAUUSD")。ブローカーがペアに接
Quantum TrendPulse を ご紹介します。これは、   SuperTrend   、   RSI   、および Stochastic のパワーを 1 つの包括的なインジケーターに組み合わせて、取引の可能性を最大限に引き出す究極の取引ツールです。精度と効率を求めるトレーダー向けに設計されたこのインジケーターは、市場のトレンド、勢いの変化、最適なエントリー ポイントとエグジット ポイントを自信を持って特定するのに役立ちます。 主な特徴: SuperTrend 統合: 現在の市場動向に簡単に追従し、収益性の波に乗ることができます。 RSI精度: 買われすぎと売られすぎのレベルを検出し、市場の反転のタイミングに最適で、SuperTrendのフィルターとして使用されます。 確率的精度: 確率的振動を活用して、変動の激しい市場で隠れたチャンスを見つけます。SuperTrend のフィルターとして使用されます。 マルチタイムフレーム分析:   M5 から H1 または H4 まで、さまざまなタイムフレームで市場を常に把握します。 カスタマイズ可能なアラート: カスタム取引条件が満たされ
VERSION MT4        —        ИНСТРУКЦИЯ RUS           —        INSTRUCTIONS  ENG 主な機能: レンダリングなしで正確な入力信号! シグナルが表示されると、それは関連性を維持します。これは、シグナルを提供してからそれを変更し、その結果、入金された資金が失われる可能性があるリドローインジケーターとの重要な違いです。より高い確率と精度で市場に参入できるようになりました。矢印が表示された後、ターゲットに到達する (利益確定) か反転シグナルが表示されるまで、ローソク足に色を付ける機能もあります。 STOP-LOSS/TAKE-PROFITゾーンの表示 エントリーポイントを検索する際の視覚的な明瞭さを改善するために、最適な市場エントリーポイントが検索される購入/販売ゾーンを最初に表示するモジュールが作成されました。ストップロスレベルを操作するための追加のインテリジェントロジックは、時間の経過とともにそのサイズを縮小するのに役立ち、それによって取引に参加するときの初期リスクを軽減します(Move SL)。 より高いタイ
優れたテクニカルインジケーター「Grabber」をご紹介します。これは、すぐに使える「オールインワン」トレーディング戦略として機能します。 ひとつのコードに、市場のテクニカル分析ツール、取引シグナル(矢印)、アラート機能、プッシュ通知が強力に統合されています。 このインジケーターを購入された方には、以下の特典を無料で提供します: Grabberユーティリティ:オープンポジションを自動で管理するツール ステップバイステップのビデオマニュアル:インジケーターのインストール、設定、取引方法を解説 カスタムセットファイル:インジケーターをすばやく自動設定し、最大限の成果を出すための設定ファイル 他の戦略はもう忘れてください!Grabberだけが、あなたを新たなトレードの高みへと導いてくれるのです。 Grabber戦略の主な特徴: 推奨タイムフレーム:M5〜H4 対応通貨ペア・資産:どれでも使用可能ですが、私が実際に検証した以下を推奨します(GBPUSD、GBPCAD、GBPCHF、AUDCAD、AUDUSD、AUDSGD、AUDCHF、NZDUSD、NZDCAD、EURCAD、EURUSD、E
次世代の自動化された需要と供給のゾーン。どのチャートでも機能する新しい革新的なアルゴリズム。すべてのゾーンは、市場の価格行動に従って動的に作成されています。 2種類のアラート --> 1) 価格がゾーンに達したとき 2) 新しいゾーンが形成されたとき もう 1 つの役に立たない指標はありません。実績のある完全な取引戦略を手に入れることができます。     新機能:     価格が需給ゾーンに達したときにアラートを出す     新しい需給ゾーンが作成されたときにアラートを発します     プッシュ通知アラート     ピップ単位のゾーン幅ラベル     MTF のもう 1 つのタイムフレーム。したがって、現在より 2 時間足高いのではなく、現在より 3 時間足し上に見えるようになります。     アラート/ゾーン/MTF 機能を有効/無効にするボタン あなたが得る利点:     取引から感情を取り除きます。     取引エントリをオブジェクト化します。     確率の高いセットアップで利益を上げましょう。     描画ゾーンから時間を節約します。
WHY IS OUR FXACCCURATE LS MT5 THE PROFITABLE ? PROTECT YOUR CAPITAL WITH RISK MANAGEMENT Gives entry, stop and target levels from time to time. It finds Trading opportunities by analyzing what the price is doing during established trends. POWERFUL INDICATOR FOR A RELIABLE STRATEGIES We have made these indicators with a lot of years of hard work. It is made at a very advanced level. Established trends provide dozens of trading opportunities, but most trend indicators completely ignore them! The
これはMT5のインジケーターで、再描画なしで取引に参入するための正確なシグナルを提供します。 外国為替、暗号通貨、金属、株式、インデックスなど、あらゆる金融資産に適用できます。かなり正確な見積もりを提供し、取引を開始して終了するのに最適な時期を教えてくれます。1つのシグナルを処理しただけでインジケーターの元が取れた例の 動画 (6:22)をご覧ください。Entry PointsPro インジケーターの助けを借りたほとんどのトレーダーの最初の1週間の結果が改善しています。 Telegramグループ に登録してください。Entry Points Proインジケーターのメリットは次の通りです。 再描画のないエントリーシグナル 再描画されるインジケーターでは一度表示されたシグナルが削除されて大きな金銭的損失につながることがありますが、これと異なり、表示されて確認されたシグナルは消えることがありません。 エラーなしの取引開始 インジケーターアルゴリズムによって取引を開始する(資産を売買する)理想的な瞬間を見つけることができます。それを使用するすべてのトレーダーの成功率が向上します。 あら
NOTE: CYCLEMAESTRO is distributed only on this website, there are no other distributors. Demo version is for reference only and is not supported. Full versione is perfectly functional and it is supported. CYCLEMAESTRO , the first and only indicator of Cyclic Analysis, useful for giving signals of TRADING, BUY, SELL, STOP LOSS, ADDING. Created on the logic of   Serghei Istrati   and programmed by   Stefano Frisetti ;   CYCLEMAESTRO   is not an indicator like the others, the challenge was to inter
ご紹介     Quantum Breakout PRO は 、ブレイクアウト ゾーンの取引方法を変革する画期的な MQL5 インジケーターです。 13年以上の取引経験を持つ経験豊富なトレーダーのチームによって開発されました。     クォンタム ブレイクアウト プロ   は、革新的でダイナミックなブレイクアウト ゾーン戦略により、あなたのトレーディングの旅を新たな高みに押し上げるように設計されています。 クォンタム ブレイクアウト インジケーターは、5 つの利益ターゲット ゾーンを備えたブレイクアウト ゾーン上のシグナル矢印と、ブレイクアウト ボックスに基づいたストップロスの提案を提供します。 初心者トレーダーにもプロのトレーダーにも適しています。 量子EAチャネル:       ここをクリック 重要!購入後、インストールマニュアルを受け取るためにプライベートメッセージを送ってください。 推奨事項: 時間枠: M15 通貨ペア: GBPJPY、EURJPY、USDJPY、NZDUSD、XAUUSD アカウントの種類: ECN、Raw、またはスプレッドが非常に低い R
収益性の高い取引機会を簡単に特定するのに役立つ強力な外国為替取引インジケーターをお探しですか?ビースト スーパー シグナル以外に探す必要はありません。 この使いやすいトレンドベースのインジケーターは、市場の状況を継続的に監視し、新しいトレンドを検索したり、既存のトレンドに飛びついたりします。ビースト スーパー シグナルは、すべての内部戦略が一致し、互いに 100% 合流したときに売買シグナルを発するため、追加の確認は不要です。シグナル矢印アラートを受け取ったら、単に売買します。 購入後、プライベート VIP グループに追加されるようにメッセージを送ってください! (完全な製品購入のみ)。 購入後、最新の最適化されたセット ファイルについてメッセージを送ってください。 MT4版は こちらから。 Beast Super Signal EA は こちらから 入手できます。 コメント セクションをチェックして、最新の結果を確認してください。 ビースト スーパー シグナルは、1:1、1:2、または 1:3 のリスクと報酬の比率に基づいて、エントリー価格、ストップ ロス、テイク プ
Trend Hunter は、外国為替、仮想通貨、CFD 市場におけるトレンド指標です。 このインジケーターの特別な特徴は、価格がトレンドラインをわずかに突き抜けたときにシグナルを変更することなく、自信を持ってトレンドに従うことです。 インジケーターは再描画されず、バーが閉じた後に市場に参入するシグナルが表示されます。 トレンドに沿って移動すると、インジケーターにはトレンドの方向に追加のエントリーポイントが表示されます。 これらのシグナルに基づいて、小さなストップロスで取引できます。 トレンドハンターは正直な指標です。 インジケーター信号の上にマウスを置くと、信号の潜在的な利益と可能なストップが表示されます。 新しい信号が表示されると、次の通知を受け取ることができます。 アラート プッシュ通知 メールによる通知 電報での通知 チャートのスクリーンショットも Telegram に送信されるため、取引を決定するために端末を開く必要はありません。 インジケーターシグナルは、電報チャネル https://www.mql5.com/ja/market/product/11085#!ta
Gold Trend 5
Sergei Linskii
3.5 (2)
Gold Trend - これは優れた株価テクニカル指標です。指標のアルゴリズムは、資産の値動きを分析し、ボラティリティと潜在的なエントリーゾーンを反映しています。 最高の指標シグナル: - 売りの場合 = 赤のヒストグラム + 赤のショートポインター + 同じ方向に黄色のシグナル矢印。 - 買いの場合 = 青のヒストグラム + 青のロングポインター + 同じ方向の水色のシグナル矢印。 インジケータの利点 1. このインディケータは、高い精度でシグナルを発信します。 2. 確定した矢印シグナルは、トレンドが変化したときにのみ再描画されます。 3. どのブローカーのMetaTrader 5取引プラットフォームでも取引できます。 4. あらゆる資産(通貨、金属、暗号通貨、株式、指数など)を取引できます。 5. H1タイムフレーム(中期取引)で取引するのがよい。 6. 各トレーダーがインディケータを自分用に簡単にカスタマイズできるよう、インディケータ設定で個々のパラメータ(TF、色など)を変更できます。 7. このインディケータは、トレーディングシステムの優れたメイン機能として
After your purchase, feel free to contact me for more details on how to receive a bonus indicator called VFI, which pairs perfectly with Easy Breakout for enhanced confluence!     Easy Breakout MT5   is a powerful price action trading system built on one of the most popular and widely trusted strategies among traders: the   Breakout strategy ! This indicator delivers crystal-clear Buy and Sell signals based on breakouts from key support and resistance zones. Unlike typical breakout indicators
[ MT4 Version ]  [ Kill Zones ]  [ SMT Divergences ] How to trade using Order Blocks:  Click here User Interface Performance:  During testing in the strategy tester, the UI may experience lag. Rest assured, this issue is specific to the testing environment and does not affect the indicator's performance in live trading. Elevate your trading strategy with the  Order Blocks ICT Multi TF  indicator, a cutting-edge tool designed to enhance your trading decisions through advanced order block analysis
This indicator has been developed to identify and display these trends quickly and easily, allowing you to see instantly, those currency pairs which are trending, and those which are not – and in all timeframes, with just one click. The 28 currency pairs are displayed as a fan as they sweep from strong to weak and back again, and this is why we call it the ‘currency array’. All 28 pairs are arrayed before you, giving an instant visual description of those pairs that are trending strongly, those
このダッシュボードは、選択したシンボルの取引戦略に応じて、スキャルピングと長期モードの両方で、チャート上の需給ゾーンを発見し表示します。さらに、ダッシュボードのスキャナーモードは、一目ですべての希望のシンボルをチェックし、適切なポジションを見逃さないようにするのに役立ちます /  バージョンMT4 無料インディケータ:   Basic Supply Demand 特徴 複数の通貨ペアの取引機会を見ることができ、需給ゾーンの近さに応じてランク付けされた全ペアを明確かつ簡潔に表示します。 色から検出パラメータまで、特定のニーズに合わせてカスタマイズ可能な設定 主な入力 Indicator mode : 新機能を備えたインジケーター・モードまたはパネル・モードから選択。 Symbols :   "主要28通貨ペア "または "選択されたシンボル "から選択。 Selected Symbols :   カンマで区切られた監視したいシンボル (「EURUSD,GBPUSD,XAUUSD」)。お使いのブローカーがペアに接尾辞または接頭辞を付けている場合は、次の2つのパラメータ(ペア接頭辞または
The AT Forex Indicator MT5 is a sophisticated trading tool designed to provide traders with a comprehensive analysis of multiple currency pairs. This powerful indicator simplifies the complex nature of the forex market, making it accessible for both novice and experienced traders. AT Forex Indicator uses advanced algorithms to detect trends, patterns and is an essential tool for traders aiming to enhance their forex trading performance. With its robust features, ease of use, and reliable signal
[ MT4 Version ] Are you tired of spending months on demo or live accounts to test your trading strategies? The Backtesting Simulator is the ultimate tool designed to elevate your backtesting experience to new heights. Utilizing Metatrader historical symbol information, it offers an unparalleled simulation of real market conditions. Take control of your testing speed, test ideas quickly or at a slower pace, and witness remarkable improvements in your testing performance. Forget about wasting tim
まず最初に、このトレーディングインジケーターは「再描画なし」「再描画なし」「遅延なし」であることを強調する価値があります。これにより、手動取引とアルゴリズム取引の両方に最適です。 ユーザーマニュアル、プリセット、オンラインサポートが含まれています。 AI Trend Pro Maxは、精度、力、シンプルさを求めるトレーダーのために設計された洗練されたオールインワンのトレーディングシステムです。以前のインジケーターを通じて何年もの開発を経ており、これは現在までの最も進化したバージョンで、複数の信号層、プロフェッショナルグレードのフィルター、およびスマートなユーザーインターフェースを備えています。 初心者でもプロのトレーダーでも、AI Trend Pro Maxは、どんな市場状況でも自信を持って取引するために必要なすべてを提供します。 主要な戦略とシステムのロジック: マルチレイヤー信号エンジン:トレンドモメンタム、価格強度、ボリューム、RSI、ボリンジャーバンド、そしてキャンドルカラー論理を組み合わせ、高確率のエントリーを提供します。 トレンドモメンタム:トレンドが強化されているの
Gold Venamax - これは最高の株式テクニカル指標です。 指標アルゴリズムは資産の価格変動を分析し、ボラティリティと潜在的なエントリーゾーンを反映します。 インジケーターの機能: これは、快適で収益性の高い取引のためのマジックとトレンド矢印の 2 つのブロックを備えたスーパー インジケーターです。 チャート上にブロックを切り替えるための赤いボタンが表示されます。 マジックはインジケーター設定で設定されているため、異なるブロックを表示する 2 つのチャートにインジケーターをインストールできます。 Gold Venamax は、異なる矢印バッファー (GV と SD) を備えた 2 つのチャートに配置できます。 これを行うには、設定で異なる Magic を選択する必要があります。たとえば、あるマジック = 999、別のマジック = 666 を選択します。次に、チャート上の赤いボタンで矢印バッファを選択できます。 インジケーター設定の各矢印バッファー (GV および SD) には、快適で収益性の高い取引のための個別の矢印フィルターがあります (UseFiltrGV = true;
Gold TMAF MTF - これは最高の株式テクニカル指標です。指標のアルゴリズムは、資産の値動きを分析し、ボラティリティと潜在的なエントリーゾーンを反映しています。 最高の指標シグナル: 売りの場合 = TMA2の赤い上限がTMA1の赤い上限の上にある場合 + 上記の赤いフラクタル指標 + 同じ方向に黄色のSRシグナル矢印。 買いの場合 = TMA2の青い下限線がTMA1の青い下限線より下にある場合 + 下からの青いフラクタル指標 + 同じ方向の水色のSRシグナル矢印。 インジケーター(赤および/または青の W1 MN)は、快適で収益性の高い取引を行うための追加かつ不可欠な補助ツールです。 SR 矢印バッファには、快適で収益性の高い取引を実現するためのインジケーター設定 (UseFiltrSR = true;) に別の矢印フィルターがあります。 このインディケータの利点 1. このインディケータは、高精度のシグナルを生成します。 2. 確定した矢印シグナルは再描画されませんが、フラクタルシグナルは半周期再描画されます。 3. どのブローカーのMetaTrader 5取引
Description: The Volume Profile displays detailed informations of historical trading activities at certain price levels (Market Profile). Locate the areas with the best prices in the market and get an advantage over other market participants. Features: Customizable Market Profile Shows the "fair" Value Area with 70% of all Volume Shows critical low volume zones Shows VPOC, VAL and VAH Points integrated resource management to reduce the load while working with multiple charts Works on all timefr
作者のその他のプロダクト
MetaPRO Tape reading system
EDUARDO RODRIGUES NASCIMENTO
2 (1)
metaPRO is the only tool on the market for order flow analysis on Forex or any asset! In addition, it allows backtesting. You can trade both manually and 100% automatically using all the information on the platform. Official website: https://seurobotrader.com/robos/metapro-licenca-anual/ You can combine all data displayed on the platform to create automatic strategies. It is compatible with any asset. Whether on B3, mini index, dollar, stocks, options, also on Forex and Crypto. The ticket
Boleta Meta Trader 5
EDUARDO RODRIGUES NASCIMENTO
Now you can trade using hotkeys, "z" to buy, "x" to sell and "c" to close positions/orders. You can open positions at market by pressing the buttons on panel and add your orders to the book when press the hotkeys. Also, the open price, stop loss and take profit are shown to you in chart when the hotkeys are pressed. This panel can be used in netting and hedge accounts.
HFT SP500 Master
EDUARDO RODRIGUES NASCIMENTO
Explore unique opportunities with precision in decisive moments of the financial market. You will be able to execute trades using a strategy that major banks and brokers utilize through high-frequency trading robots. Breaking News has been validated for years—its strategy was initially crafted manually and then carefully automated to ensure it performs exactly as needed to achieve high performance. When I was creating this strategy, I recorded over 40 screen videos to ensure everything was wor
Mini charts indicator
EDUARDO RODRIGUES NASCIMENTO
Your market overview, now crystal clear. With our Mini Charts Indicator for MetaTrader 5 , you’ll have the power of multiple charts inside a single, ultra-clean workspace. No more switching between assets or opening dozens of charts. Our Mini Charts give you instant visual snapshots of multiple markets — all in real time. Each mini chart displays the price action of the selected asset, showing whether it’s trending up or down, giving you immediate market sentiment at a glance. Whether you’re mon
フィルタ:
レビューなし
レビューに返信