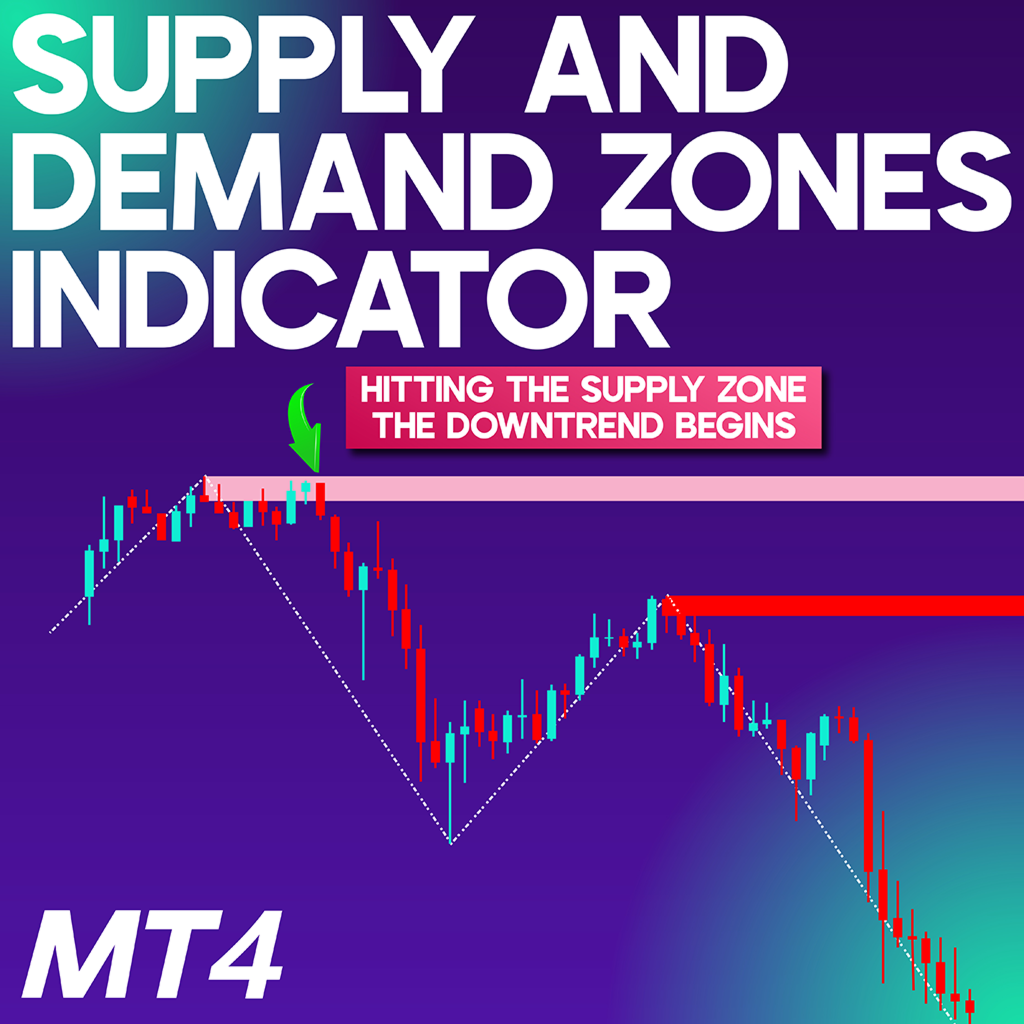
Supply and Demand Zones Indicator MT4
Supply and Demand Zones Indicator MT4
The Supply and Demand Zones Indicator MT4 is a vital price action-based tool used within the MetaTrader 4 platform. It detects and marks high-probability supply (resistance) and demand (support) zones by analyzing historical price activity. This tool automatically renders these critical regions on the chart using distinct color-coded rectangles, allowing traders to pinpoint strategic buy and sell areas.
«Indicator Installation & User Guide»
MT4 Indicator Installation | Supply and Demand Zones Indicator MT5 | ALL Products By TradingFinderLab | Best MT4 Indicator: Refined Order Block Indicator for MT4 | Best MT4 Utility: Trade Assistant Expert TF MT4 | TP & SL Tool: Risk Reward Ratio Calculator RRR MT4 | Money Management: Easy Trade Manager MT4
Supply and Demand Zone Specifications Table
The table below outlines the essential specifications of the Supply and Demand Zones Indicator MT4:
| Category | Supply and Demand – Support and Resistance – Levels and Zones |
| Platform | MetaTrader 4 |
| Skill Level | Intermediate |
| Indicator Type | Continuation – Reversal |
| Timeframe | Multi Timeframe |
| Trading Style | Intraday Trading |
| Trading Market | All Financial Markets |
Indicator Overview
This indicator focuses on marking historically validated supply and demand levels that serve as dynamic zones of interest. These zones remain active on the chart until invalidated by market behavior, assisting traders in recognizing zones with a higher likelihood of reaction. Two primary zone types are displayed:
- Minor Zones: These have less significance when price fails to interact with the level.
- Major Zones: These carry greater importance due to price interacting with the zone, increasing the probability of a reversal or continuation.
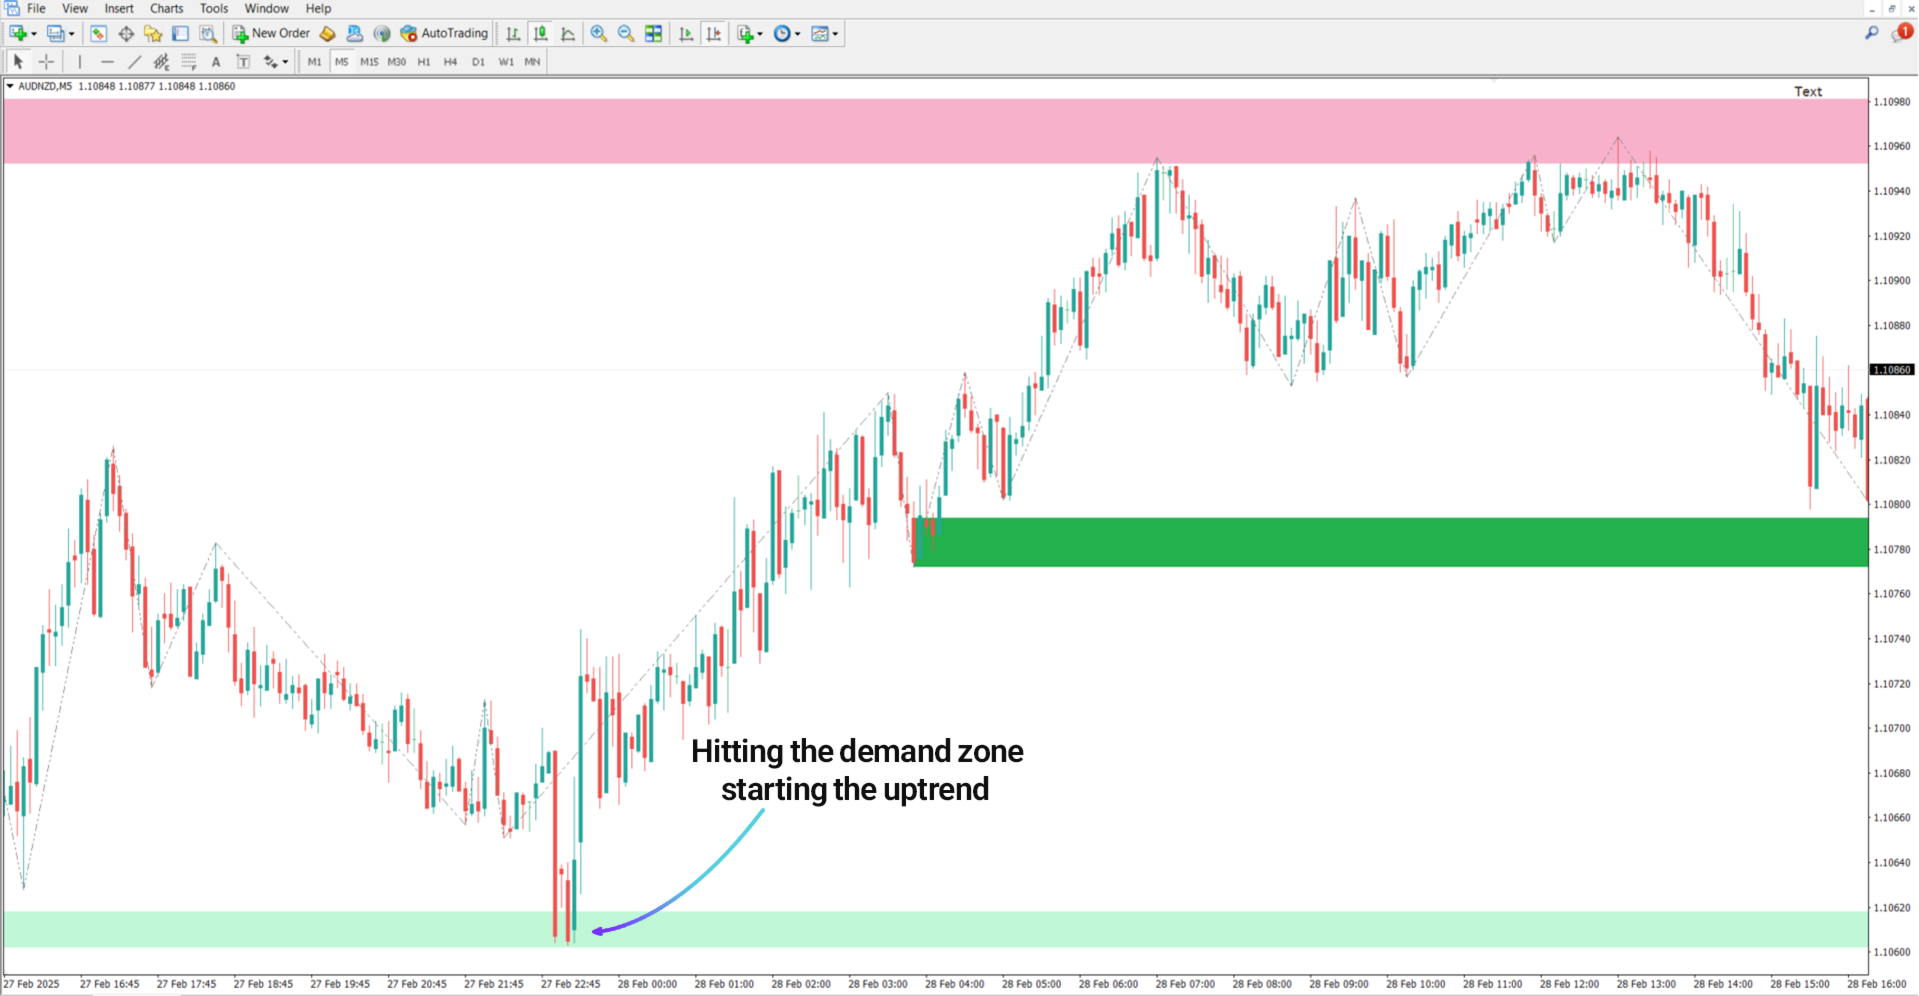
Uptrend Conditions
In the 5-minute AUD/NZD chart, a bullish trend emerges when the price dips into a demand zone. The formation of a bullish reversal signal—such as a strong green engulfing bar—suggests a high-probability long entry from the highlighted support level.
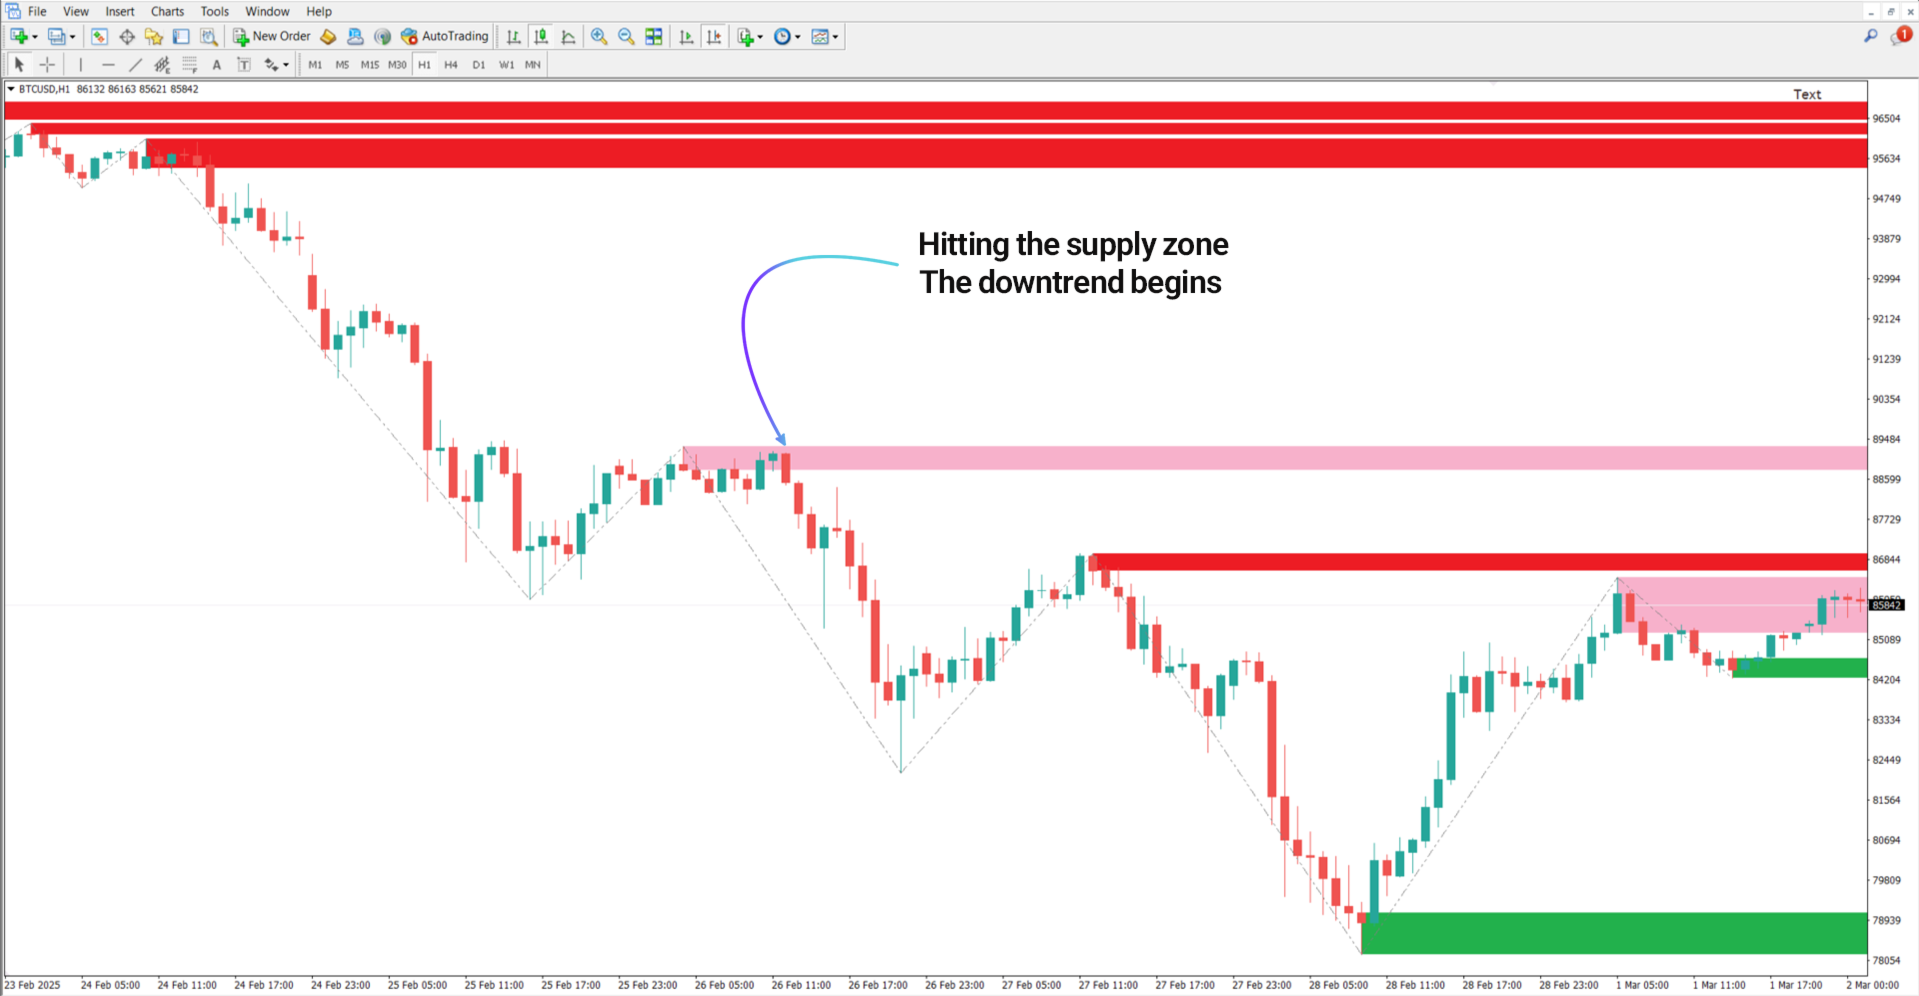
Downtrend Conditions
The 1-hour Bitcoin Cash (BTC/USD) chart reveals a bearish structure. As price reaches a supply zone, it forms classic reversal signals, such as Doji candles and bearish engulfing patterns, indicating a potential short-selling opportunity.
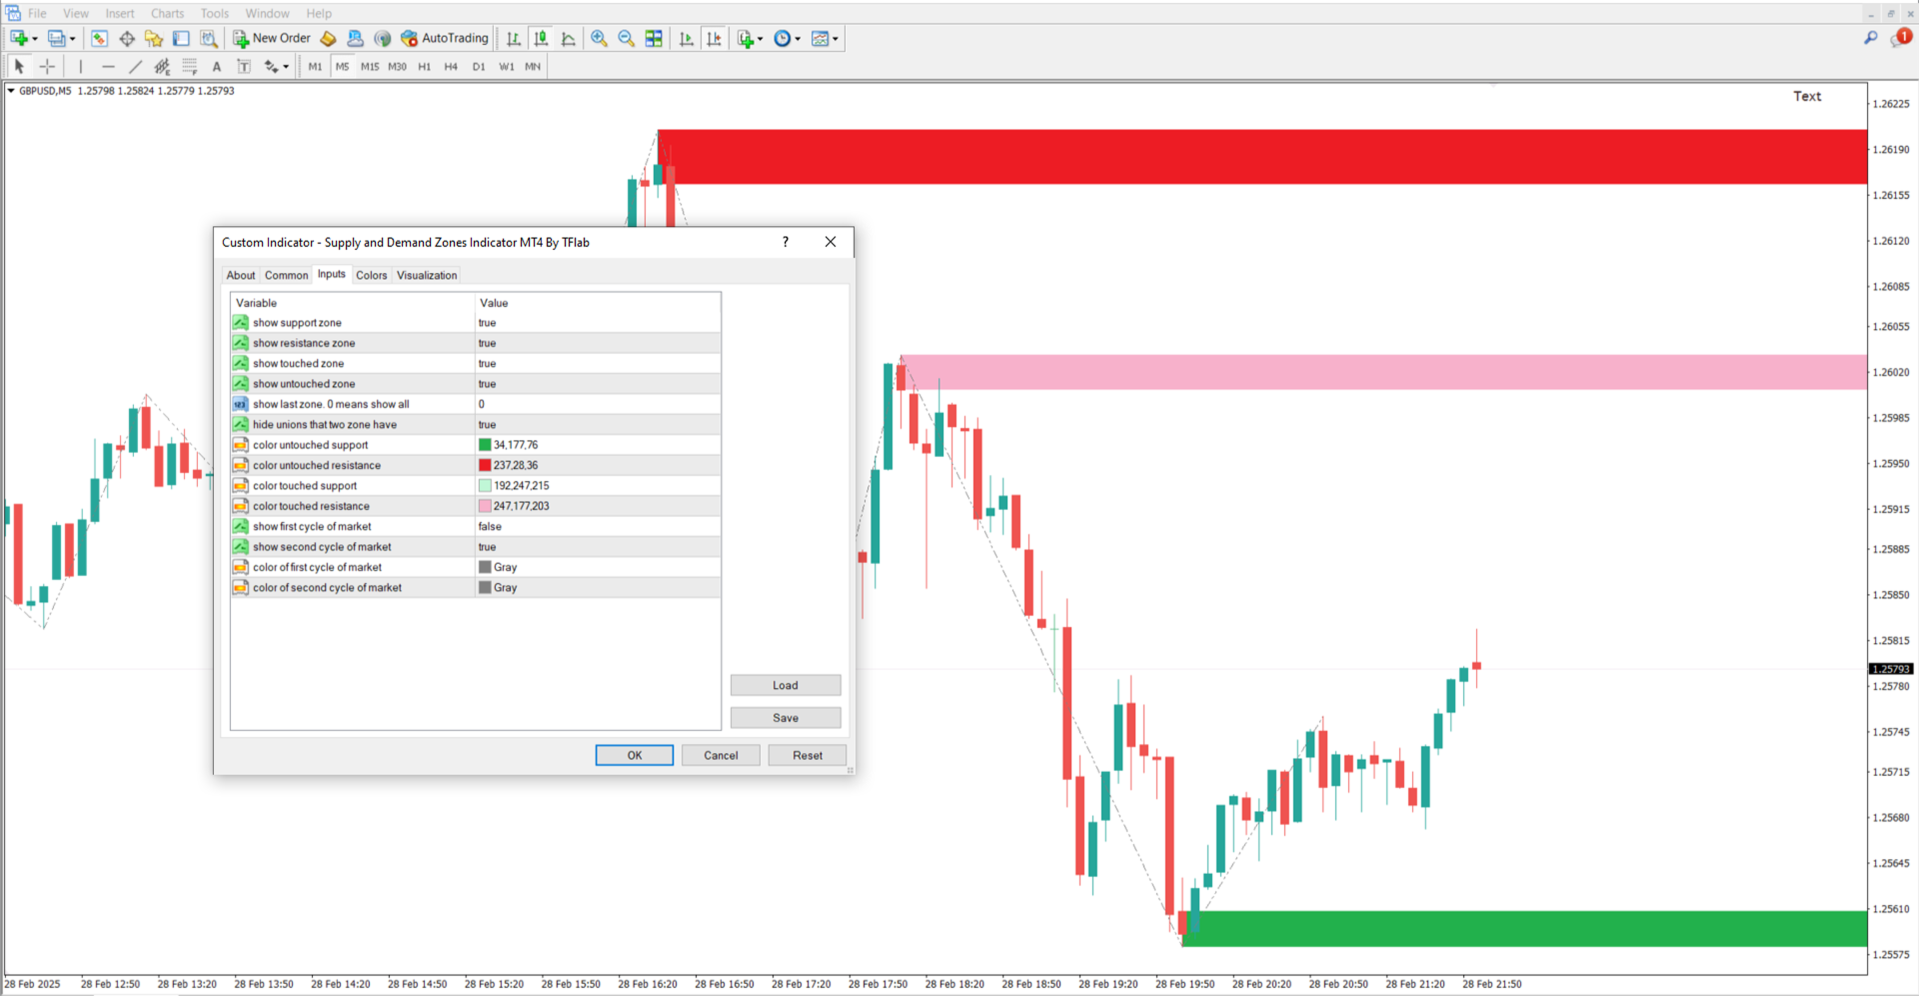
Indicator Settings
The following are the key customizable settings available for the Supply and Demand Zones Indicator MT4:
- Show demand zone: Toggle demand (support) areas
- Show supply zone: Toggle supply (resistance) areas
- Highlight tested zones: Show zones that price has interacted with
- Highlight untouched zones: Mark zones that remain untested
- Show number of last zones (0 = all): Limit or display all identified zones
- Remove overlapping areas: Filter out intersecting supply and demand zones
- Untested demand zone color: Define color for untouched support
- Untested supply zone color: Define color for untouched resistance
- Tested demand zone color: Customize color for tested support
- First market cycle visibility: Show initial cycle of price movement
- Second market cycle visibility: Show the next phase of market movement
- First market cycle color: Color theme for the initial cycle
- Second market cycle color: Color theme for the subsequent cycle
Conclusion
The Supply and Demand Zones Indicator MT4 offers a precise and strategic edge in identifying critical price levels on any financial chart. By mapping out historically valid demand and supply zones, it assists traders in locating potential reversal points and refining their trade entries and exits with higher confidence.