• 概要
  • レビュー
  • コメント

Enhanced Live Trades and History Visualizer MT5

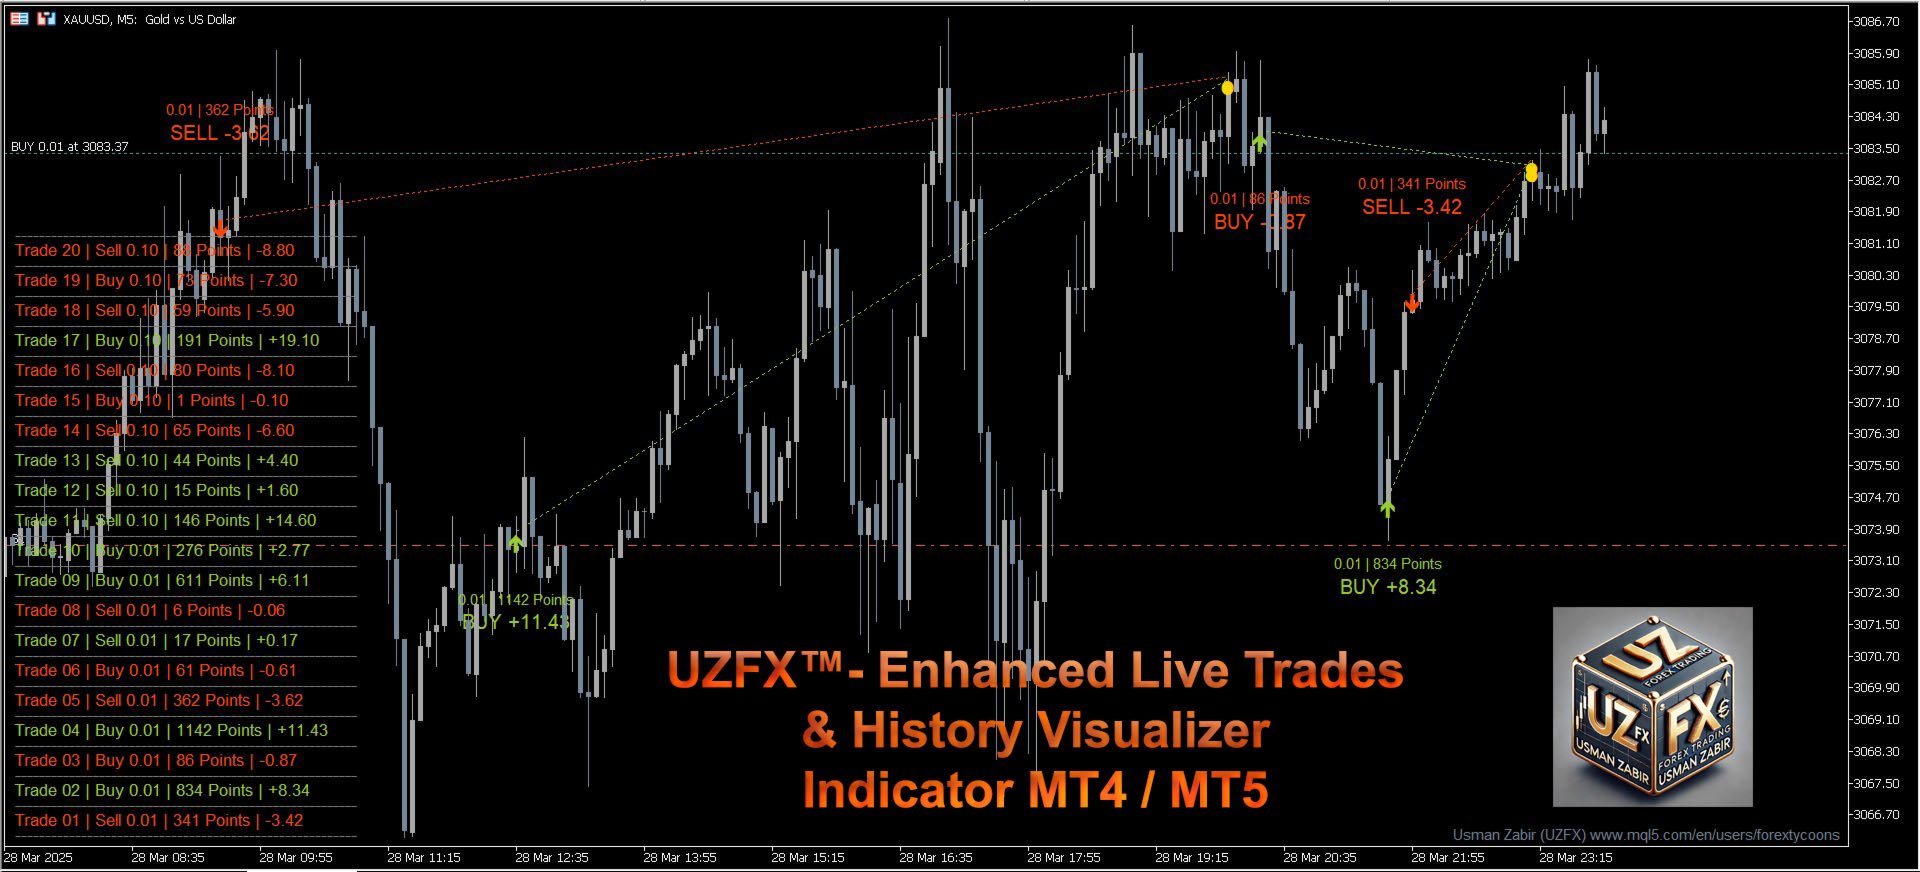
ライブトレードと履歴ビジュアライザーは、トレーダーがオープンポジションとクローズポジションを鮮明なビジュアルアイコンで追跡できるように設計された強力なMetaTrader 5インジケーターです。ライブトレードを監視する場合でも、過去のパフォーマンスを分析する場合でも、このツールは、エントリー/エグジットポイント、利益/損失、およびトレード統計を、チャート上に直接、直感的かつカスタマイズ可能に表示します。


プロフィールを訪問 & 他のMT4/MT5製品すべてをチェックアウト


レビューをお忘れなく


主な特徴:


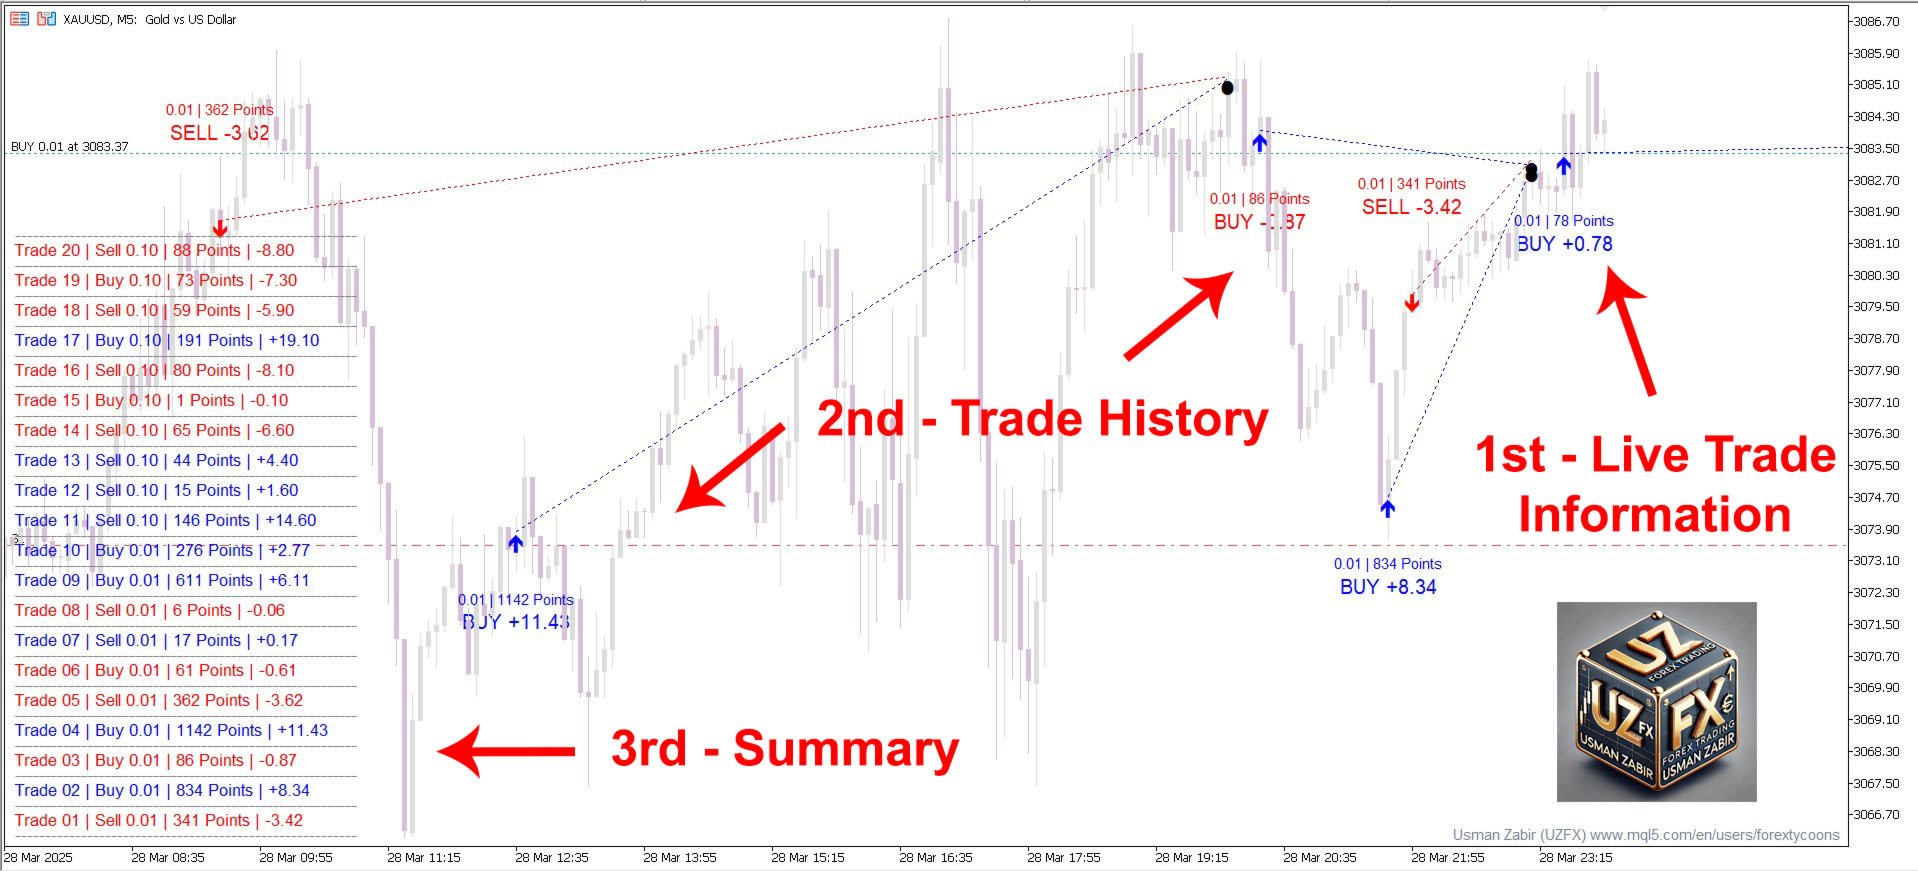
エントリーと現在価格を結ぶダイナミックなラインにより、アクティブなトレードを視覚化


リアルタイムで損益を即座に更新


エントリー/エグジットマーカーとトレンドラインにより、過去のトレードを表示


トレードの詳細(利益、獲得/損失ポイント、ポジションサイズ)を一目で表示


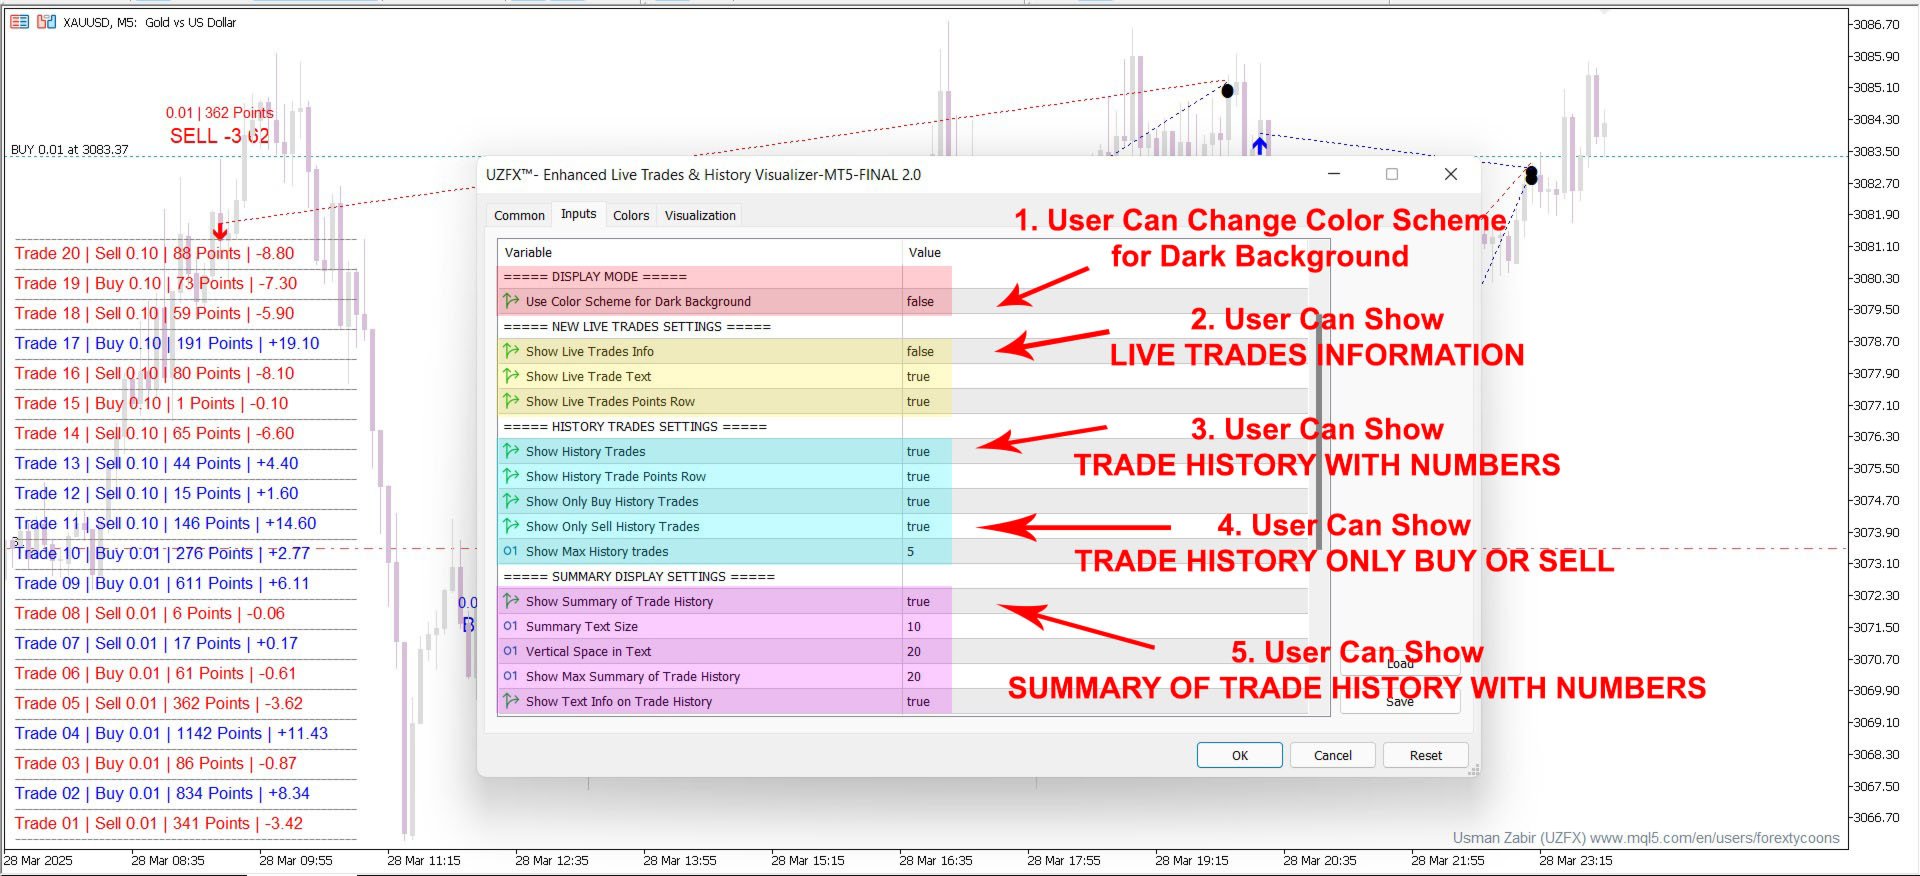
トレードタイプ(買い/売り)とリミット表示履歴によるフィルタリング


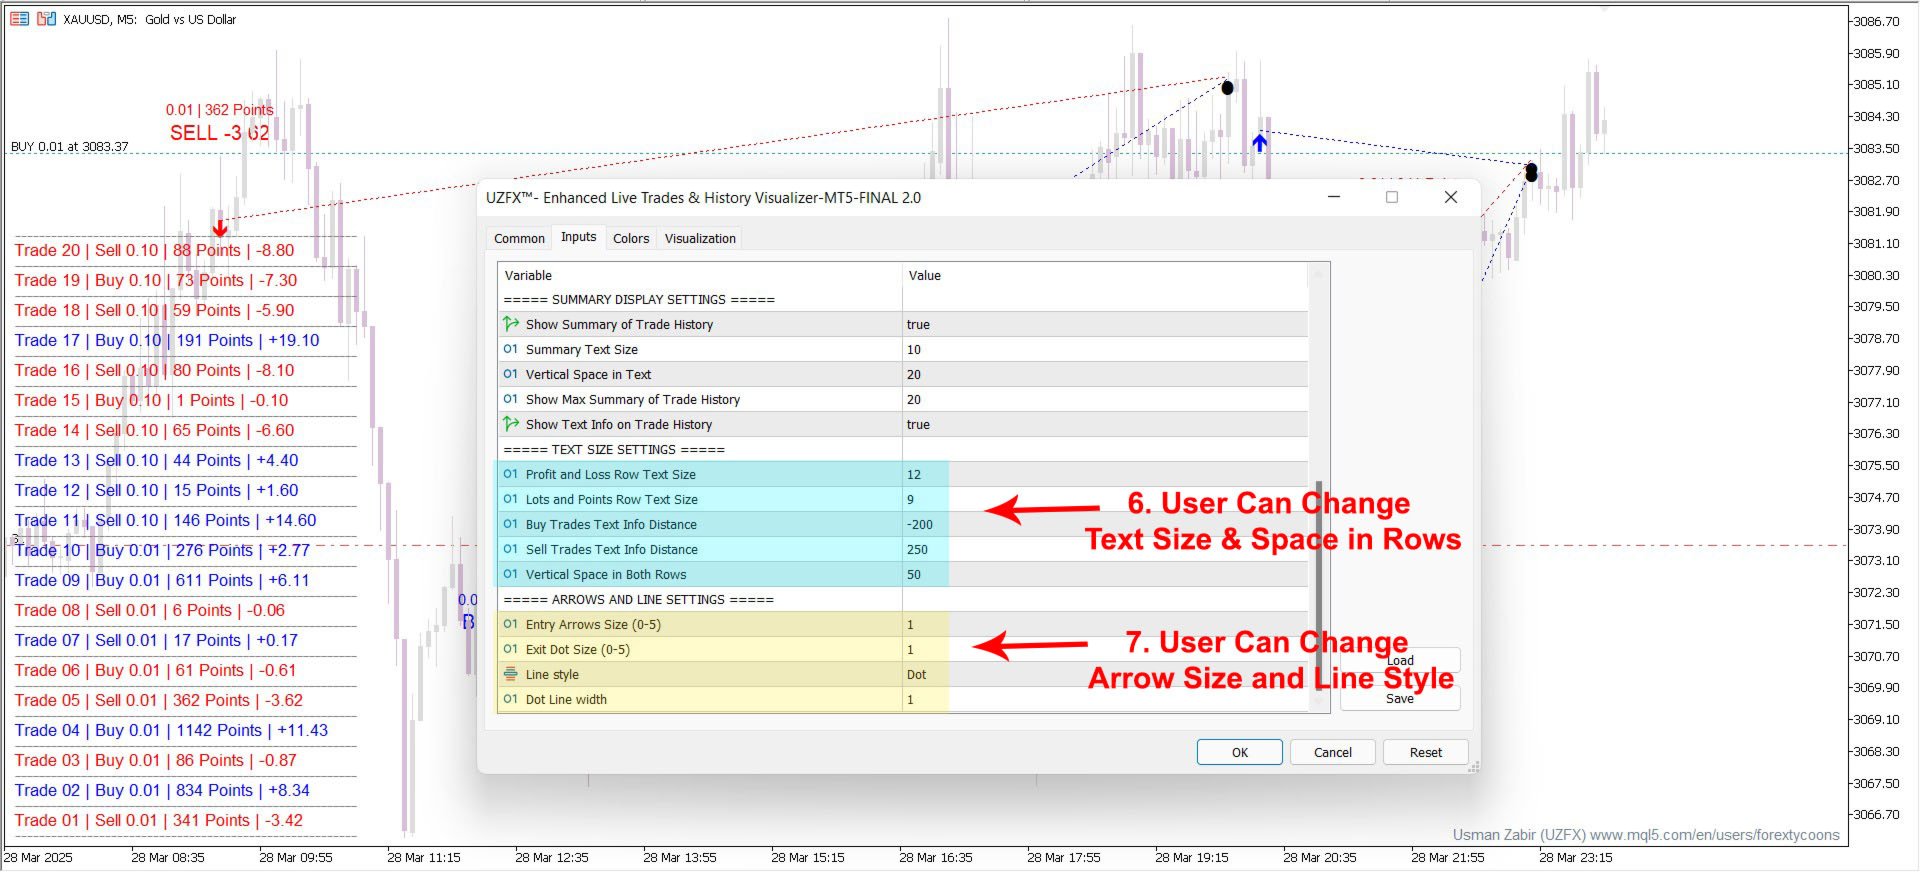
最近のトレードと損益を表示するサマリーテーブル(オプション)


パフォーマンスを素早く確認できる、すっきりと整理されたレイアウト


スマートなリフレッシュレートコントロールにより、CPU使用率を低減


誰向け?


デイトレーダーとスキャルパー - オープンポジションと最近の取引を素早く評価


スイングトレーダー パターン分析のために過去の取引をレビュー


あらゆるストラテジータイプ - あらゆる取引スタイルに対応


今すぐライブトレードと履歴ビジュアライザーを入手して、あなたの取引を明確にしましょう!

おすすめのプロダクト
インジケーター   Haven FVG   は、市場を分析するためのツールで、チャート上で非効率性の領域(Fair Value Gaps、FVG)を特定することができ、トレーダーに価格分析と取引決定のための主要なレベルを提供します。 他の製品 ->  ココ 主な特徴: 個別のカラー設定: ブルFVGの色   (Bullish FVG Color)。 ベアFVGの色   (Bearish FVG Color)。 柔軟なFVGの視覚化: FVGを検索するための最大ローソク足数。 FVGゾーンの追加延長(特定のバー数)。 FVGの塗りつぶしを有効にするオプション。 中央線(Middle Line): 線の色とスタイルの選択(例:点線)。 線の太さの調整。 一般設定: FVGを現在のバーまで拡張。 塗りつぶしのある歴史的なFVGを除外し、最新のデータに焦点を当てる。 チャート上の非効率性の領域を分析し、根拠のある取引決定を行う簡単で効果的な方法。
FREE
Free automatic Fibonacci is an indicator that automatically plots a Fibonacci retracement based on the number of bars you select on the BarsToScan setting in the indicator. The Fibonacci is automatically updated in real time as new highest and lowest values appears amongst the selected bars. You can select which level values to be displayed in the indicator settings. You can also select the color of the levels thus enabling the trader to be able to attach the indicator several times with differe
FREE
High Low Open Close
Alexandre Borela
4.98 (43)
このプロジェクトが好きなら、5つ星レビューを残してください。 このインジケータは、指定されたためのオープン、ハイ、ロー、クローズ価格を描画します 特定のタイムゾーンの期間と調整が可能です。 これらは、多くの機関や専門家によって見られた重要なレベルです トレーダーは、彼らがより多くのかもしれない場所を知るために有用であり、 アクティブ。 利用可能な期間は次のとおりです。 前の日。 前週。 前の月。 前の四半期。 前年。 または: 現在の日。 現在の週。 現在の月。 現在の四半期。 現年。
FREE
Indicator and Expert Adviser  EA Available in the comments section of this product. Download with Indicator must have indicator installed for EA to work. Mt5 indicator alerts for bollinger band and envelope extremes occurring at the same time. Buy signal alerts occur when A bullish candle has formed below both the lower bollinger band and the lower envelope  Bar must open and close below both these indicators. Sell signal occur when A bear bar is formed above the upper bollinger band and upper
FREE
RSI abcd
Francisco Gomes Da Silva
RSI ABCDパターンファインダー:テクニカル戦略 1. インジケーターの仕組み 古典的RSI と ABCD調和パターン の自動検出を組み合わせたものです。 主要コンポーネント 標準RSI (調整可能な期間) 高値・安値マーカー (矢印) ABCDパターン (緑/赤の線) 過買(70)・過売(30)フィルター 2. MT5設定 period = 14 ; // RSI期間 size = 4 ; // 最大パターンサイズ OverBought = 70 ; // 過買水準 OverSold = 30 ; // 過売水準 Filter = USE_FILTER_ YES ; // 確認フィルター 3. 取引戦略 3.1. 買いエントリー(強気ABCD) 条件: RSIが以下を形成: 谷( A )→ 山( B )→ より高い谷( C ) D が過売域(30)より上だが C より下 確認:A-B-C-Dを結ぶ緑色の線 目標: TP1: B-Cの61.8% TP2: B-Cの100% ストップロス: D より下 3.2. 売りエントリー(弱気ABCD) 条件: RSIが以下を形成: 山( A
FREE
Follow The Line MT5
Oliver Gideon Amofa Appiah
4.52 (29)
This indicator obeys the popular maxim that: "THE TREND IS YOUR FRIEND" It paints a GREEN line for BUY and also paints a RED line for SELL. (you can change the colors). It gives alarms and alerts of all kinds. IT DOES NOT REPAINT and can be used for all currency pairs and timeframes. Yes, as easy and simple as that. Even a newbie can use it to make great and reliable trades. NB: For best results, get my other premium indicators for more powerful and reliable signals. Get them here: https://www.m
FREE
インジケーター   "Haven Key Levels PDH PDL"   は、トレーダーがチャート上の重要なレベルを視覚化するのを支援します。次のレベルを自動的にマークします: DO (Daily Open)   — 日の開始レベル。 NYM (New York Midnight)   — ニューヨークの真夜中レベル。 PDH (Previous Day High)   — 前日の最高値。 PDL (Previous Day Low)   — 前日の最安値。 WO (Weekly Open)   — 週の開始レベル。 MO (Monthly Open)   — 月の開始レベル。 PWH (Previous Week High)   — 前週の最高値。 PWL (Previous Week Low)   — 前週の最安値。 その他の製品 ->  ここ ツールのカスタマイズオプション: 色とラインの太さの選択: レベルの色設定:   NYM, DO, WO, MO, PDH, PDL, PWH, PWL. ラインの太さの調整。 レベルの表示制御: レベルのライン表示のオン/オフ:
FREE
トレンドキャッチャー: アラートインジケーター付きのトレンドキャッチャーストラテジーは、市場トレンドやポテンシャルなエントリーポイントやエグジットポイントを特定するのに役立つ多目的な技術分析ツールです。動的なトレンドキャッチャーストラテジーを備えており、市場状況に適応してトレンドの方向を明確に視覚化します。トレーダーは、自身の好みやリスク許容度に合わせてパラメーターをカスタマイズできます。このインジケーターはトレンドの識別を支援し、ポテンシャルなリバーサルをシグナルし、トレイリングストップのメカニズムとして機能し、市場への迅速な対応のためのリアルタイムアラートを提供します。 特徴: - トレンドの識別:上昇トレンドと下降トレンドをシグナルします。 - トレンドのリバーサル:ローソク足の色が上昇から下降に変わった場合やその逆の場合に、ポテンシャルなリバーサルを警告します。 - リアルタイムアラート:新しいトレンドの識別に対するアラートを生成します。 推奨事項: - 通貨ペア:EURUSD、AUDUSD、XAUUSDなど... - タイムフレーム:H1。 - アカウントタイプ:
FREE
Introduction Reversal Candles is a cutting-edge non-repainting   forex indicator designed to predict price reversals with remarkable accuracy through a sophisticated combination of signals. Signal Buy when the last closed candle has a darker color (customizable) and an up arrow is painted below it Sell when the last closed candle has a darker color (customizable) and a down arrow is painted above it
FREE
The indicator is based on Robert Miner's methodology described in his book "High probability trading strategies" and displays signals along with momentum of 2 timeframes. A Stochastic oscillator is used as a momentum indicator. The settings speak for themselves period_1 is the current timeframe, 'current' period_2 is indicated - the senior timeframe is 4 or 5 times larger than the current one. For example, if the current one is 5 minutes, then the older one will be 20 minutes The rest of the s
FREE
Easy GOLD MT5
Franck Martin
4 (33)
Easy Gold is the latest addition to the BotGPT family. It is surprising and very powerful. It is ideal for beginners due to its simplicity.  There is absolutely nothing to do, it's 100% automated, simply indicate the percentage of risk you want to take per trade and the EA is ready. Whatever your capital, the EA takes care of everything. Optimized on (XAUUSD).  Unleash all the power with the professional version (AGI Gold) and its connection to the neural network, available in my store. My othe
FREE
Are you tired of drawing trendlines every time you're analyzing charts? Or perhaps you would like more consistency in your technical analysis. Then this is for you. This indicator will draw trend lines automatically when dropped on a chart. How it works Works similar to standard deviation channel found on mt4 and mt5. It has 2 parameters: 1. Starting Bar 2. Number of bars for calculation The   starting bar   is the bar which drawing of the trend lines will begin, while the   number of bars for c
FREE
Value Chart Candlesticks
Flavio Javier Jarabeck
4.73 (11)
The idea of a Value Chart indicator was presented in the very good book I read back in 2020 , " Dynamic Trading Indicators: Winning with Value Charts and Price Action Profile ", from the authors Mark Helweg and David Stendahl. The idea is simple and the result is pure genius: Present candlestick Price analysis in a detrended way! HOW TO READ THIS INDICATOR Look for Overbought and Oversold levels. Of course, you will need to test the settings a lot to find the "correct" one for your approach. It
FREE
Coral trend is   a trend-following indicator that is widely popular among FOREX traders . It is usually used as a confluence with other indicators. It uses combinations of moving averages with complex smoothing formulas! It has two configurable parameters: Coefficient   - smoothing ratio (*) Applied price Calculation: Coral = (-0.064) * B6 + 0.672 * B5 - 2.352 * B4 + 2.744 * B3
FREE
The indicator identifies when a divergence occurs between price and an indicator or oscillator. It identifies both regular and hidden divergences. Combined with your own rules and techniques, this indicator will allow you to create (or enhance) your own powerful system. Features Can detect divergences for the following oscillators/indicators:   MACD, OsMA, Stochastics, RSI, CCI, RVI, Awesome, ADX, ATR, OBV, Composite index, MFI and Momentum. Only one oscillator/indicator can be selected. Draws
FREE
Important Lines
Terence Gronowski
4.86 (21)
This indicator displays Pivot-Lines, preday high and low, preday close and the minimum and maximum of the previous hour. You just have to put this single indicator to the chart to have all these important lines, no need to setup many single indicators. Why certain lines are important Preday high and low : These are watched by traders who trade in a daily chart. Very often, if price climbs over or falls under a preday low/high there is an acceleration in buying/selling. It is a breakout out of a
FREE
Contact me for any queries or custom orders, if you want to use this in an EA. Key Features: Pattern Recognition : Identifies Fair Value Gaps (FVGs) Spots Break of Structure (BOS) points Detects Change of Character (CHoCH) patterns Versatile Application : Optimized for candlestick charts Compatible with any chart type and financial instrument Real-Time and Historical Analysis : Works seamlessly with both real-time and historical data Allows for backtesting strategies and live market analysis Vis
FREE
平均足(ヘイキンアシ)MT5インジケーター 平均足(ヘイキンアシ)MT5インジケーターは、標準的な価格データをより滑らかでトレンドに沿ったローソク足に変換し、市場トレンドや潜在的な反転ポイントをより簡単に識別できるようにする強力なツールです。 主な特徴: 明確なトレンド識別: 異なるローソク足の色で上昇トレンドと下降トレンドを視覚的に区別します。 ノイズの低減: 価格変動をフィルタリングし、 市場の主要な動きをより明確に表示します。 早期トレンド検出: 標準チャートでトレンドの変化が明らかになる前に、 潜在的なトレンド変化を予測します。 汎用性: 単独で使用することも、 他のテクニカル指標と組み合わせて総合的な分析を行うこともできます。 カスタマイズ可能な設定: インジケーターを特定の取引設定や戦略に合わせて調整できます。 メリット: トレンドを特定し、 潜在的なエントリーポイントと出口ポイントを識別する能力を向上させます。 市場ノイズの影響を減らし、 重要な価格変動に集中します。 市場ダイナミクスをより明確に理解することで、 より情報に基づいた取引決定を行うことができます。 検証済
FREE
The one minute chart has a bug, but the one-day chart can still be used after deleting the bug and reloading the indicators, This indicator can be used to determine how far the indicator goes up to place an order to buy, how far it goes down to place an order to sell, and not placing an order until it reaches this distance, which is considered oscillation, open an account gift index
FREE
This indicator is a zero-lag indicator and displays  strength of trend change . True Trend  Oscillator Pro works best in combination with True Trend Moving Average Pro that displays exact trend as is. Oscillator value is exact price change in given direction of the trend. True Trend Moving Average Pro: https://www.mql5.com/en/market/product/103586 If you set PERIOD input parameter to 1 this indicator becomes a sharpshooter for binary options. Developers can use True Trend Oscillator in Exper
FREE
ピボットポイントフィボRSJは、フィボナッチレートを使用してその日のサポートラインとレジスタンスラインを追跡するインジケーターです。 この壮大な指標は、フィボナッチレートを使用してピボットポイントを通じて最大7レベルのサポートとレジスタンスを作成します。 価格がこのサポートとレジスタンスの各レベルを尊重する方法は素晴らしいです。そこでは、オペレーションの可能な入口/出口ポイントを認識することができます。 特徴 最大7レベルのサポートと7レベルの抵抗 レベルの色を個別に設定します 入力 ピボットタイプ ピボットフィボRSJ1 =フィボ比1の計算 ピボットフィボRSJ2 =フィボ比2の計算 ピボットフィボRSJ3 =フィボ比3の計算 ピボットフィボクラシック=クラシックピボット計算 最小ピボットレベル ピボット3レベル ピボット4レベル ピボット5レベル ピボット6レベル ピボット7レベル それでも質問がある場合は、ダイレクトメッセージで私に連絡してください: https://www.mql5.com/ja/users/robsjunqueira/
FREE
The indicator highlights the points that a professional trader sees in ordinary indicators. VisualVol visually displays different volatility indicators on a single scale and a common align. Highlights the excess of volume indicators in color. At the same time, Tick and Real Volume, Actual range, ATR, candle size and return (open-close difference) can be displayed. Thanks to VisualVol, you will see the market periods and the right time for different trading operations. This version is intended f
FREE
RSI On Moving Average Indicator for MT5 The RSI On Moving Average Indicator Merges Moving Average Crossovers with the Relative Strength Index (RSI) to provide a powerful tool for assessing market momentum and trend direction. By integrating these two analytical methods, this indicator enhances trading precision, helping traders identify potential buy and sell opportunities more effectively. This indicator operates with two oscillating lines fluctuating between 0 and 100 , which signal optimal en
FREE
価格波形パターン MT5へようこそ --(ABCD パターン)-- ABCD パターンは、テクニカル分析の世界で強力で広く使用されている取引パターンです。 これは、トレーダーが市場での潜在的な売買機会を特定するために使用する調和的な価格パターンです。 ABCD パターンを使用すると、トレーダーは潜在的な価格変動を予測し、いつ取引を開始および終了するかについて十分な情報に基づいた決定を下すことができます。 EA バージョン:     Price Wave   EA MT5 MT4バージョン:   Price Wave Pattern MT4 特徴 :  ABCDパターンの自動検出。 強気パターンと弱気パターン。  任意のシンボルと任意の時間枠で機能します。 主要なレベルと価格目標。 カスタマイズ可能な設定と繊維レベルの調整。 アラートと通知。 今後  さらに多くの 機能が追加される  予定です 。
FREE
RSI with alerts BDA
Laron Demetris Burrows
4.92 (24)
このアルゴリズムは、86%*の精度で価格の短期的な変化を予測します。 ATRによって決定されるように大きな動きがある場合,買われ過ぎや売られ過ぎの状態の間に,インジケータはあなたに警告します. 価格が信号キャンドルよりも高いか低いかを予測します。 より大きな時間枠で平均復帰取引、バイナリオプションや先物契約のための完璧な。 この指標は5年間のデータに基づいてバックテストされ、時間の経過とともに価格の逆転を予測するための90%の精度を持っています。 特徴: 簡単なセットアップ 任意のグラフにドラッグアンドドロップ お好みに合わせてパラメータを調整(オプション) アラートを有効にする(オプション) そして、あなたは完了です! 視覚的および音声的な警告 お使いの携帯電話に直接送信されるアラート 端末に送信されるポップアップ警告 高いwinrate 取引の最大90%を獲得 バックテストされた5年と複数の通貨。 (バックテストの詳細と分析については、ウェブサイトを参照してください)。 多数の信号 シンボル*ごとに1日に2つの信号を期待しています。 *これは30分の蝋燭の表示器があればありま
FREE
Dual RSI
Paul Conrad Carlson
3 (1)
Indicator alerts for Dual Relative strength index rsi. Large rsi preset at 14 is below 30 small rsi preset at 4 is below 10 for buy bullish signals . Large rsi preset are 14 is above 70 small rsi preset at 4 is above 90 for sell bearish signals . Includes mobile and terminal alerts. draws lines when alerts. This indicator can help identify extremes and then the tops or bottoms of those extremes .
FREE
Cybertrade Keltner Channels - MT5 Created by Chester Keltner, this is a volatility indicator used by technical analysis. It is possible to follow the trend of financial asset prices and generate support and resistance patterns. In addition, envelopes are a way of tracking volatility in order to identify opportunities to buy and sell these assets. It works on periods longer than the period visible on the chart. All values ​​are available in the form of buffers to simplify possible automations.
FREE
Introducing the Consecutive Green/Red Candle Alert Indicator for MT5 - Your Trend Spotting Companion! Are you ready to take your trading to the next level? We present the Consecutive Green/Red Candle Alert Indicator, a powerful tool designed to help you spot trends and potential reversals with ease. Whether you're a new trader looking for clarity in the market or an experienced pro seeking additional confirmation, this indicator is your trusted companion. Key Features of the Consecutive Green
FREE
About the indicator: DALA Forecast is a universal tool for predicting the dynamics of time series of any nature. For prediction, modified methods of nonlinear dynamics analysis are used, on the basis of which a predictive model is built using machine learning methods.  To get the trial version of the indicator, you can contact me in private messages. How to use the indicator: Apply the indicator to your chosen financial instrument or indicator with the settings you need. The prediction will be
FREE
TK Rainbow
Nguyen Trung Khiem
5 (1)
TK - Rainbow インジケーター 説明: TK - Rainbow インジケーターは、複数のラインアプローチを通じて市場のトレンドを明確に表示するために設計された強力なテクニカル分析ツールです。異なる期間で計算された30本のラインを使用して、価格の動きの広範な分析を提供します。このインジケーターは、上昇トレンドと下降トレンドを際立たせるために二色スキームを使用しており、市場の状況を一目で簡単に解釈できます。 主な特徴: 30本のライン: 各ラインは異なる平滑化期間を表し、広範な市場トレンドをカバーします。 二色スキーム: 上昇トレンド(寒色)と下降トレンド(暖色)を区別するために二色を使用します。 カスタマイズ可能な設定: トレードの好みに合わせてラインの幅、スタイル、ステップサイズを調整できます。 TK - Rainbowの使い方: インジケーターの適用: TK - Rainbow インジケーターをMetaTrader 5のインジケーターリストからチャートに追加します。 パラメーターの設定: ステップ (inpStep): 各ライン間の期間の増分を定義します。これを調整してラ
FREE
このプロダクトを購入した人は以下も購入しています
NOTE: CYCLEMAESTRO is distributed only on this website, there are no other distributors. Demo version is for reference only and is not supported. Full versione is perfectly functional and it is supported. CYCLEMAESTRO , the first and only indicator of Cyclic Analysis, useful for giving signals of TRADING, BUY, SELL, STOP LOSS, ADDING. Created on the logic of   Serghei Istrati   and programmed by   Stefano Frisetti ;   CYCLEMAESTRO   is not an indicator like the others, the challenge was to inter
今、147ドル(いくつかの更新後に499ドルに増加します) - 無制限のアカウント(PCSまたはMac) RelicusRoad ユーザー マニュアル + トレーニング ビデオ + プライベート Discord グループへのアクセス + VIP ステータス 市場の新しい見方 RelicusRoad は、外国為替、先物、暗号通貨、株式、および指数の世界で最も強力な取引インジケーターであり、トレーダーに収益を維持するために必要なすべての情報とツールを提供します。初心者から上級者まで、すべてのトレーダーが成功するためのテクニカル分析と取引計画を提供します。これは、将来の市場を予測するのに十分な情報を提供する重要な取引指標です。意味をなさないチャート上のいくつかの異なる指標ではなく、完全な解決策を信じています.これは、信号、矢印 + 価格アクション情報を表示するオールインワンのインジケーターで、他に類を見ない非常に正確です。 強力な AI に基づいて、RelicusRoad は不足している情報とツールを提供して、あなたを教育し、トレーディングのプロ、成功したトレーダーにします。 ほと
反転ゾーン / ピークボリューム / 主要プレーヤーのアクティブゾーン =       TS TPSプロシステム 説明書 RUS       /       説明書     英語     /           バージョン MT4        このインジケーターを購入したすべての購入者は、さらに以下を無料で受け取ります: RFI SIGNALS サービスからの取引シグナルへの 6 か月間のアクセス - TPSproSYSTEM アルゴリズムに従った既製のエントリ ポイント。 定期的に更新されるトレーニング資料 - 戦略に没頭し、プロフェッショナル レベルを高めます。 平日は 24 時間 365 日サポート、非公開のトレーダー チャットへのアクセス - コミュニケーション、サポート、市場状況の分析。 著者の設定ファイル - 余分な労力をかけずに最大の結果を達成するための自動インジケーター設定。 主な機能: 売り手と買い手のアクティブなゾーンを表示します。 このインジケーターは、購入と販売の正しい最初のインパルス レベル/ゾーンをすべて表示します。これらのレベル/ゾーンがアクティブに
MONEYTRON – ТВОЙ ЛИЧНЫЙ СИГНАЛ НА УСПЕХ! XAUUSD | AUDUSD | USDJPY | BTCUSD Поддержка таймфреймов: M5, M15, M30, H1 Почему трейдеры выбирают Moneytron? 82% успешных сделок — это не просто цифры, это результат продуманной логики, точного алгоритма и настоящей силы анализа. Автоматические сигналы на вход — не нужно гадать: когда покупать, когда продавать. 3 уровня Take Profit — ты сам выбираешь свой уровень прибыли: безопасный, уверенный или максимум. Четкий Stop Loss — контролируешь риск
MetaForecast M5
Vahidreza Heidar Gholami
5 (3)
MetaForecastは、価格データのハーモニクスに基づいて、どんな市場の未来を予測し視覚化します。市場が常に予測可能ではありませんが、価格にパターンがある場合、MetaForecastは可能な限り正確な未来を予測できます。他の類似製品と比較して、MetaForecastは市場のトレンドを分析することでより正確な結果を生成することができます。 入力パラメータ Past size (過去のサイズ) MetaForecastが将来の予測を生成するために使用するバーの数を指定します。モデルは選択したバー上に描かれた黄色の線で表されます。 Future size (将来のサイズ) 予測すべき将来のバーの数を指定します。予測された将来は、ピンクの線で表示され、その上に青い回帰線が描かれます。 Degree (程度) この入力は、MetaForecastが市場で行う分析のレベルを決定します。 Degree 説明  0 Degree 0の場合、価格の全てのピークや谷、そして詳細をカバーするために、「Past size」の入力に大きな値を使用することが推奨されています。  1 (推奨) Degre
CBT Quantum Maverick 高効率バイナリーオプション取引システム CBT Quantum Maverickは、高いパフォーマンスとシンプルさを追求するトレーダー向けに設計されたバイナリーオプション取引システムです。カスタマイズの必要がなく、最適化された状態で使用を開始できます。シグナルに従うだけで、少しの練習でマスターできます。 主な特徴: シグナルの精度: 現在のローソク足を基に次のローソク足の取引シグナルを生成し、頻繁な再描画がありません。 多様な市場対応: バイナリーオプション取引に特化し、さまざまなブローカーや資産クラスに対応しています。 対応可能: Deriv Synthetic Charts :すべてのタイムフレームで使用可能。 OTCチャート :Quotex、PocketOption、Binomo、Stockity、IQOption、Exnova、OlympTrade、Deriv、Binolla、Homebrokerなどのブローカーに対応。MT5へのインポートは最初の1週間無料、その後は有料サービス。 FX、仮想通貨、商品市場 :幅広い資産利用が可能
IQ Gold Gann Levels a non-repainting, precision tool designed exclusively for XAUUSD/Gold intraday trading. It uses W.D. Gann’s square root method to plot real-time support and resistance levels, helping traders spot high-probability entries with confidence and clarity. William Delbert Gann (W.D. Gann) was an exceptional market analyst, whose trading technique was based on a complex blend of mathematics, geometry, astrology, and ancient mathematics which proved to be extremely accurate. Download
WHY IS OUR FXACCCURATE LS MT5 THE PROFITABLE ? PROTECT YOUR CAPITAL WITH RISK MANAGEMENT Gives entry, stop and target levels from time to time. It finds Trading opportunities by analyzing what the price is doing during established trends. POWERFUL INDICATOR FOR A RELIABLE STRATEGIES We have made these indicators with a lot of years of hard work. It is made at a very advanced level. Established trends provide dozens of trading opportunities, but most trend indicators completely ignore them! The
プレシジョン・インデックス・オシレーター(Pi-Osc)は、Precision Trading SystemsのRoger Medcalfによるものです。 バージョン2は、チャートにスーパーファストでロードされるように注意深く再コードされ、その他の技術的な改良も組み込まれて、エクスペリエンスを向上させています。 Pi-Oscは、市場が強制的に行かなければならない、すべての人のストップを取り除くためのポイントである、極限のエクソースト・ポイントを見つけるために設計された正確な取引タイミング信号を提供するために作成されました。 この製品は、極限のポイントがどこにあるかを知るという古代の問題を解決し、トレーダーの生活をはるかにシンプルにします。 これは、業界標準のオシレーターとは異なる強力な要素を持つ高度なコンセンサス・インジケーターです。 使用されている一部の機能には、需要指数、マネーフロー、RSI、スティリング、パターン認識、出来高分析、標準偏差の極値などがあり、異なる長さでこれらのバリエーションが多く含まれています。 初めて見ると、訓練されていない目には、他のオシレーター
The   Time_Price_SQ9_Degree   indicator is based on the 9 Gann square. Using this indicator, you can identify strong time and price zones. The indicator displays the levels as a degree value. The degrees can be set in the settings. After launching, the MENU button appears. If it is highlighted, it can be moved to any point on the graph, and after double-clicking on it, it stops being highlighted and menu buttons appear. To hide the menu, just double-click on the button, it will become highlight
説明 ICSM(Impulse-Correction SCOB Mapper)は、価格の動きを分析し、有効なインパルス、修正、およびSCOB(Single Candle Order Block)を識別するインジケーターです。柔軟性があり、情報量が多く、使いやすく、最も流動性の高い関心領域に対するトレーダーの認識を大幅に向上させるため、あらゆるタイプのテクニカル分析で使用できる強力なツールです。 設定 一般 | ビジュアル カラーテーマ — ICSMのカラーテーマを定義します。 SCOB | ビジュアル SCOBを表示 — SCOBを有効/無効にします; SCOBをマークする — SCOB表現のスタイルオプションのリストを表します; SCOB色 — SCOBの色を定義します; ICM | ビジュアル ICMラインを表示 — ICM(Impulse-Correction Mapper)ラインを有効/無効にします; ICトレンドを表示 — チャートの下部にある色付きの仕切りを通じてインパルス-修正トレンドの視覚化を有効/無効にします; ライン色 — ICMラインの色
収益性の高い取引機会を簡単に特定するのに役立つ強力な外国為替取引インジケーターをお探しですか?ビースト スーパー シグナル以外に探す必要はありません。 この使いやすいトレンドベースのインジケーターは、市場の状況を継続的に監視し、新しいトレンドを検索したり、既存のトレンドに飛びついたりします。ビースト スーパー シグナルは、すべての内部戦略が一致し、互いに 100% 合流したときに売買シグナルを発するため、追加の確認は不要です。シグナル矢印アラートを受け取ったら、単に売買します。 購入後、プライベート VIP グループに追加されるようにメッセージを送ってください! (完全な製品購入のみ)。 購入後、最新の最適化されたセット ファイルについてメッセージを送ってください。 MT4版は こちらから。 Beast Super Signal EA は こちらから 入手できます。 コメント セクションをチェックして、最新の結果を確認してください。 ビースト スーパー シグナルは、1:1、1:2、または 1:3 のリスクと報酬の比率に基づいて、エントリー価格、ストップ ロス、テイク プ
TPA True Price Action indicator reveals the true price action of the market makers through 100% non-repainting signals strictly at the close of a candle! TPA shows entries and re-entries, every time the bulls are definitely stronger than the bears and vice versa. Not to confuse with red/green candles. The shift of power gets confirmed at the earliest stage and is ONE exit strategy of several. There are available now two free parts of the TPA User Guide for our customers. The first "The Basics"
The AT Forex Indicator MT5 is a sophisticated trading tool designed to provide traders with a comprehensive analysis of multiple currency pairs. This powerful indicator simplifies the complex nature of the forex market, making it accessible for both novice and experienced traders. AT Forex Indicator uses advanced algorithms to detect trends, patterns and is an essential tool for traders aiming to enhance their forex trading performance. With its robust features, ease of use, and reliable signal
[ MT4 Version ]  [ Order Blocks ]  [ Kill Zones ]  [ SMT Divergences ] How to trade using Order Blocks :  Click here User Interface Performance:  During testing in the strategy tester, the UI may experience lag. Rest assured, this issue is specific to the testing environment and does not affect the indicator's performance in live trading. Elevate your trading strategy with the  Order Blocks ICT Multi TF  indicator, a cutting-edge tool designed to enhance your trading decisions through advanced o
[ MT4 Version ]  [ Kill Zones ]  [ SMT Divergences ] How to trade using Order Blocks:  Click here User Interface Performance:  During testing in the strategy tester, the UI may experience lag. Rest assured, this issue is specific to the testing environment and does not affect the indicator's performance in live trading. Elevate your trading strategy with the  Order Blocks ICT Multi TF  indicator, a cutting-edge tool designed to enhance your trading decisions through advanced order block analysis
Visual Heatmap Book Analyser This indicator monitors the market liquidity and generates colors based on order patterns, quantities, and renewal activities in the book. This allows you to visualize the order flow and identify areas of high and low liquidity and activity. The indicator uses machine learning techniques to analyze the order behavior in the book, enabling it to detect patterns and trends in orders, allowing you to make informed decisions about your trading operations. The color pale
MT4 Version SMT Divergences MT5 SMT Divergences is one of the most innovative indicators in the market. It offers the possibility of analyzing price divergences between 2 pairs. These divergences highlight and help to foresee what banks and institutions are planning to do. SMT divergences also provides you with a kill zones indicator and the possibility of filtering divergences occurring during these kill zones.  This indicator is specially powerful if applied in 2 highly correlated pairs. A pri
How to use Pair Trading Station Pair Trading Station is recommended for H1 time frame and you can use it for any currency pairs. To generate buy and sell signal, follow few steps below to apply Pair Trading Station to your MetaTrader terminal. When you load Pair Trading Station on your chart, Pair Trading station will assess available historical data in your MetaTrader platforms for each currency pair. On your chart, the amount of historical data available will be displayed for each currency pai
The Naveen Dynamic Square  MT5  is one of the best known  technical analysis tools  inspired  by WD Gann along with the Gann Fan and Gann Box. It is considered a cornerstone of his trading technique that is based on time and price symmetry. The Naveen Dynamic Square MT5   is a powerful tool in finance for determining support and resistance levels based on a stock's extreme price points. It works by extrapolating probable price levels from a central value, typically an all-time or cyclical high o
Reversal ALGO
Muhammad Abdullah Bhatti
Reversal Algo は、市場のトレンド転換点を特定するために設計された高度なテクニカル指標です。過去の価格データを詳細に分析し、トレンドの変化を示唆する重要な高値と安値を検出します。チャート上に明確な視覚シグナルを提供し、トレーダーが転換点となる可能性のある重要なエリアを特定できるようにします。 主な特徴 重要な価格レベルの検出: Reversal Algo は過去の価格データをスキャンし、市場ノイズを排除しながら、統計的に重要な高値・安値を特定します。 高度なノイズフィルター: ボラティリティに基づいたフィルターを使用し、小さな価格変動による誤ったシグナルを最小限に抑えます。 カスタマイズ可能なパラメータ: 感度や閾値を調整できるため、トレードスタイルや市場環境に応じて最適化が可能です。 強力なデータ分析: 過去の価格データを幅広く分析し、市場の動向を把握するための有益な情報を提供します。 仕組み 極値レベルの分析: 市場の高値・安値を詳細に評価し、ボラティリティ閾値を適用することで、重要な価格変動のみを抽出します。 シグナルの確認: 他のテクニカル指標(オシレー
Super Zone   For several years of observing the principles of the market, Super Zone worked, both then and now, because the indicator  allows you to see the trading range of the  week and even the month that major market participants use. It’s very easy to use, we work on H4 in the weekly range (  in the tester it doesn’t work in the demo mode  ) - we sell from the upper zones, we buy from the lower ones. It marks the zones from the beginning of the week (month) that are  not redrawn  , works on
This indicator is based on the mathematics of the great trader W.D. Ganna. With its help, you can easily find strong levels by analyzing swings to find the optimal entry point. The indicator works on all instruments and all timeframes. The indicator is fully manual and has control buttons. All you need to do is press the NEW button, a segment will appear, which you can place on any movement, swing or even 1 candle that you want to analyze. By placing the segment, press the OK button. A grid (th
IQ FX Gann Levels a precision trading indicator based on W.D. Gann’s square root methods. It plots real-time, non-repainting support and resistance levels to help traders confidently spot intraday and scalping opportunities with high accuracy. William Delbert Gann (W.D. Gann) was an exceptional market analyst, whose trading technique was based on a complex blend of mathematics, geometry, astrology, and ancient mathematics which proved to be extremely accurate. Download the Metatrader 4 Version M
This indicator identifies and displays zones, as it were areas of strength, where the price will unfold. The indicator can work on any chart, any instrument, at any timeframe. The indicator has two modes. The indicator is equipped with a control panel with buttons for convenience and split into two modes. Manual mode: To work with manual mode, you need to press the NEW button, a segment will appear. This segment is stretched over the movement and the LVL button is pressed. The level is displayed
note: this indicator is for METATRADER4, if you want the version for METATRADER5 this is the link:  https://www.mql5.com/it/market/product/108106 TRENDMAESTRO ver 2.4 TRENDMAESTRO recognizes a new TREND in the bud, he never makes mistakes. The certainty of identifying a new TREND is priceless. DESCRIPTION TRENDMAESTRO identifies a new TREND in the bud, this indicator examines the volatility, volumes and momentum to identify the moment in which there is an explosion of one or more of these data a
Elliot Waves Analyzer Pro calculates Elliot Waves to Help Identify Trend direction and Entry Levels. Mainly for Swing Trading Strategies. Usually one would open a Position in trend direction for Wave 3 or a Correction for Wave C . This Indicator draws Target Levels for the current and next wave. Most important Rules for Elliot Wave Analysis are verified by the Indicator.  The Pro version analyzes Multiple Timeframes and shows the Subwaves and Target-Levels.   For an Overview  " Elliot Waves Anal
TMA Channel is a price channel obtained through a special calculation method based on traditional TMA . The channel has upper, middle, and lower tracks . When the price approaches or exceeds the upper track, it is already in an overbought state, and attention should be paid to the situation of reversal and decline; When the price approaches or falls below the lower track, it is already in an oversold state, and attention should be paid to the situation of reversal and rise . The indicator will
Micro  ******************* Секундные графики MT5 ********************** Более точного инструмента для входа в сделку вы не найдёте. Входные параметры: Timeframe, sek - период построения графика, секунды Displayed bars - отображаемые бары Step of price levels, pp, 0-off - шаг отрисовки ценовых уровней, пункты Scale points per bar, 0-off - масштаб в пунктах на бар Show lines - отображение текущих уровней Show comment - отображение комментария Standard color scheme - стандартная цветовая сх
Gannスクエアインジケーターは、W.D. Gannによって執筆された「市場予測のための数学的な式」の記事に基づく強力な市場分析ツールです。このツールは、解析に数学的な概念を応用し、Gann理論に基づいています。それは、144、90、52のスクエアや9のスクエアなど、Gannの関連テクニックの要素を取り入れています。さらに、の方法を組み込んでおり、9のスクエアとその関連性についてのチャネルやスターパターンに焦点を当てています。 ユーザーマニュアルと使用方法: このインジケーターを使用する前に、ユーザーマニュアルを読んで疑問点を解決するためにお問い合わせいただくことをお勧めします。ユーザーマニュアルの完全版は、当社のウェブサイトで入手できます。 MT5の完全版は購入できますし、MT4の無料版も試すことができます。両方のバージョンへのリンクを提供していますので、ご利用ください。 主な機能と機能: Gannスクエアインジケーターは、市場分析のための完全なツールセットを提供し、幾何学的な概念とGann理論に基づいて的確な判断を行う手助けをします。以下に主な機能を示します。 9のスクエアの分析:
作者のその他のプロダクト
UZFX - MetaTrader 5 (MT5)用の必要証拠金および最大ロットサイズスクリプトは、トレーダーが1ロットポジションを建てるために必要な証拠金を迅速に決定し、現在の口座資本に基づいて取引可能な最大ロットサイズを計算できるように設計されています。このツールはリスク管理とポジションサイジングに不可欠であり、トレーダーは効率的に取引計画を立てることができます。 特徴 選択したシンボルで1ロット取引を開始するために必要な証拠金を計算します。 利用可能な資本に基づいて、トレーダーがオープンできる最大ロットサイズを決定します。 正確な証拠金計算のために現在のアスク価格を使用します。 コメント機能により、結果をチャート上に直接表示。 トレーダーがレバレッジとリスクを管理しながらポジションサイジングを最適化するのに役立ちます。 使用方法 スクリプトを希望の取引シンボルのチャートにアタッチします。 スクリプトが計算し、表示します: 1ロットに必要な証拠金 利用可能な資本に基づく取引可能な最大ロットサイズ 結果はチャートの左上に表示されます。 注意 スクリプトでは、証拠金の計算に
FREE
UZFX - Delete All Drawing and Objects on Chart Instantly は、アクティブなチャートからすべての描画オブジェクトを即座に削除するように設計された、シンプルかつ強力な MetaTrader 5 (MT5) スクリプトです。このスクリプトは、テクニカル分析の描画、トレンドライン、フィボナッチツール、テキストラベル、その他のオブジェクトを手動で1つずつ削除することなく、素早くチャートから消去する必要があるトレーダーに便利です。 特徴 アクティブチャート上の全てのオブジェクトと描画を削除。 一度の実行で即座に動作。 削除の成功と失敗の確認メッセージを表示。 トレーダーがより良い分析のために、クリーンで乱雑でないチャートを維持するのに役立ちます。 使用方法 すべてのオブジェクトを削除したいチャートにスクリプトをアタッチします。 スクリプトは自動的にすべてのオブジェクトをループして削除します。 オブジェクトの削除が完了すると、Expertsタブにメッセージが表示されます。 注:このスクリプトは、チャート上で実行されている未決済注文、イ
FREE
MetaTrader 4 (MT4)用のUZFX - Set Stop Loss to Breakeven Instantlyスクリプトは、トレーダーがすべてのオープンポジションのストップロスをエントリー価格に素早く移動させ、リスクのない取引を確保できる強力なツールです。このスクリプトは、アクティブな取引を効率的に管理するために特に有用で、ポジションが有利に動くと、トレーダーは潜在的な損失から保護されます。 (Visit Profile & Checkout All Other MT4/MT5 Products) (Please Don't Forget to Give Review) Features: すべてのオープンポジションのストップロスを自動的にブレイクイーブン(エントリー価格)に設定します。 利益を確保し、潜在的な損失を最小限に抑えることで、リスク管理を強化します。 使用方法 スクリプトをチャートに貼り付けると、全てのオープンポジションが自動的に調整されます。 ポジションのストップロスがすでにブレイクイーブンにある場合、そのポジションはスキップされます。 注: このス
FREE
MetaTrader 5 (MT5)用のUZFX - Delete Only Pending Ordersスクリプトは、取引口座からすべての未決注文(買い指値、売り指値、買い逆指値、売り逆指値)を自動的に削除するシンプルで効果的なツールです。このスクリプトは、アクティブなマーケットポジションに影響を与えることなく、保留中の注文を即座に消去したいトレーダーに最適です。 特徴 すべての未決注文(買い指値、売り指値、買い逆指値、売り逆指値)を削除します。 未決済のポジションには影響を与えません。 Experts]タブからリアルタイムで約定状況を確認できます。 トレーダーが手動で操作することなく、未決注文のストラテジーを素早くリセットできます。 使用方法 MT5チャートにスクリプトを添付します。 スクリプトはすべての未決注文を自動的にスキャンして削除します。 削除された各注文の確認メッセージが Experts タブに表示されます。 注意 このスクリプトは有効な取引を決済するのではなく、未決注文を削除するだけです。 スクリプトを実行する前に、すべての未決注文を削除することを確認してください
FREE
The   UZFX - Close All Open Buy & Sell Orders Instantly   script for MetaTrader 4 (MT4) is a powerful tool that enables traders to   immediately close all active market positions   with a single execution. This script is ideal for emergency trade management, helping traders quickly exit the market during high volatility, news events, or strategy adjustments. (Visit Profile & Checkout All Other MT4/MT5 Products) (Please Don't Forget to Give Review) Features: Closes   all open Buy and Sell posit
FREE
The   UZFX - Delete All Drawing and Objects on Chart Instantly   is a simple yet powerful MetaTrader 4 (MT4) script designed to instantly remove all drawing objects from the active chart. This script is useful for traders who need to quickly clear their charts from technical analysis drawings, trend lines, Fibonacci tools, text labels, and other objects without manually deleting them one by one. (Visit Profile & Checkout All Other MT4/MT5 Products) (Please Don't Forget to Give Review) Features
FREE
UzFx-Total TP'SL & Timer-MT4 インジケータは、すべての未決済および 保留中の取引にわたる、テイクプロフィット(TP)とストップロス (SL)の合計値をリアルタイムで追跡できるように設計されています。さらに、現在のローソク足が閉じるまでの残り時間を示すローソク足カウントダウン・タイマーを備えています。 (Visit Profile & Checkout All Other MT4/MT5 Products) (Please Don't Forget to Give Review) 主な機能: 自動的に全ての有効な取引と未決注文から予想される利益と損失の合計を計算します。 現在のローソク足がクローズするまでの残り時間を表示し、トレーダーがエントリーとエグジットを効率的に管理できるようにします。 ユーザーは、より見やすいテキストの色、フォントサイズ、位置を設定可能。 チャートが乱雑にならないシンプルで軽量なデザイン。 ユーザー入力: 利食いと損切りの表示色を選択。 ローソク足タイマーの文字色をカスタマイズ。 チャート上のフォントサイズ
FREE
The   UZFX - Delete Only Pending Orders   script for MetaTrader 4 (MT4) is a simple yet effective tool that automatically removes all   pending orders   (Buy Limit, Sell Limit, Buy Stop, Sell Stop) from the trading account. This script is ideal for traders who want to clear their pending orders instantly without affecting active market positions. (Visit Profile & Checkout All Other MT4/MT5 Products) (Please Don't Forget to Give Review) Features: Deletes all   pending orders   (Buy Limit, Sell
FREE
UzFx-Local Currency Converter-MT4は、米ドルと現地通貨の両方で変動損益と日次損益を追跡したいトレーダーのために設計された、強力で使いやすいインジケーターです。このツールは、ユーザー定義の為替レートを使用してリアルタイムで換算し、トレーダーが取引パフォーマンスをより効果的に視覚化できるよう支援します。 (Visit Profile & Checkout All Other MT4/MT5 Products) (Please Don't Forget to Give Review) Key Features USDと現地通貨での損益を表示します。 日次損益計算 - その日のクローズ済み取引の損益を追跡します。 損益をご希望の現地通貨(PKR、INR、AEDなど)に換算 為替レートのカスタマイズ - 正確な換算のために為替レートを手動で設定。 毎日の損失限度額の監視 - 毎日の損失限度額に達するとアラートが表示されます。 午前0時の自動リセット - 毎取引日に日次損益が自動的にリセットされます。 調整可能なUI配置 - チャ
FREE
UzFx-Local Currency Converter-MT5は、米ドルと現地通貨の両方で変動損益と日次損益を追跡したいトレーダーのために設計された、強力で使いやすいインジケーターです。このツールは、ユーザー定義の為替レートを使用してリアルタイムで換算し、トレーダーが取引パフォーマンスをより効果的に視覚化できるよう支援します。 (Visit Profile & Checkout All Other MT4/MT5 Products) (Please Don't Forget to Give Review) Key Features USDと現地通貨での損益を表示します。 日次損益計算 - その日のクローズ済み取引の損益を追跡します。 損益をご希望の現地通貨(PKR、INR、AEDなど)に換算 為替レートのカスタマイズ - 正確な換算のために為替レートを手動で設定。 毎日の損失限度額の監視 - 毎日の損失限度額に達するとアラートが表示されます。 午前0時の自動リセット - 毎取引日に日次損益が自動的にリセットされます。 調整可能なUI配置 - チャ
FREE
MetaTrader 5 (MT5)用のUZFX - Set Stop Loss to Breakeven Instantlyスクリプトは、トレーダーがすべてのオープンポジションのストップロスをエントリー価格に素早く移動させ、リスクのない取引を確保できる強力なツールです。このスクリプトは、アクティブな取引を効率的に管理するために特に有用で、ポジションが有利に動くと、トレーダーは潜在的な損失から保護されます。 (Visit Profile & Checkout All Other MT4/MT5 Products) (Please Don't Forget to Give Review) Features: すべてのオープンポジションのストップロスを自動的にブレイクイーブン(エントリー価格)に設定します。 利益を確保し、潜在的な損失を最小限に抑えることで、リスク管理を強化します。 使用方法 スクリプトをチャートに貼り付けると、全てのオープンポジションが自動的に調整されます。 ポジションのストップロスがすでにブレイクイーブンにある場合、そのポジションはスキップされます。 注: この
MetaTrader 5 (MT5)用のUZFX - Close All Open Buy & Sell Orders Instantlyスクリプトは、トレーダーが1回の約定ですべてのアクティブなマーケットポジションを即座にクローズできる強力なツールです。このスクリプトは、緊急の取引管理に最適で、トレーダーがボラティリティが高い時、ニュースイベント、または戦略の調整中に素早く市場から撤退するのに役立ちます。 特徴 全シンボルの未決済の買いポジションと売りポジションをすべて決済します。 正確な約定のために最新の買値/売値を使用します。 トレーダーが最小限の手作業でマーケットから即座に撤退できるようサポートします。 使用方法 MT5チャートにスクリプトをアタッチします。 スクリプトは、すべての買いポジションと売りポジションをスキャンして決済します。 各決済注文の確認メッセージがExpertsタブに表示されます。 注意: このスクリプトは未決注文を削除しません。 添付チャートだけでなく、すべての取引シンボルで機能します。 スクリプトは即座に実行されるため、スクリプトを実行する前にすべて
UzFx-Total TP'SL & Timer-MT5 インジケータは、すべての未決済および 保留中の取引にわたる、テイクプロフィット(TP)とストップロス (SL)の合計値をリアルタイムで追跡できるように設計されています。さらに、現在のローソク足が閉じるまでの残り時間を示すローソク足カウントダウン・タイマーを備えています。 (Visit Profile & Checkout All Other MT4/MT5 Products) (Please Don't Forget to Give Review) 主な機能: 自動的に全ての有効な取引と未決注文から予想される利益と損失の合計を計算します。 現在のローソク足がクローズするまでの残り時間を表示し、トレーダーがエントリーとエグジットを効率的に管理できるようにします。 ユーザーは、より見やすいテキストの色、フォントサイズ、位置を設定可能。 チャートが乱雑にならないシンプルで軽量なデザイン。 ユーザー入力: 利食いと損切りの表示色を選択。 ローソク足タイマーの文字色をカスタマイズ。 チャート上のフォントサイズ
「この秘密のトレーディングツールはプロップ会社によって禁止されている(彼らはあなたに知られたくない!)」 EAなしで究極のトレーディング・エッジを発見!(トレーダーのために、トレーダーによって作られました。 ロボットではなく、純粋なトレーディング・パワーです。) 偽のブレイクアウト、突然の反転、市場操作に苦戦していませんか?この強力なトレーディングツールは、マーケットが速く動くときでも、レーザー精度のシグナルを提供します! --------------------------------------------------------------------------------------------------- 私のおすすめ:- 最高の電波強度設定 FXペア、金、指数、暗号通貨など、あらゆる種類のシグナルに対応。 ご希望のTFを選択し、バックテスト前に入力タブからシグナル値を変更してください。 >> ( 4または5 ) >> 1m / 5m / 15m / 30m / 1H / 4H の場合 >> (2または3) >>日足/週足/月足用 -----------------
フィルタ:
レビューなし
レビューに返信