• 概要
  • レビュー
  • コメント
  • 最新情報

Star arrows

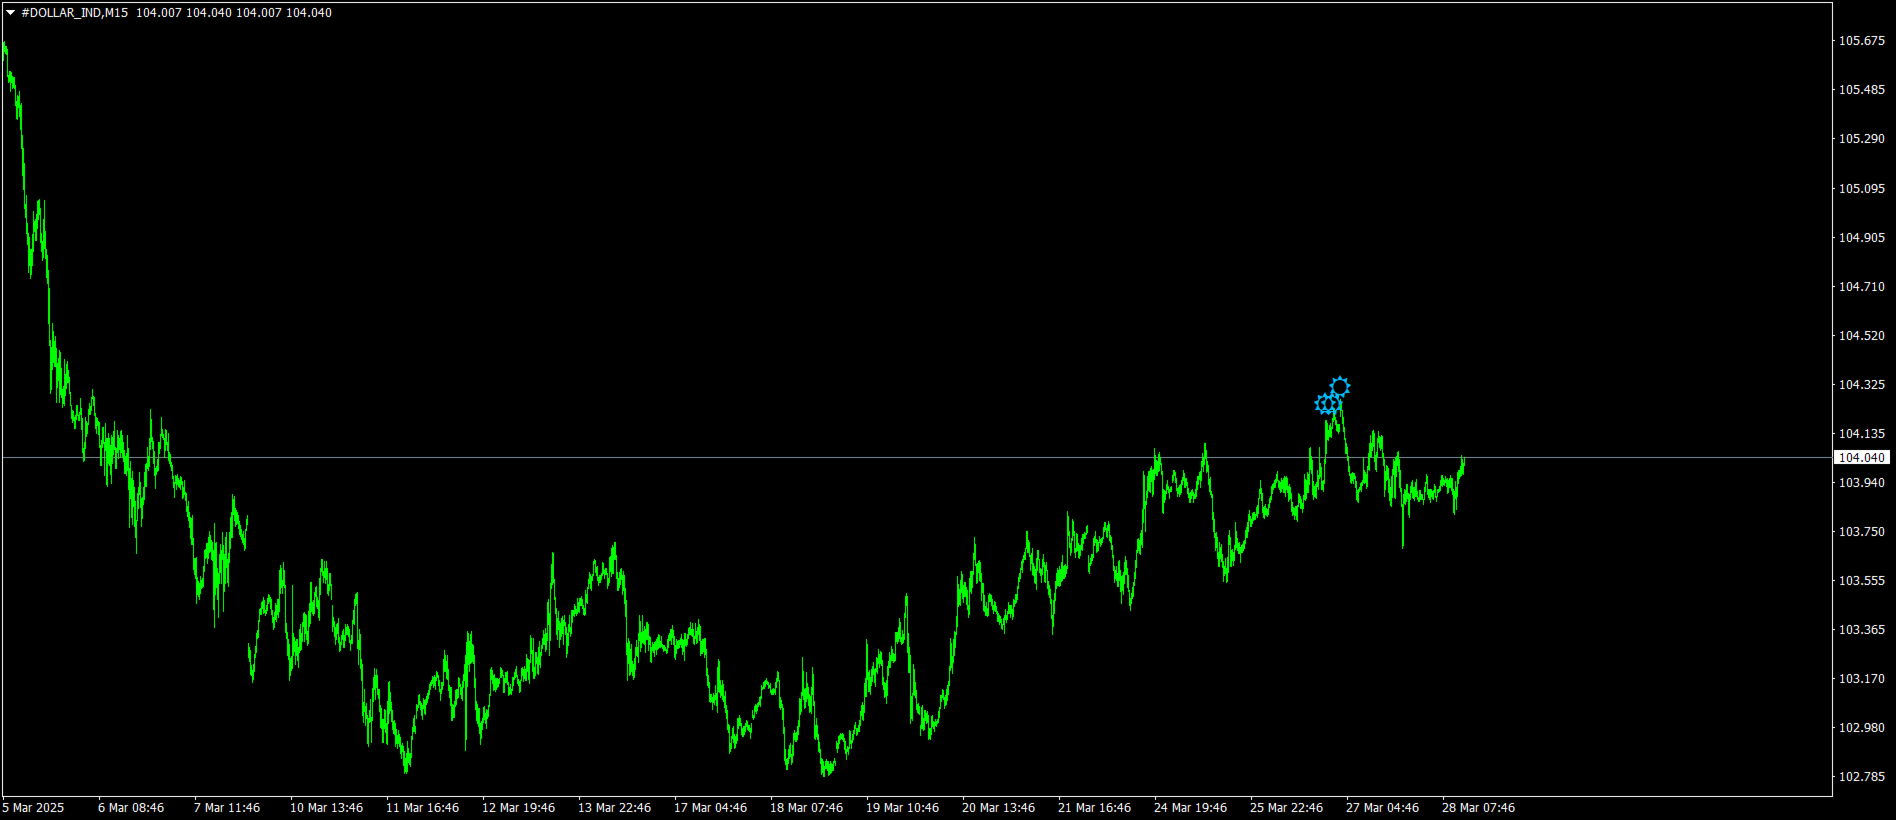
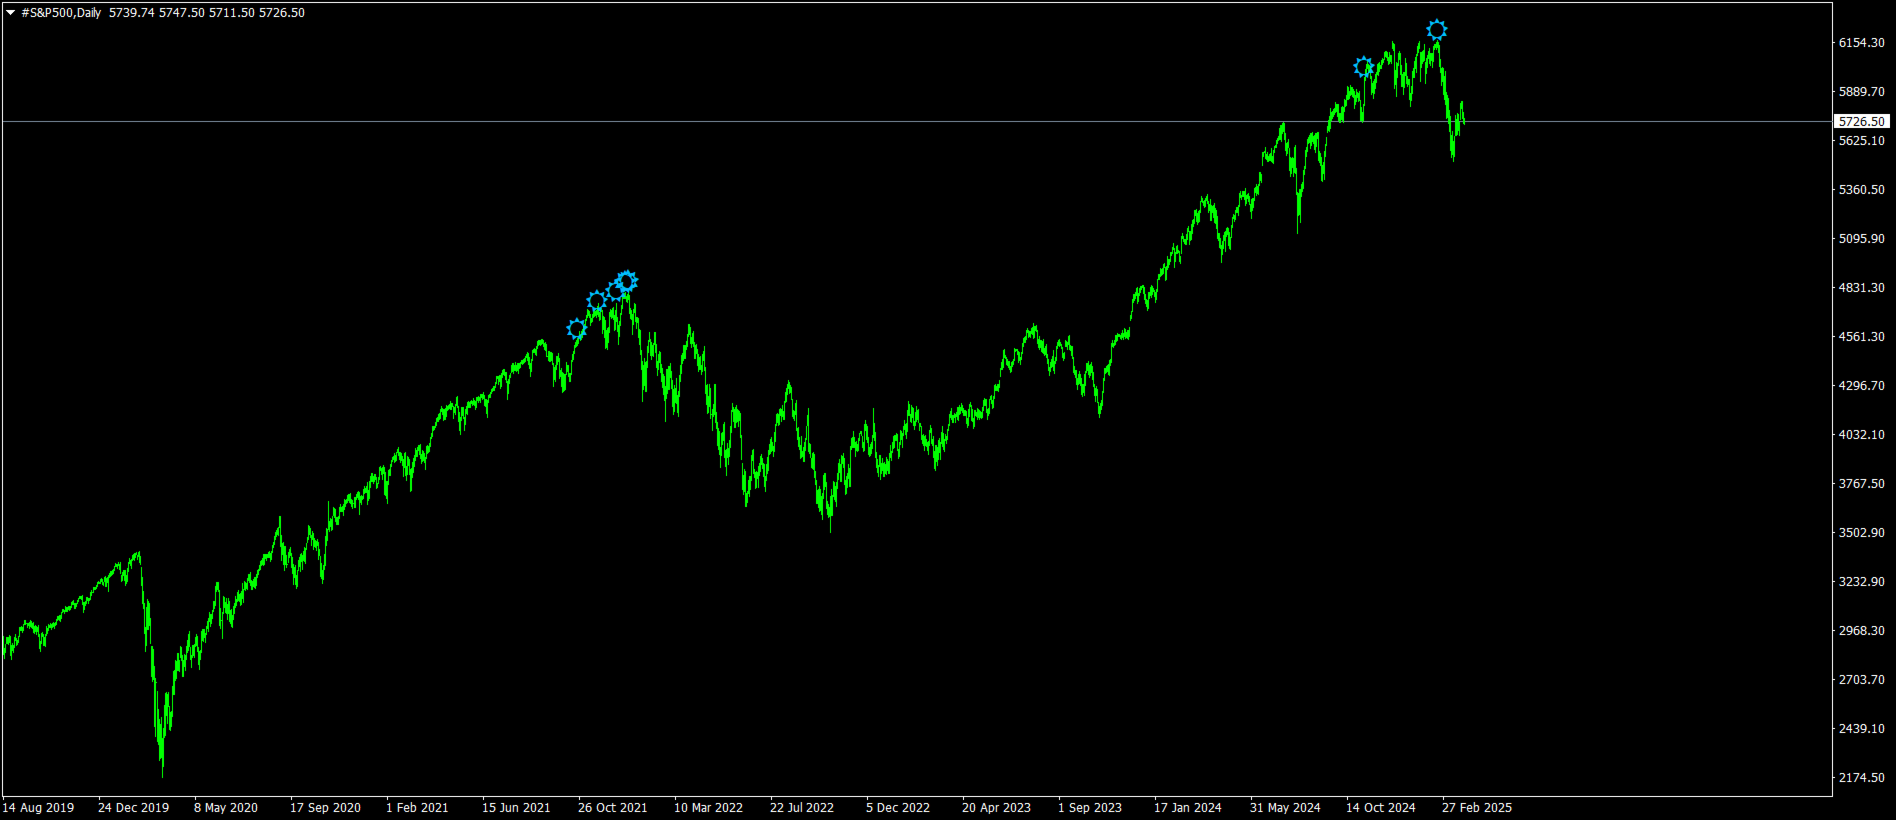
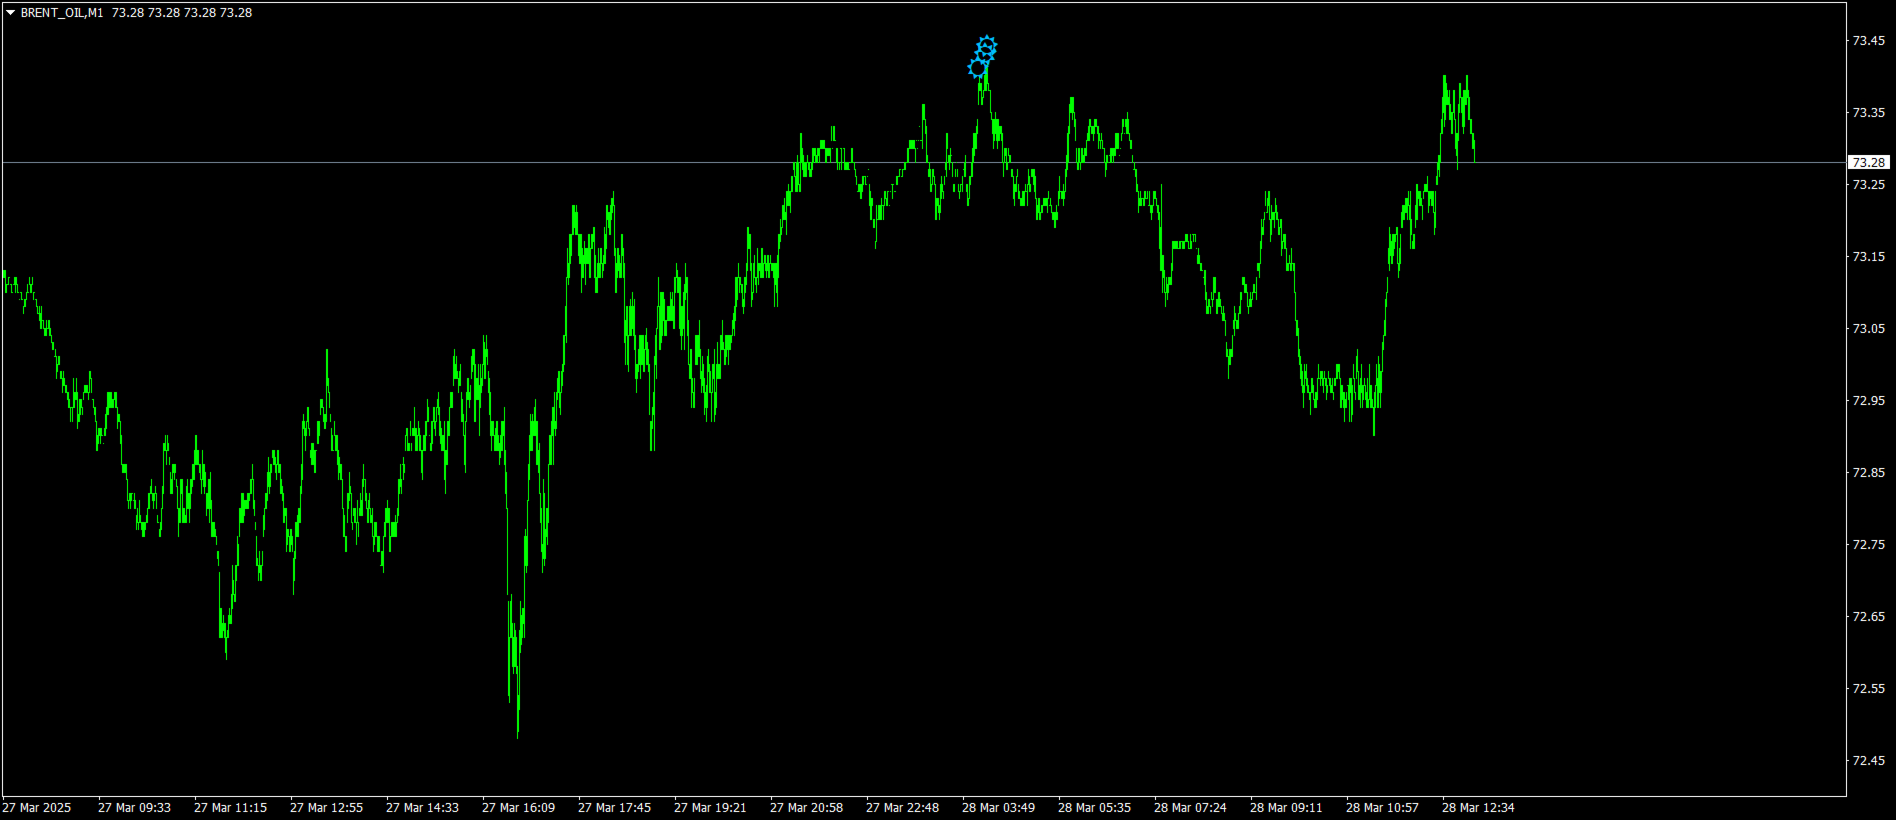
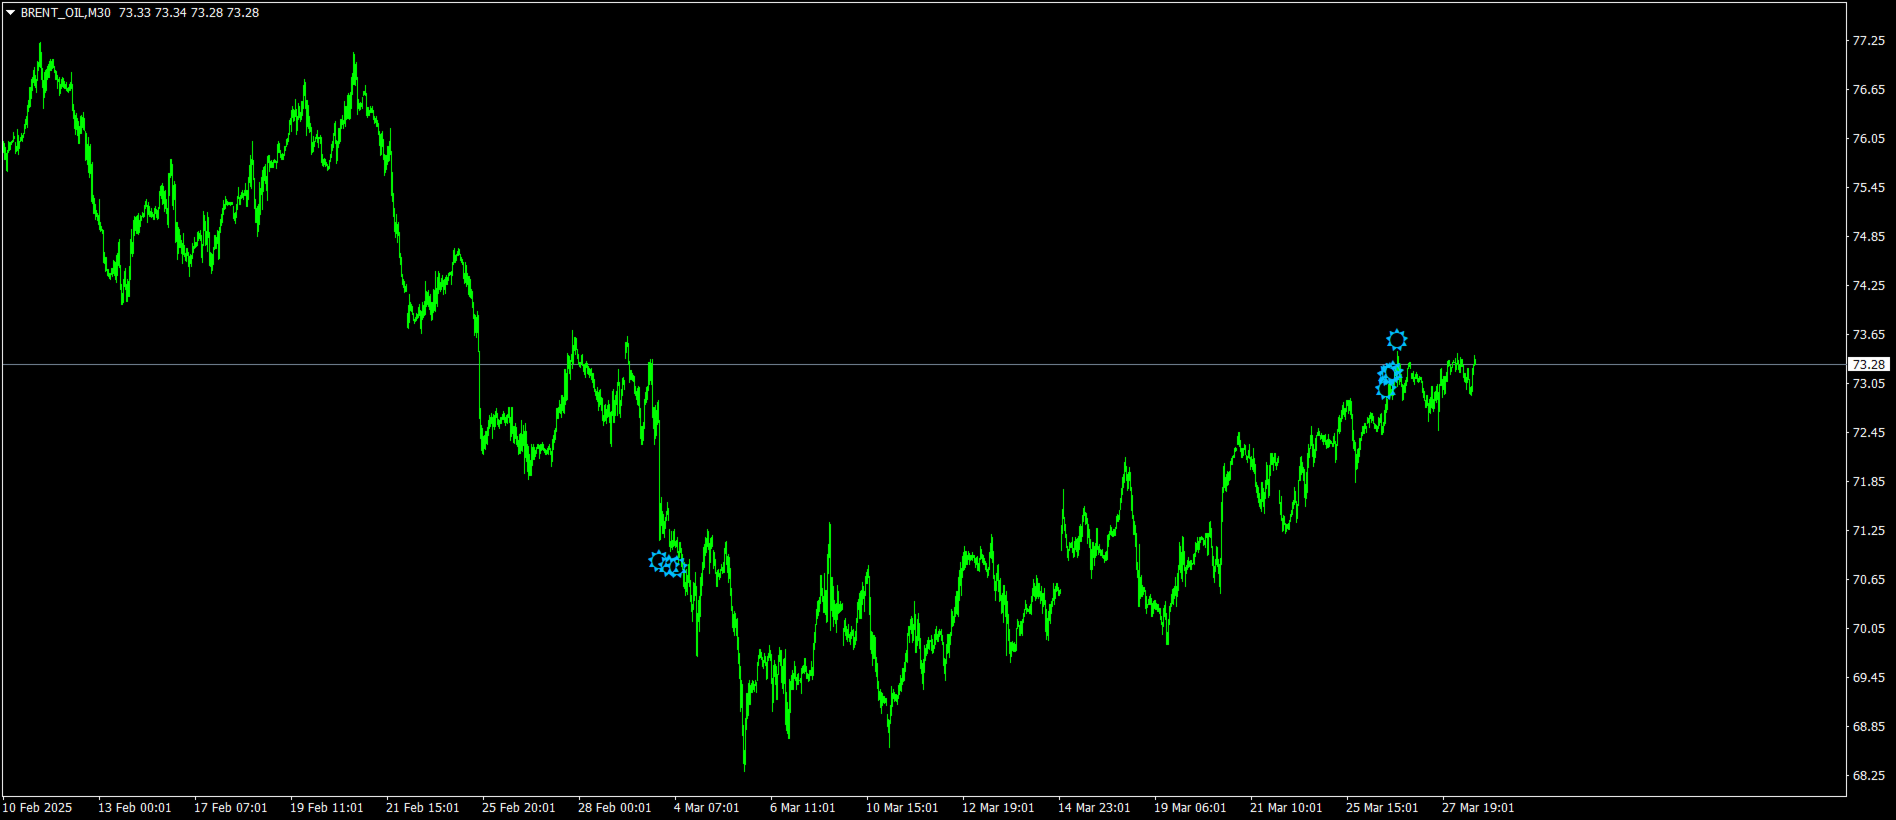
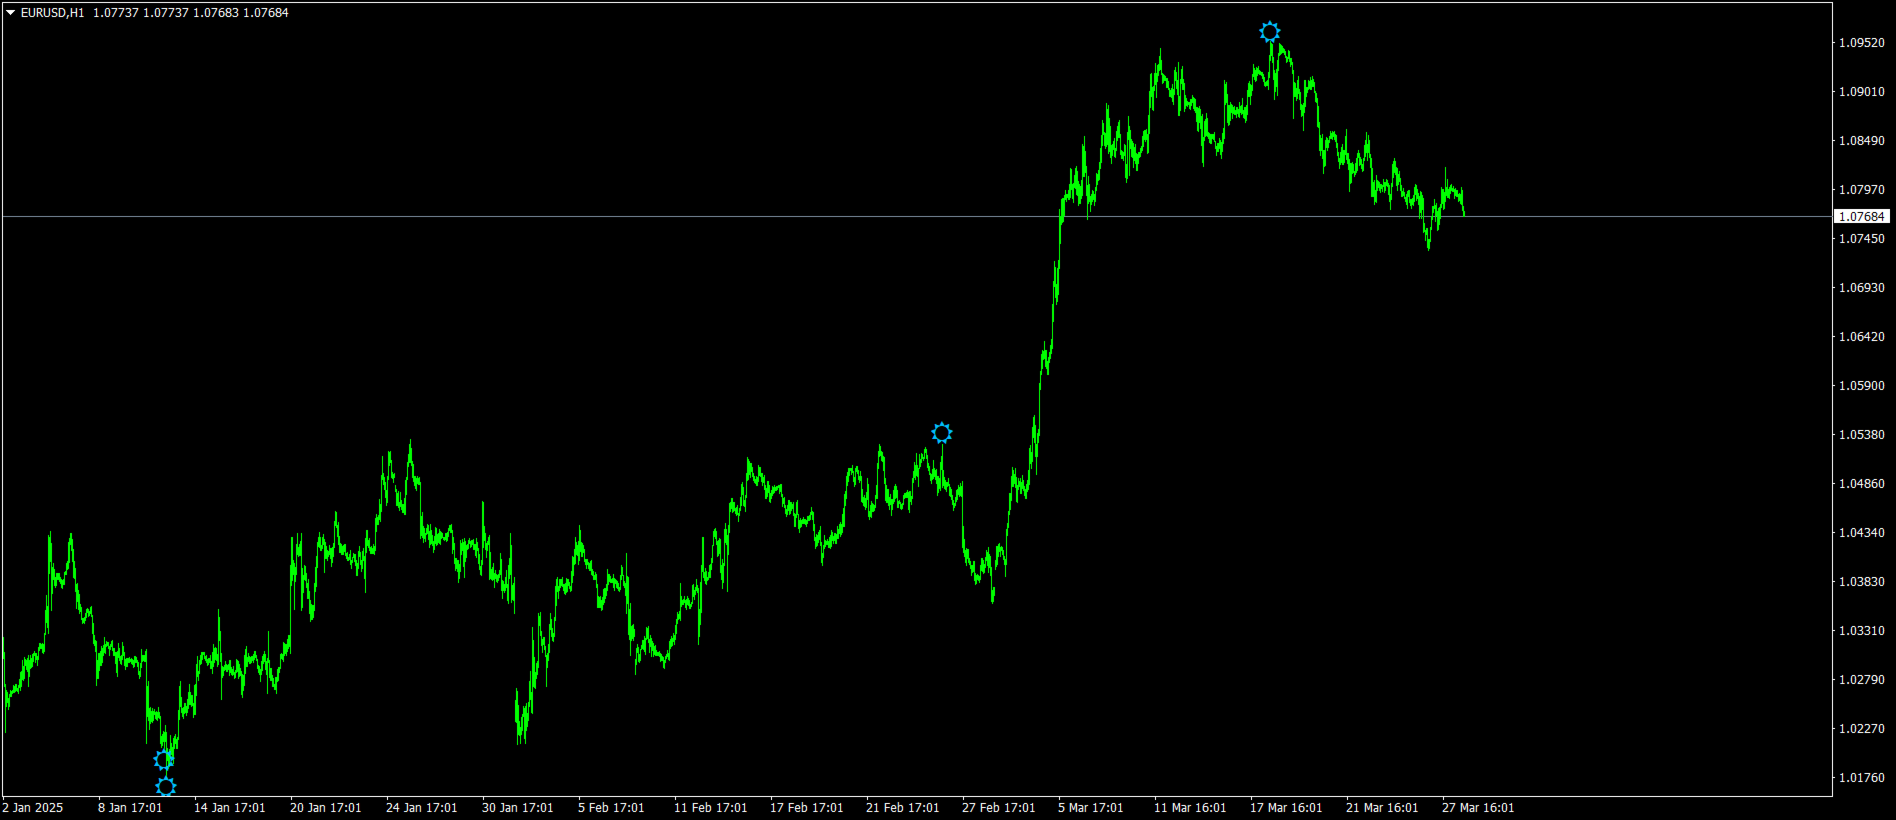
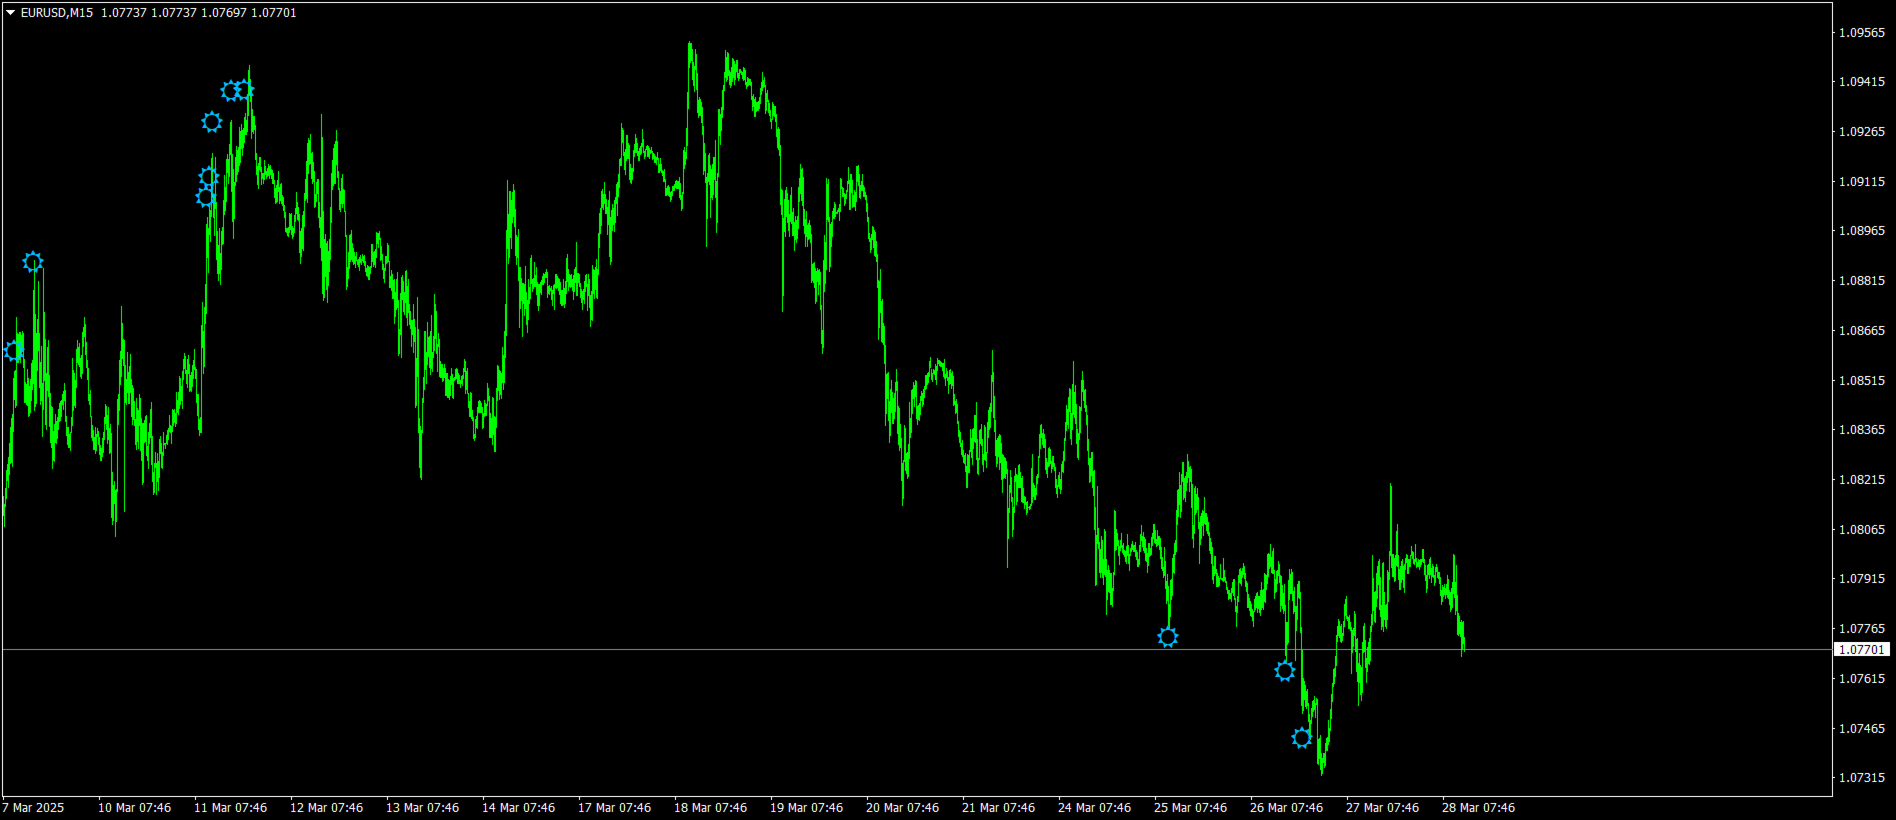
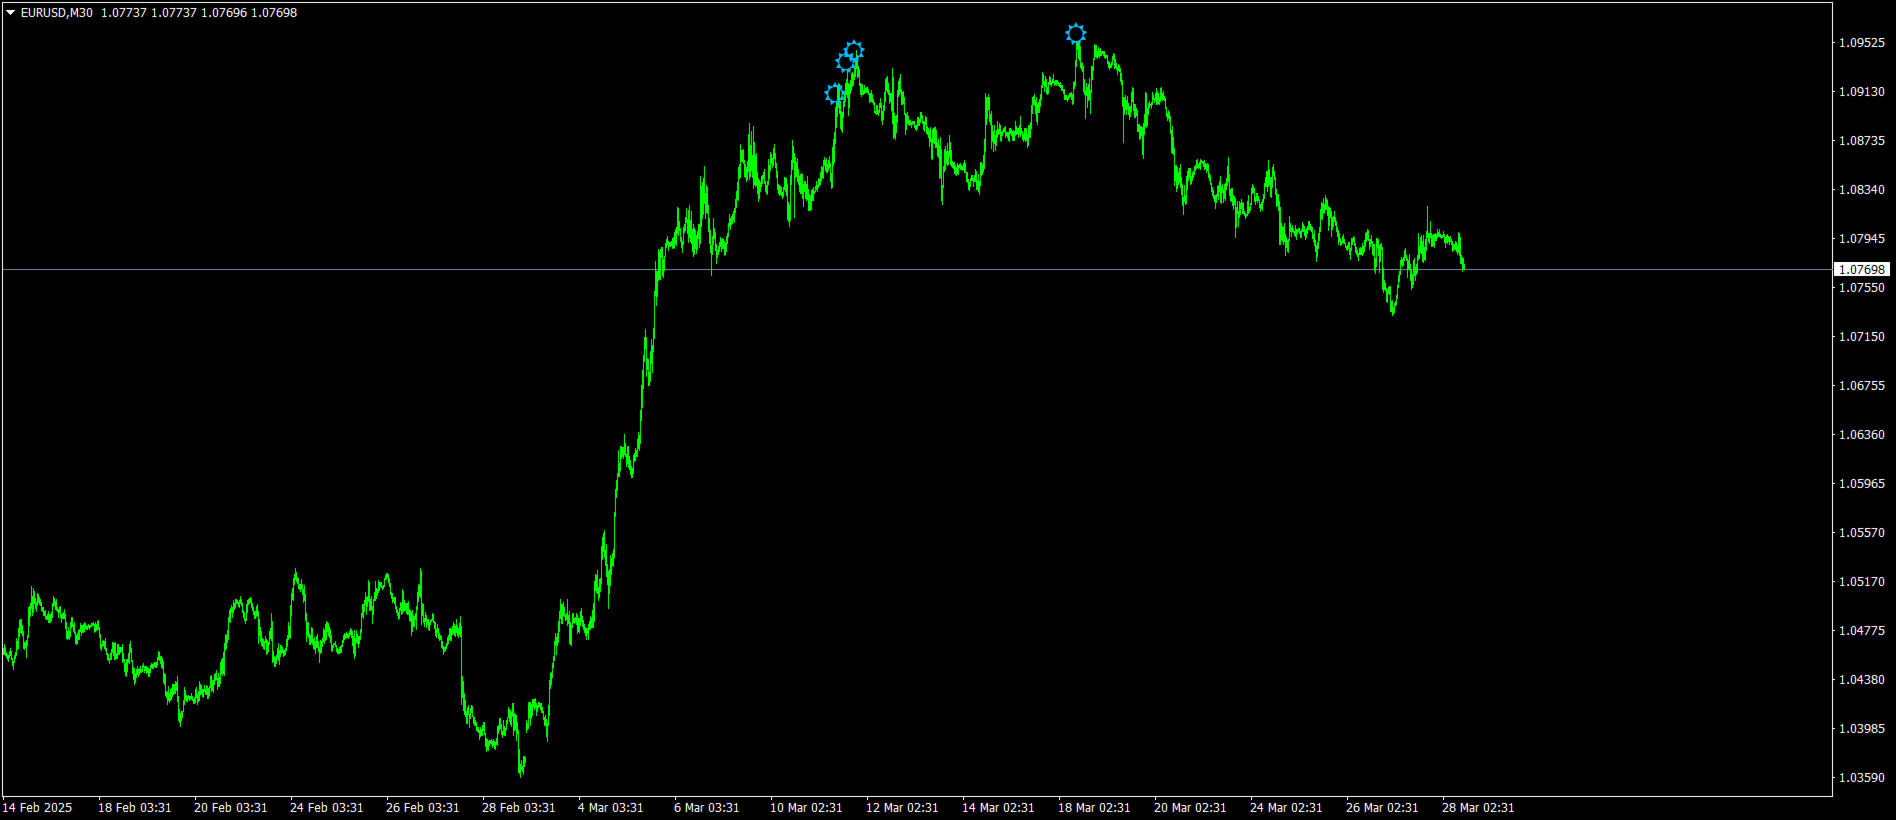
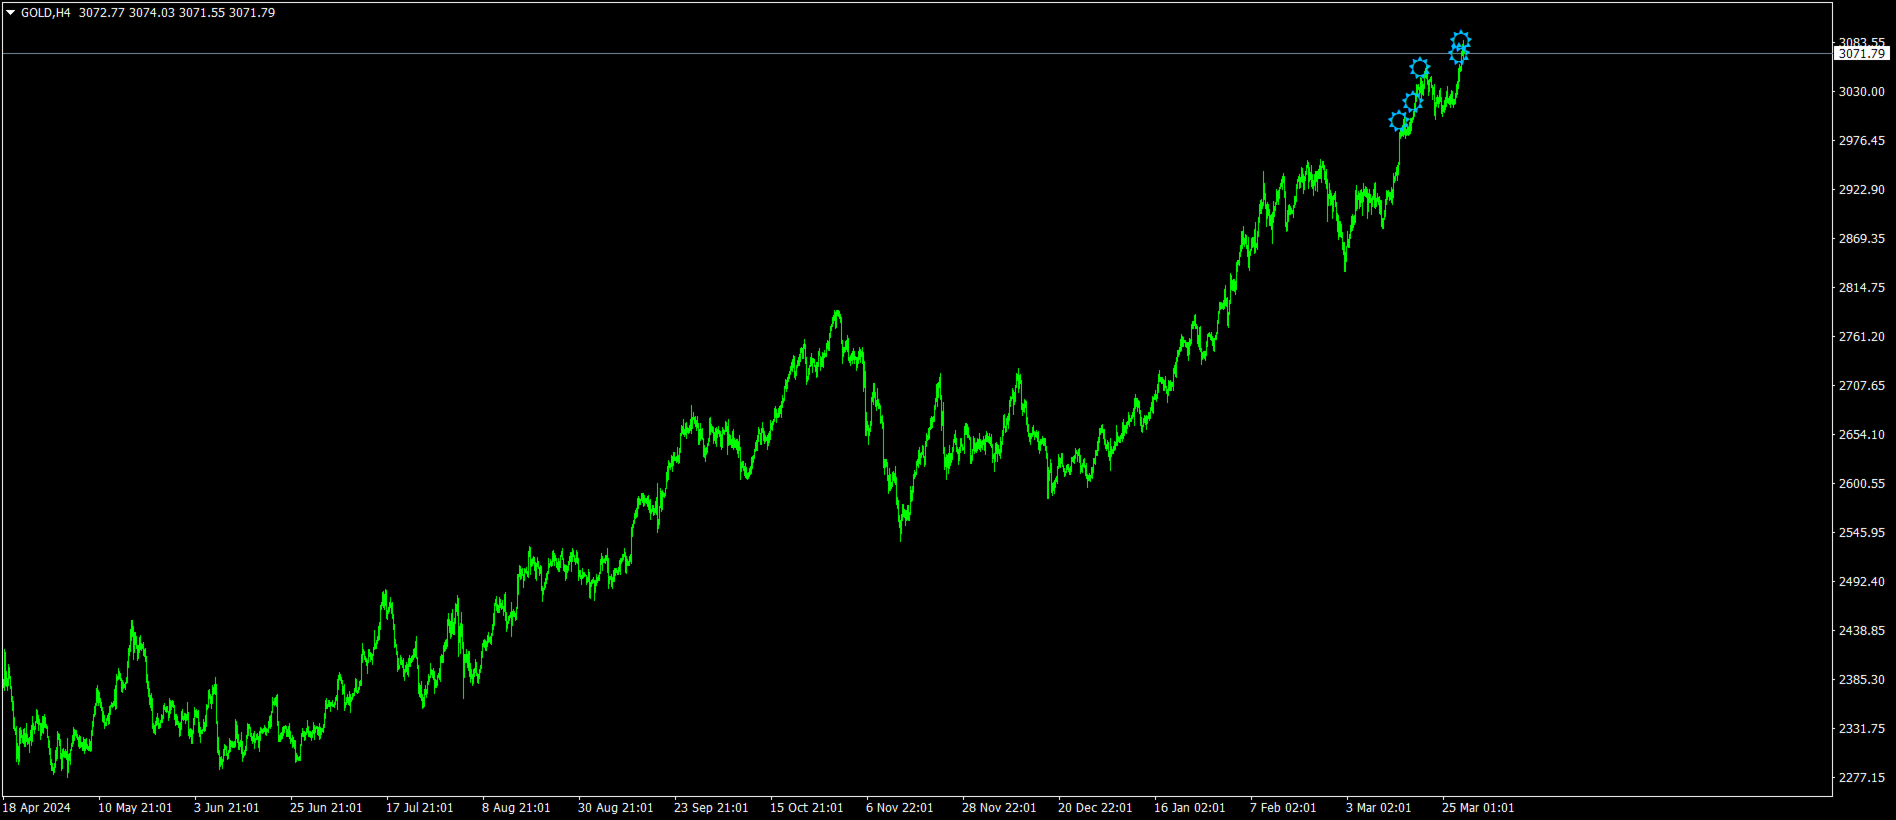
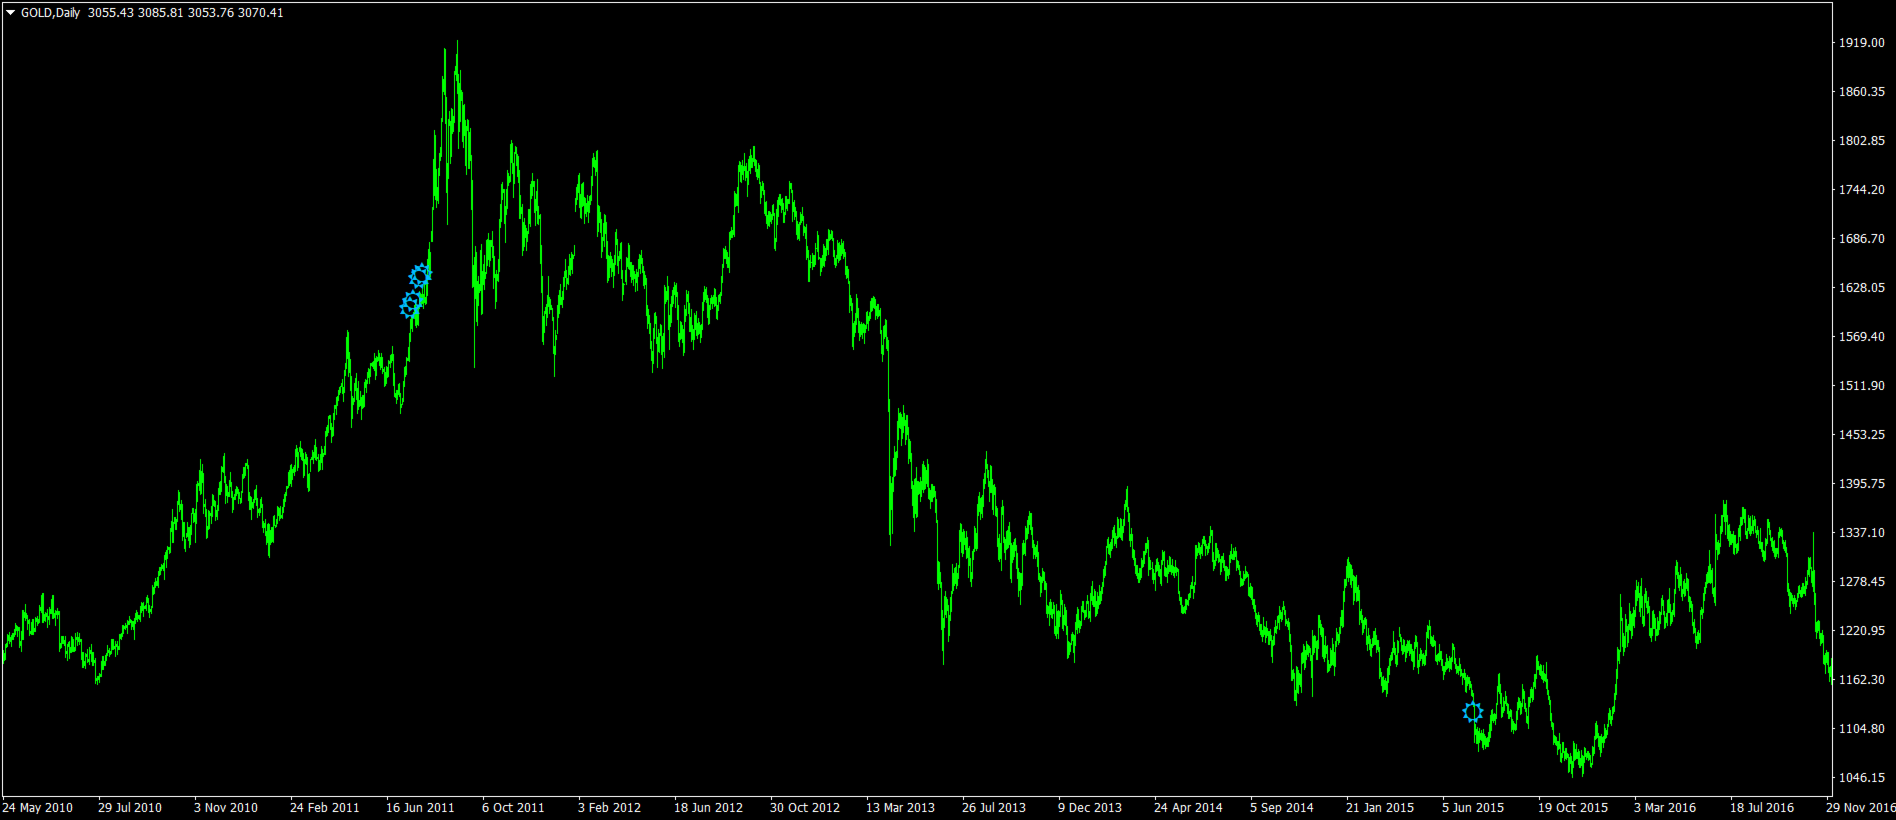
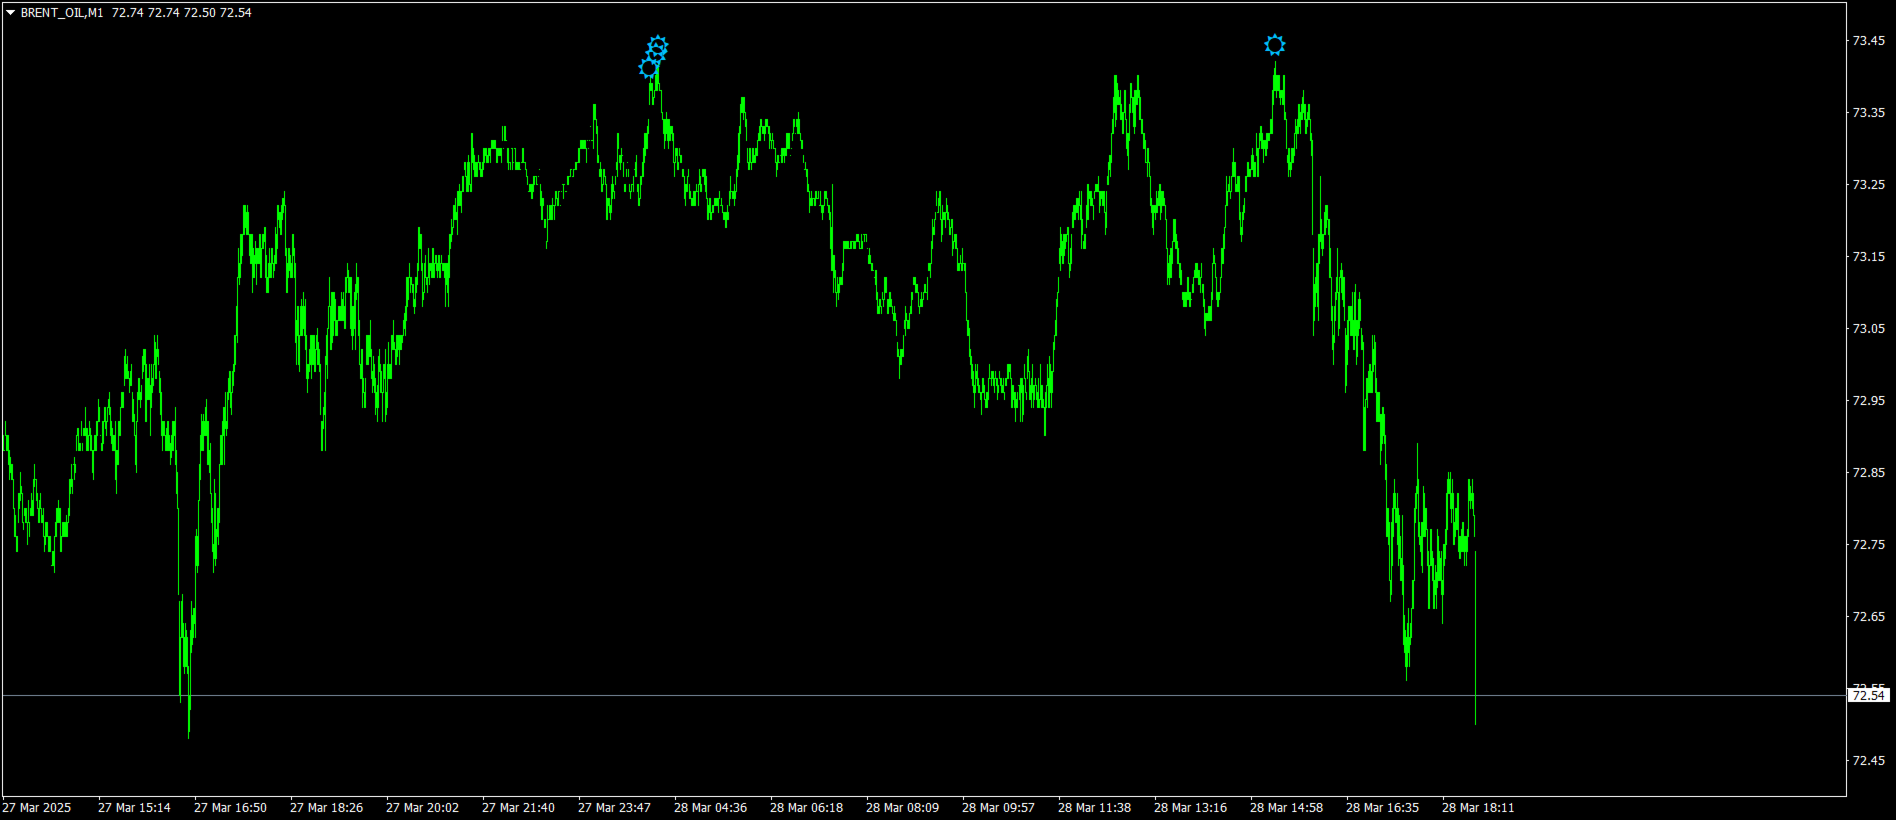
Star arrows indicator is no repaint arrow sindicator.

it is sutable for experienced trader and beginners.

it work all timeframe and all pairs.

easy to to use.gives star arrows top and bottoms.

if arrow up the price that is sell signals.

if arrows below prices it is buy signal.

cnt is bars back number and settled default 1000.

it can be raised acording to charts bar numbers.

おすすめのプロダクト
This indicator examines the relative strengths of the currencies of 8 different countries and displays the one that has the potential to gain profit in the short term as a suggestion. The relative strength of each country's currency over the selected time period is shown on the graph as a percentage. The recommended currency according to BuyLevel and SellLevel determined by the user is shown in the bottom right section. The indicator also automatically brings up the 30-minute graph of the sugges
KT Price Border MT4
KEENBASE SOFTWARE SOLUTIONS
KT Price Border は、3本のバンドで構成された価格チャネルを作成し、市場のスイングハイとスイングローの可能性がある領域を特定します。これらのレベルは、動的なサポートおよびレジスタンスとしても使用できます。 中央のバンドは、トレンドの方向を識別するためにも使用できます。そのため、このインジケーターはトレンドフォロー型の指標としても機能します。さらに、使いやすさとシンプルなトレードシグナルにより、初心者トレーダーにとって非常に有益です。 特徴 ほとんどの FX 通貨ペアで優れたパフォーマンスを発揮します。 短時間足と長時間足の両方で使用可能です。 スキャルピング、デイトレード、スイングトレードに適しています。 トレンドフォロー戦略と逆張り戦略の両方に対応しています。 価格がバンドを超えたときにアラートを送信できます。 価格バンドは、動的なサポートおよびレジスタンスレベルとして機能します。  価格境界の概念を理解する このインジケーターは、ボリンジャーバンドと同様に機能します。下部バンドは、市場の売られ過ぎ状態を示し、動的なサポートとして機能します。 上部バンドは、市場の
You can identify the strength of the main forex currencies with this tool. You can combine it with different styles and get the best strategy out of it. It has very high power. It can be customized. MT5 version This indicator will have many updates and special settings will be added to it. You can contact us via Instagram, Telegram, WhatsApp, email or here. We are ready to answer you.
DTFX Algo Zones are auto-generated Fibonacci Retracements based on market structure shifts. These retracement levels are intended to be used as support and resistance levels to look for price to bounce off of to confirm direction.   USAGE Figure 1 Due to the retracement levels only being generated from identified market structure shifts, the retracements are confined to only draw from areas considered more important due to the technical Break of Structure (BOS) or Change of Character (CHo
The Hill
Pieter Gerhardus Van Zyl
The indicator is a histogram for scalping the lower timeframes  When the hill behind appears go short and when it disappears go long  The indicator has only sound alerts  The colors can be adjusted as preferred  Suitable for lower timeframes - 1 - 5 minutes Test in demo before purchase Enjoy -----------------------------------------------------------------------
The Strong Volume Trend  MT4 indicator is a powerful tool designed to help traders identify and capitalize on significant volume trends in the financial markets. With its advanced algorithm, this indicator accurately detects the strength and direction of volume movements, allowing traders to make informed trading decisions. Features: Volume Strength Analysis: The indicator analyzes the volume data and identifies strong volume trends, helping traders spot potential market reversals, breakouts, or
Introducing the Accumulated RSI,  your ultimate tool for precise trend identification and momentum analysis in the world of Forex and financial markets. This cutting-edge MetaTrader 4 (MT4) indicator, designed for traders seeking unparalleled insight and accuracy, empowers you to make well-informed trading decisions like never before. Features Accurate Trend Detection: The Accumulated RSI utilizes the Relative Strength Index (RSI) in an innovative way to pinpoint the prevailing market trends wit
Standart MACD indicator but All parameters can be changed for users. Extern Inputs: FastMA method : Simple, Exponential, Smoothed and Linear Weighted FastMA Price     : Close, Open, Low, High, Median, Typical and Weighted  FastMA count    : Default is 12 SlowMA Method : Simple, Exponential, Smoothed and Linear Weighted SlowMA Price    : Close, Open, Low, High, Median, Typical and Weighted  SlowMA Count   : Default is 26 Draw Mode        : Line or Histogram SignalMA Method : Simple, Exponential,
This indicator works on MT4 and is very easy to use. When you receive a signal from it, you wait for that candle with the signal to close and you enter your trade at the beginning of the next new candle . A red arrow means sell and a green arrow means buy. All arrows comes with Alert  like for easy identification of trade signal. Are you okay with that? 1 minute candle 1 minute expire
The indicator scans for stop grabber (special pattern of Joe Dinapoli which gives very high probability buy / sell signals and does not repaint ) signals in multiple timeframes for the all markets filtered and shows the results on Dashboard. Key Features Dashboard can be used for all markets It can scan for stop grabber pattern on MN1, W1, D1, H4, H1, M30, M15 ,M5, M1 timeframes Parameters UseMarketWatch: Set true to copy all symbols available in market watch MarketWatchCount : Set the number
This indicator analyzes the most important levels  of different timeframes and shows you the best of them on the chart and these levels are obtained with fractal (bill williams) approval  You can use this indicator to determine the most important levels for yourself and trade with ease. You no longer need to spend hours checking different levels because the indicator will do it for you in the best possible way and will save you time. The surfaces that are extracted for you have the highest possi
Introduction This indicator alerts you when certain price levels are reached. The alert can be on an intrabar basis or on a closing price basis. It will also send alerts when one forms, including via e-mail or push notification to your phone . It's ideal for when you want to be notified of a price level being reached but don't want to have to sit in front of your chart all day. Input Parameters DoAlert: if set to true a desktop pop-up alert will appear from your MetaTrader terminal when the
このテクニカル指標は、チャート上のさまざまな 反転ローソク足パターン を使用して、価格変動を自動的に識別および分析します。対応するパターン名とともに矢印記号を描画するので、最新の反転ローソク足パターンを簡単に見つけることができます。このインジケーターを使用すると、チャート分析を迅速に特定し、以前に特定されたローソク足パターンと比較できます。 このインジケーターには、トンボ童子、墓石童子、ハンマー、ピンバーなど、単純なものから複雑なものまで、実装されたさまざまなローソク足パターンが含まれています。これらのパターンは、一般的な傾向と履歴データに基づいてフィルター処理され、信頼性の高いシグナルが保証されます。このインジケーターは、矢印を描画し、チャート上にパターン名を表示することで、特定されたパターンを視覚的に表します。さらに、視覚エクスペリエンスを向上させるために、すべてのオブジェクトの矢印の種類と色を柔軟にカスタマイズできます。 パターン識別機能に加えて、インジケーターはカスタマイズ用のさまざまなパラメーターを提供します。買いシグナルと売りシグナルの色を設定したり、矢印サインの特定の文字
軍用犬s-軍を識別するスタート地点としてのインド処理します。 彼はすべてのペリドスのために働く。 戦略をダブルクリックすると、設定からADRレベルを開くことができます。 あなたはADR機能をオフにした場合、それはより多くの取引を見つけるでしょう。  特に、独自の戦略に加えて、それはあなたがより良い品質のフィルタを介して処理入力を渡すことができます。 あなたは、ADRレベルは、特定の毎日のボリュームを平均化し、ポイント数がこれらのレベルに近づいたときに取引を通知したいですか? 私たちは50ポイントに設定し、一般的な設定ではADRを制御しました。  オンにするには、strategy1ADR制御設定をtrueに設定する必要があります。 実験を指標に設定します。 指paritatesは、それが異なるすべての期間についてです。 そのような割引の助けは、あなたが勝つための補完的な効果をもたらすでしょう。
The Trend Bomer indicator can be used alone or as an addition to your strategy. Does not repaint and causes no delay. Customizable SL and TP setting. It provides alerts as well as signals and when an alert is received orders are placed after waiting for the candle to close. The red arrow indicates the sell signal and the blue arrow indicates the buy signal. It can be optimized for all currencies, commodities or cryptocurrencies. You can change and optimize the settings using the "indicatorPeriod
In the context of trading,   Malaysia SNR   (Support and Resistance) refers to the technical analysis of   support and resistance levels   in financial markets, particularly for stocks, indices, or other assets traded. There are three type of Malaysia SNR level Classic , GAP and Flipped 1. Classic Support   is the price level at which an asset tends to stop falling and may start to rebound. It acts as a "floor" where demand is strong enough to prevent the price from dropping further. Resistance
Trend Chase is an indicator that generates trade arrows. It generates trade arrows with its own algorithm. These arrows give buying and selling signals. The indicator certainly does not repaint. The point at which the signal is given does not change. You can use it in all graphics. You can use it in all pairs. This indicator shows the input and output signals as arrows and alert. When sl_tp is set to true, the indicator will send you the close long and close short warnings. It tells you that you
The Candlestick Signal indicator generates signals using a set of indicators and a set of candle patterns. It allows you to operate with these signals. Features Works on any currency pairs. It works in all periods. Sensitivity setting. You can set the signal frequency. Use recommended standard settings. ‌The greatest feature of this display is the possibility of manual martingale.  The signal intensity region tends to go in the direction of the signal. Works on all charts. Any broker. It is advi
The indicator monitors the Dinapoli MACD trend in multiple timeframes for the all markets filtered and shows the results on Dashboard. Key Features Indicator can be used for all markets Monitors every timeframe, from 1 Min to Monthly Parameters UseMarketWatch: Set true to copy all symbols available in market watch MarketWatchCount : Set the number of symbols that you want to copy from the market watch list. CustomSymbols: Enter the custom symbols that you want to be available in dashboard. Ti
Scanner and Dashboard for Money Flow Index for MT4 The Money Flow Index (MFI) is a technical oscillator that uses price and volume data for identifying overbought or oversold signals in an asset. It can also be used to spot divergences which warn of a trend change in price. The oscillator moves between 0 and 100. Advantages of the Scanner: - Full Alert Options. - Multi Timefrare  - Works for all instruments including Currencies, Indices, Commodities, Cryptocurrencies and Stocks. - Fully customis
Pro Magic Signal   indicator is designed for signal trading. This indicator generates trend signals.  It uses many algorithms and indicators to generate this signal. It tries to generate a signal from the points with the highest trend potential. This indicator is a complete trading product. This indicator does not need any additional indicators.  The indicator certainly does not repaint. The point at which the signal is given does not change.  Thanks to the alert features you can get the signals
Enhance your trading strategies with the " MA Trend Filter " indicator for MetaTrader 4. This powerful tool is designed to help you make more informed trading decisions by effectively filtering market trends using Moving Averages (MA). Key Features: Efficient Trend Filtering: The "MA Trend Filter" uses Moving Averages to filter out noise and highlight significant market trends. It simplifies complex price data, making it easier to identify potential entry and exit points. Customizable Settings:
A arca v1
Wellington Macedo Da Paixao
商品名 A arca 主な機能 重要ゾーンの自動検出 A arcaはサポートラインとレジスタンスラインを自動的に検出・表示し、エントリーやエグジットのポイントを把握しやすくします。 明確な売買シグナル 買い・売りのマーカーを表示し、ポジションを開始・終了する最適なタイミングをトレーダーが判断しやすくします。 マルチタイムフレーム分析 M5、M15、H1など複数の時間足データを統合して解析でき、より正確な相場分析を可能にします。 カスタマイズ可能で直感的なインターフェース 色やライン、レベルなどを自分の好みや戦略に合わせて設定することができ、自身のトレードスタイルに合った環境を整えます。 リスク管理ツール 反転が起こりやすいゾーンを特定することで、ストップロスやテイクプロフィットを簡単に設定でき、リスク管理を効率化します。 利点 迅速かつ正確な意思決定 重要ゾーンを自動的に検出するため、煩雑な手動分析に頼る必要が減り、よりスピーディーな意思決定が可能となります。 時間と労力の節約 明確なビジュアルシグナルにより、戦略やリスクコントロールに集中でき、複雑なチャート分析に時間を
HC candlestick pattern is a simple and convenient indicator able to define candle patterns.‌ Candlestick charts are a type of financial chart for tracking the movement of securities. They have their origins in the centuries-old Japanese rice trade and have made their way into modern day price charting. Some investors find them more visually appealing than the standard bar charts and the price action is easier to interpret. Hc candlestick pattern is a special indicator designed to find divergence
BinaryGrail
Justine Kelechi Ekweh
Great For Binary options. Works on all timeframes. Recommended for M5 timeframe. one candle expiry. Experienced traders can explore. Strategy is based on price action and multi timeframe analysis. Recommended During high volatility sessions, like the London and new York sessions. For the M1(One minute) timeframe, Traders can use four or five candle expiry, this means it can be applied for 4, 5 or more  minutes expiry. For forex traders, I tested the indicator with the JesVersal universal EA:   
Представляю вам индюка скальпера, а также хорошо отрабатывает на бинарных опционах, дополнительно добавлена функция уведомления, где своевременно вы сможете открыть ордера в любом месте, главное чтоб был интернет, но, чтобы данная функция  работала установите индюка на желаемые котировки и все это на сервер VPN. В данном индикаторе для дополнительной фильтрации сигнала используется индикатор RSI, период можно изменить в настройках, для поиска входов в открытие сделки,  установите индикатор на та
Pro Trade Signal Arrows is an indicator that generates trade arrows. It generates trade arrows with its own algorithm. Bu oklar alış ve satış sinyalleri verir. Gösterge kesinlikle yeniden boyanmıyor. Sinyalin verildiği nokta değişmez. Tüm grafiklerde kullanabilirsiniz. Tüm çiftlerde kullanabilirsiniz. Bu gösterge, giriş ve çıkış sinyallerini oklar ve uyarı olarak gösterir. When sl_tp is set to true, the indicator will send you the close long and close short warnings It tells you that you should
The Signal SASON indicator is designed to generate trading signals. It works to find potential trade entry points. The signals are found by analyzing a series of candlestick movements and a set of algorithms. This indicator calculates the reversal points of the pair you are using. It does not have deceptive properties like re-painting. Rules and Features When a signal arrives, it is recommended to use take profit and stop loss level. Use timeframe M15 and up. It works on all currency pairs, exc
Bonsosu P is Binary indicator for binary option trade highly winrate and highly return ........... Design for full auto trade with bot or connetor from MT4 to Binary Broker ...____ Easy to use, No repaint,,, ___  Time frame M1 only, ..... ___  Work with 28 forex pair without martingale, ....__  Support all binary broker, ....__ Trading with experation ..... __
KT Candlestick Patterns Scanner is a Multi-Symbol and Multi-Timeframe scanner that fetches and shows various candlestick patterns on 28 currency pairs and 9 time-frames concurrently . The scanner finds the candlestick patterns by loading the KT Candlestick Patterns indicator as a resource in the background. Features The scanner can find the candlestick patterns on 252* combinations of symbols and time-frames from a single chart. Open the signal's chart loaded with a predefined template with a s
このプロダクトを購入した人は以下も購入しています
Gann Made Easy は、ミスター・ギャンの理論を使用した取引の最良の原則に基づいた、プロフェッショナルで使いやすい外国為替取引システムです。 W・D・ガン。このインジケーターは、ストップロスとテイクプロフィットレベルを含む正確な買いと売りのシグナルを提供します。 PUSH通知を利用して外出先でも取引可能です。 購入後はご連絡ください!私の取引のヒントと素晴らしいボーナスインジケーターを無料で共有します! おそらく、ギャンの取引手法についてはすでに何度も聞いたことがあるでしょう。通常、ギャンの理論は初心者のトレーダーだけでなく、すでにある程度の取引経験がある人にとっても非常に複雑なものです。なぜなら、ギャンの取引手法は理論的にはそれほど簡単に適用できるものではないからです。私はその知識を磨き、最良の原則を私の外国為替インジケーターに組み込むために数年を費やしました。 このインジケーターは非常に簡単に適用できます。必要なのは、それをチャートに添付し、簡単な取引推奨事項に従うだけです。このインジケーターは常に市場分析の仕事を行い、取引の機会を探します。適切なエントリーポイントを検出
NOTE: CYCLEMAESTRO is distributed only on this website, there are no other distributors. Demo version is for reference only and is not supported. Full versione is perfectly functional and it is supported CYCLEMAESTRO , the first and only indicator of Cyclic Analysis, useful for giving signals of TRADING, BUY, SELL, STOP LOSS, ADDING. Created on the logic of Serghei Istrati and programmed by Stefano Frisetti ; CYCLEMAESTRO is not an indicator like the others, the challenge was to interpret only t
現在20%OFF! 初心者やエキスパートトレーダーのためのベストソリューション! このダッシュボードソフトウェアは、28の通貨ペアで動作しています。それは私達の主要な指標(高度な通貨の強さ28と高度な通貨インパルス)の2に基づいています。それは全体の外国為替市場の大きい概観を与えます。それは、すべての(9)時間枠で28の外国為替ペアのための高度な通貨の強さの値、通貨の動きの速度と信号を示しています。チャート上で1つのインディケータを使用して市場全体を観察し、トレンドやスキャルピングの機会をピンポイントで見つけることができたら、あなたのトレードがどのように改善されるか想像してみてください。 このインディケータには、強い通貨と弱い通貨の識別、潜在的な取引の識別と確認がより簡単になるような機能が搭載されています。このインディケータは、通貨の強さや弱さが増加しているか減少しているか、また、すべての時間枠でどのように機能しているかをグラフィカルに表示します。 新機能として、現在の市場環境の変化に適応するダイナミックなマーケットフィボナッチレベルが追加され、すでに当社のAdvanced
!SPECIAL SALE! An exclusive indicator that utilizes an innovative algorithm to swiftly and accurately determine the market trend. The indicator automatically calculates opening, closing, and profit levels, providing detailed trading statistics. With these features, you can choose the most appropriate trading instrument for the current market conditions. Additionally, you can easily integrate your own arrow indicators into Scalper Inside Pro to quickly evaluate their statistics and profitability
Gold Stuff
Vasiliy Strukov
4.86 (257)
Gold Stuff は、金専用に設計されたトレンド指標であり、あらゆる金融商品にも使用できます。 インジケーターは再描画せず、遅れません。 推奨時間枠 H1. それインディケータでフルオートExpert Advisor EA Gold Stuffが動作します。 あなたは私のプロフィールでそれを見つけることができます. 設定と個人的なボーナスを得るために、購入後すぐに私に連絡してください! トレンド スキャナーの強力なサポートを利用して、無料のインジケーターを入手し、プライバシーを守ります。あーみー!   設定 矢印を描く - オンオフ。 チャートに矢印を描く。 アラート - 可聴アラートのオンオフ。 メール通知 - オンオフ。 電子メール通知。 プチ通知 - オンオフ。 プッシュ通知。 次に、色域を調整します。 Gold Stuff は、金専用に設計されたトレンド指標であり、あらゆる金融商品にも使用できます。 インジケーターは再描画せず、遅れません。 推奨時間枠 H1. それインディケータでフルオートExpert Advisor EA Gold Stuffが動作します。
PUMPING STATION – あなた専用の「オールインワン」戦略 PUMPING STATIONは、あなたのトレードをより楽しく、そして効果的に変えてくれる革新的なFXインジケーターです。ただの補助ツールではなく、強力なアルゴリズムを備えた本格的なトレーディングシステムで、より安定したトレードのスタートをサポートします。 この商品をご購入いただくと、以下の特典を無料でお付けします: 専用セットファイル:自動設定による最大パフォーマンスを実現。 ステップバイステップのビデオマニュアル:PUMPING STATION戦略の使い方を学べます。 Pumping Utility:PUMPING STATION専用の半自動トレードボットで、より快適かつシンプルな運用を可能にします。 ※ご購入後すぐにご連絡ください。追加リソースへのアクセスを提供いたします。 PUMPING STATIONの仕組み: トレンド管理:市場のトレンド方向を即座に判断。トレンドはあなたの最高の味方です。 エントリーサイン:チャート上の矢印で、取引のタイミングと方向を明確に示します。 明確な目標設定:インジケーターが自
Golden Trend Indicator
Noha Mohamed Fathy Younes Badr
5 (10)
Golden Trend indicator  is The best indicator for predicting trend movement this indicator never lags and never repaints and never back paints    and give  arrow buy and sell    before the candle appear  and it will help you and  will make your trading decisions clearer its work on all currencies and  gold and crypto and all time frame This unique  indicator uses very secret algorithms to catch the  trends, so you can trade using this indicator and see the trend clear on charts  manual guide and
市場の2つの基本原則に基づく日中戦略。 このアルゴリズムは、追加のフィルターを使用したボリュームと価格の波の分析に基づいています。インディケータのインテリジェントアルゴリズムは、2つの市場要因が1つに結合した場合にのみシグナルを出します。インディケータは、より高い時間枠のデータを使用して、M1チャート上の特定の範囲の波を計算します。そして波を確認するために、インジケーターはボリュームによる分析を使用します。 このインディケータはレディトレーディングシステムです。トレーダーが必要とするのは、信号に従うことだけです。また、インジケーターはあなた自身の取引システムの基礎になることができます。取引はミニッツチャートでのみ行われます。 インジケーターがMTFの原則を使用しているという事実にもかかわらず、インジケーターのアルゴリズムは可能な限り安定しています。 購入後、必ず私に書いてください!私の取引設定と推奨事項をあなたと共有します!
Trend Screener
STE S.S.COMPANY
4.78 (93)
トレンドインジケーター、1つのツールに組み込まれたすべての重要なトレンド機能を備えたトレンドトレーディングとフィルタリングのための画期的なユニークなソリューション! これは、すべてのシンボル/商品(外国為替、商品、暗号通貨、インデックス、株式)で使用できる100%再描画されていないマルチタイムフレームおよびマルチ通貨インジケーターです。 期間限定オファー: サポートおよびレジスタンス スクリーナー インジケーターは、たった 50 ドルで永久的にご利用いただけます。(元の価格 250 ドル) (オファー延長) トレンドスクリーナーは、チャート内のドットで矢印トレンドシグナルを提供するインジケーターに続く効率的なインジケーターです。 トレンド分析インジケーターで使用できる機能: 1.トレンドスキャナー。 2.最大利益分析を備えたトレンドライン。 3.トレンド通貨強度メーター。 4.アラート付きのトレンド反転ドット。 5.アラート付きの強いトレンドドット。 6.トレンド矢印 毎日の分析例、毎日のシグナルパフォーマンス...など、トレンドスクリーナーインジケーターを使用して、ここで見つけること
このインディケータは、当社の2つの製品 Advanced Currency IMPULSE with ALERT  +   Currency Strength Exotics . のスーパーコンビネーションです。 このインジケーターは全ての時間枠で作動し、8つの主要通貨と1つのシンボルの強弱のインパルスをグラフで表示します。 このインジケータは、金、エキゾチックペア、商品、インデックス、先物など、あらゆるシンボルの通貨強度の加速度を表示することに特化されています。金、銀、原油、DAX、US30、MXN、TRY、CNHなどの通貨強度の加速度(インパルスまたは速度)を表示するために、任意のシンボルを9行目に追加できる、この種の最初のものです。 新しいアルゴリズムに基づいて構築され、潜在的な取引の特定と確認がさらに容易になりました。これは、通貨の強さや弱さが加速しているかどうかをグラフィカルに表示し、その加速の速度を測定するためです。加速すると物事は明らかに速く進みますが、これはFX市場でも同じです。つまり、反対方向に加速している通貨をペアリングすれば、潜在的に利益を生む取引を特定
Enigmera
Ivan Stefanov
5 (7)
ENIGMERA: 市場の中心 重要:MQL5.comのデモはStrategy Testerで実行されており、Enigmeraの機能を完全には反映していない場合があります。詳細については、説明、スクリーンショット、ビデオをご確認ください。質問があれば、遠慮なくメッセージを送ってください! インジケーターのコードは完全に書き直されました。バージョン3.0は新機能を追加し、インジケーターの開始以来蓄積されたバグを修正しました。 紹介 このインジケーターとトレーディングシステムは、金融市場への注目すべきアプローチです。ENIGMERAはフラクタルサイクルを使用して、サポートとレジスタンスのレベルを正確に計算します。真の蓄積フェーズを示し、方向と目標を提供します。トレンドでも修正でも機能するシステムです。 動作方法 インジケーターのほとんどの機能は、チャートの左側にあるボタンで制御され、市場の状況に迅速に対応できるようになっています。 ボタン ON/OFF – インジケーター全体を表示または非表示にします。 Channel – サポートチャネルを有効にし、許容範囲の偏差を示します。 Dev
これはほぼ間違いなく、MetaTraderプラットフォームで見つけることができる最も完全な調和価格形成自動認識インジケーターです。 19種類のパターンを検出し、フィボナッチプロジェクションをあなたと同じように真剣に受け止め、潜在的逆転ゾーン(PRZ)を表示し、適切なストップロスとテイクプロフィットレベルを見つけます。 [ インストールガイド | 更新ガイド | トラブルシューティング | よくある質問 | すべての製品 ] 19の異なる調和価格形成を検出します プライマリ、派生および補完フィボナッチ投影(PRZ)をプロットします 過去の価格行動を評価し、過去のすべてのパターンを表示します この指標は、独自の品質とパフォーマンスを分析します 適切なストップロスとテイクプロフィットのレベルを表示します ブレイクアウトを使用して適切な取引を通知します すべてのパターン比をグラフにプロットします 電子メール/音声/視覚アラートを実装します スコット・M・カーニーの本に着想を得て、この指標は最も純粋で急を要するトレーダーのニーズを満たすように設計されています。ただし、トレードを容易にする
VERSION MT5        —        ИНСТРУКЦИЯ RUS           —        INSTRUCTIONS  ENG 主な機能: レンダリングなしで正確な入力信号! シグナルが表示された場合、それは関連性を維持します。これは、シグナルを提供してからそれを変更する可能性があり、入金時の資金の損失につながる可能性があるリドローインジケーターとの重要な違いです。より高い確率と精度で市場に参入できるようになりました。矢印が表示された後、ターゲットに達する (利益確定) か反転シグナルが表示されるまで、ローソク足を色付けする機能もあります。 STOP LOSS / TAKE PROFITゾーンの表示 エントリーポイントを検索する際の視覚的な明瞭さを改善するために、市場に参入するための最適なポイントが検索される買い/売りゾーンを最初に表示するモジュールが作成されました。ストップロスレベルを操作するための追加のインテリジェントロジックは、時間の経過とともにそのサイズを縮小するのに役立ち、その結果、取引を開始するとき(move sl)の初期リスクを軽減しま
After your purchase, feel free to contact me for more details on how to receive a bonus indicator called VFI, which pairs perfectly with Easy Breakout for enhanced confluence!   Easy Breakout is a powerful price action trading system built on one of the most popular and widely trusted strategies among traders: the Breakout strategy ! This indicator delivers crystal-clear Buy and Sell signals based on breakouts from key support and resistance zones. Unlike typical breakout indicators, it levera
Dynamic Forex28 Navigator - 次世代の Forex 取引ツール。 現在 49% オフ。 Dynamic Forex28 Navigator は、長年人気のインジケーターを進化させたもので、3 つの機能を 1 つにまとめています。 Advanced Currency Strength28 インジケーター (レビュー 695 件)  + Advanced Currency IMPULSE with ALERT (レビュー 520 件) + CS28 コンボ シグナル (ボーナス)。 インジケーターの詳細 https://www.mql5.com/en/blogs/post/758844 次世代の Strength インジケーターが提供するもの  オリジナルで気に入っていたすべての機能が、新機能と精度の向上によって強化されました。 主な機能: 独自の通貨強度計算式。 すべての時間枠でスムーズかつ正確な強度ライン。 トレンドの特定と正確なエントリーに最適です。 ダイナミックマーケットフィボナッチレベル (マーケットフィボナッチ)。 このインジケーターに固有
IX Power: 指数、商品、暗号資産、外国為替市場の洞察を発見 概要 IX Power は、指数、商品、暗号資産、外国為替市場の強弱を分析するための多用途ツールです。 FX Power が全ての利用可能な通貨ペアデータを活用して外為ペアで最高の精度を提供する一方、 IX Power は基礎資産の市場データにのみ焦点を当てています。この特性により、 IX Power は非外為市場に最適であり、単純な外為分析にも信頼性の高いツールです。どのチャートでもスムーズに機能し、取引判断を向上させるための明確で実行可能な洞察を提供します。 1. IX Power がトレーダーにとって価値がある理由 複数市場での強弱分析 • IX Power は指数、商品、暗号資産、外為シンボルの強弱を計算し、それぞれの市場に合わせた洞察を提供します。 • US30、WTI、ゴールド、ビットコイン、または通貨ペアなどの資産を監視して取引機会を発見できます。 幅広い市場に適応 • 外為取引では、 FX Power が関連する全ての通貨ペアを分析することで比類のない精度を提供します。 • IX Power
Stratos Pali Indicator   is a revolutionary tool designed to enhance your trading strategy by accurately identifying market trends. This sophisticated indicator uses a unique algorithm to generate a complete histogram, which records when the trend is Long or Short. When a trend reversal occurs, an arrow appears, indicating the new direction of the trend. Important Information Revealed Leave a review and contact me via mql5 message to receive My Top 5 set files for Stratos Pali at no cost! Dow
Scalper Vault は、スキャルピングを成功させるために必要なすべてを提供するプロフェッショナルなスキャルピング システムです。このインジケーターは、外国為替およびバイナリー オプションのトレーダーが使用できる完全な取引システムです。推奨される時間枠は M5 です。 システムは、トレンドの方向に正確な矢印シグナルを提供します。また、トップとボトムのシグナルとギャン マーケット レベルも提供します。 インジケーターは、プッシュ通知を含むすべてのタイプのアラートを提供します。 インジケータの購入後にご連絡ください。私の個人的な取引の推奨事項と素晴らしいボーナス指標を無料で共有します! 幸せで有益な取引をお祈りします!
今、147ドル(いくつかの更新後に499ドルに増加します) - 無制限のアカウント(PCSまたはMac) RelicusRoad ユーザー マニュアル + トレーニング ビデオ + プライベート Discord グループへのアクセス + VIP ステータス 市場の新しい見方 RelicusRoad は、外国為替、先物、暗号通貨、株式、および指数の世界で最も強力な取引インジケーターであり、トレーダーに収益を維持するために必要なすべての情報とツールを提供します。初心者から上級者まで、すべてのトレーダーが成功するためのテクニカル分析と取引計画を提供します。これは、将来の市場を予測するのに十分な情報を提供する重要な取引指標です。意味をなさないチャート上のいくつかの異なる指標ではなく、完全な解決策を信じています.これは、信号、矢印 + 価格アクション情報を表示するオールインワンのインジケーターで、他に類を見ない非常に正確です。 強力な AI に基づいて、RelicusRoad は不足している情報とツールを提供して、あなたを教育し、トレーディングのプロ、成功したトレーダーにします。 ほと
- Real price is 80$ - 40% Discount (It is 49$ now) - Lifetime update free Contact me for instruction, add group and any questions! Related Products:  Bitcoin Expert , Gold Expert - Non-repaint - I just sell my products in Elif Kaya profile, any other websites are stolen old versions, So no any new updates or support. Introduction The breakout and retest strategy is traded support and resistance levels. it involves price breaking through a previous level.  The break and retest strategy is design
Advanced Supply Demand
Bernhard Schweigert
4.91 (294)
現在33%オフ 初心者にもエキスパートトレーダーにも最適なソリューション このインジケーターは独自の機能と新しい公式を多数内蔵しており、ユニークで高品質かつ手頃な取引ツールです。このアップデートでは、2つの時間枠ゾーンを表示できるようになります。より長いTFだけでなく、チャートTFとより長いTF(ネストゾーンを表示)の両方を表示できます。すべてのSupply Demandトレーダーの皆さんのお気に召すはずです。:) 重要情報の公開 Advanced Supply Demandの可能性を最大化するには、 https://www.mql5.com/ja/blogs/post/720245 にアクセスしてください。   エントリーまたはターゲットの正確なトリガーポイントを正確に特定できれば取引がどのように改善されるか想像してみてください。新しい基盤となるアルゴリズムに基づいて構築されているため、買い手と売り手の間の潜在的な不均衡をさらに簡単に特定できます。これは、最も強い需要と供給のゾーンと、過去のパフォーマンス(古いゾーンを表示)がグラフィカルに表現されるためです。これらの機能は、最適な
FX Power: 通貨の強弱を分析して、より賢い取引を実現 概要 FX Power は主要通貨と金の実際の強弱をあらゆる市場状況で理解するための必須ツールです。強い通貨を買い、弱い通貨を売ることで、 FX Power は取引の意思決定を簡素化し、高い確率の取引機会を見出します。トレンドを追従する場合でも、極端なデルタ値を使用して反転を予測する場合でも、このツールはあなたの取引スタイルに完全に適応します。ただ取引するだけではなく、 FX Power で賢く取引をしましょう。 1. なぜ FX Power がトレーダーにとって非常に有益なのか 通貨と金のリアルタイム強弱分析 • FX Power は主要通貨と金の相対的な強弱を計算し、マーケットダイナミクスに関する明確な洞察を提供します。 • どの資産がリードしているか、または後れを取っているかを監視して、取引するペアを賢く選びましょう。 マルチタイムフレームの包括的なビュー • 短期、中期、長期のタイムフレームで通貨と金の強弱を追跡し、マーケットトレンドに基づいて取引戦略を調整できます。 • スキャルピングからスイングトレード
KT Renko Patterns MT4
KEENBASE SOFTWARE SOLUTIONS
2.33 (3)
KT Renko Patterns は、レンコチャートの各レンガをスキャンしながら、さまざまな金融市場でトレーダーによく使用されている有名なチャートパターンを検出します。 時間ベースのチャートと比較して、レンコチャートは視認性が高くシンプルなため、パターンベースのトレードがより簡単かつ明確になります。 KT Renko Patterns は複数のレンコパターンを搭載しており、その多くは Prashant Shah 氏の著書『Profitable Trading with Renko Charts』でも詳しく解説されています。 KT Renko Patterns インジケーターに基づいた 100% 自動化された EA は、こちらからご利用いただけます - KT Renko Patterns EA 。 機能一覧 最大8種類の明確なレンコパターンを表示し、あいまいさなく取引をサポートします。 完全な客観性を保つため、すべてのパターンにストップロスとフィボナッチターゲットが設定されています。 KT Renko Patterns は各パターンの精度を継続的に測定し、重要な統計情報をチャート
ご紹介     Quantum Breakout PRO は 、ブレイクアウト ゾーンの取引方法を変革する画期的な MQL5 インジケーターです。 13年以上の取引経験を持つ経験豊富なトレーダーのチームによって開発された Quantum Breakout PROは 、革新的でダイナミックなブレイクアウトゾーン戦略により、あなたの取引の旅を新たな高みに押し上げるように設計されています。 クォンタム ブレイクアウト インジケーターは、5 つの利益ターゲット ゾーンを備えたブレイクアウト ゾーン上のシグナル矢印と、ブレイクアウト ボックスに基づいたストップロスの提案を提供します。 初心者トレーダーにもプロのトレーダーにも適しています。 量子EAチャネル:       ここをクリック MT5バージョン:   ここをクリック 重要!購入後、インストールマニュアルを受け取るためにプライベートメッセージを送ってください。 推奨事項: 時間枠: M15 通貨ペア: GBPJPY、EURJPY、USDJPY、NZDUSD、XAUUSD アカウントの種類: ECN、Raw、またはスプレッドが非
MTF Supply Demand Zones
Georgios Kalomoiropoulos
4.82 (22)
次世代の自動化された需要と供給のゾーン。どのチャートでも機能する新しい革新的なアルゴリズム。すべてのゾーンは、市場の価格行動に従って動的に作成されています。 2種類のアラート --> 1) 価格がゾーンに達したとき 2) 新しいゾーンが形成されたとき もう 1 つの役に立たない指標はありません。実績のある完全な取引戦略を手に入れることができます。     新機能:     価格が需給ゾーンに達したときにアラートを出す     新しい需給ゾーンが作成されたときにアラートを発します     プッシュ通知アラート     ピップ単位のゾーン幅ラベル     MTF のもう 1 つのタイムフレーム。したがって、現在より 2 時間足高いのではなく、現在より 3 時間足し上に見えるようになります。     アラート/ゾーン/MTF 機能を有効/無効にするボタン あなたが得る利点:     取引から感情を取り除きます。     取引エントリをオブジェクト化します。     確率の高いセットアップで利益を上げましょう。     描画ゾーンから時間を節約します。
Chart Patterns All in One」をデモモードでお試しいただき、ボーナスを獲得してください。デモモードで試した後、メッセージを送っていただければボーナスをお渡しします。 購入後にコメントを残すと、高品質なインジケーター8つをボーナスとして受け取れます。 Chart Patterns All-in-One インジケーターは、トレーダーがテクニカル分析で一般的に使用されるさまざまなチャートパターンを視覚化するのに役立ちます。このインジケーターは市場の潜在的な動きを特定するのに役立ちますが、収益性を保証するものではありません。購入前にデモモードでテストすることをお勧めします。 現在のオファー : 「Chart Patterns All in One」インジケーターが50%割引。 含まれるパターン : 1-2-3 パターン : 3つの主要なポイント(高値または安値)を使用して市場の反転を検出します。 買い : 2つの連続する安値の後に、前の高値よりも低い高値が出現。 売り : 2つの連続する高値の後に、前の安値よりも高い安値が出現。 可視化 : 特定されたポイントを線と矢印
Matrix Arrow Indicator MT4
Juvenille Emperor Limited
5 (3)
マトリックスアローインジケーターMT4は、すべてのシンボル/商品(外国為替、商品、暗号通貨、インデックス、株式)で使用できる100%再描画されていないマルチタイムフレームインジケーターに続くユニークな10in1トレンドです。マトリックスアローインジケーターMT4は、初期段階で現在のトレンドを判断し、最大10の標準インジケーターから情報とデータを収集します。 平均方向移動指数(ADX) 商品チャネルインデックス(CCI) クラシック平研アシキャンドル 移動平均 移動平均収束発散(MACD) 相対活力指数(RVI) 相対力指数(RSI) 放物線SAR ストキャスティクス ウィリアムズのパーセント範囲 すべてのインジケーターが有効な買いまたは売りシグナルを与えると、対応する矢印がチャートに印刷され、次のろうそく/バーの開始時に強い上昇トレンド/下降トレンドを示します。ユーザーは、使用するインジケーターを選択し、各インジケーターのパラメーターを個別に調整できます。マトリックスアローインジケーターMT4は選択されたインディケーターからのみ情報を収集し、それらのデータのみに基づいてアローを印刷
!SPECIAL SALE! The Reversal Master is an indicator for determining the current direction of price movement and reversal points. The indicator will be useful for those who want to see the current market situation better. The indicator can be used as an add-on for ready-made trading systems, or as an independent tool, or to develop your own trading systems. The Reversal Master indicator, to determine the reversal points,  analyzes a lot of conditions since the combined analysis gives a more accura
Apollo Secret Trend は、任意のペアと時間枠でトレンドを見つけるために使用できるプロのトレンド インジケーターです。インジケーターは、取引するペアや時間枠に関係なく、市場のトレンドを検出するために使用できる主要な取引インジケーターになることができます。インジケーターで特別なパラメーターを使用することにより、シグナルを個人の取引スタイルに適応させることができます。 このインジケーターは、PUSH 通知を含むすべてのタイプのアラートを提供します。インジケータの信号は再描画しないでください!提供されたスクリーンショットでは、アポロ シークレット トレンド インジケーターと買われ過ぎ/売られ過ぎのオシレーター インジケーターを組み合わせて見ることができます。これは完全に無料で提供されます。 購入後、2 番目の買われすぎおよび売られすぎのオシレーター インジケーターを無料で入手するために私に連絡してください!また、システムの使用方法についても説明します。お得な特典もご用意しております!
FX Volume
Daniel Stein
4.6 (35)
FX Volume:ブローカー視点で捉える本物の市場センチメント クイック概要 トレード手法をさらに高めたいとお考えですか? FX Volume は、リテールトレーダーやブローカーのポジション状況をリアルタイムで提供します。これは、COTのような遅延レポートよりもはるかに早く知ることができます。安定した利益を目指す方も、さらなる優位性を求める方も、 FX Volume は大きな不均衡を見極め、ブレイクアウトを確認し、リスク管理を洗練させるのに役立ちます。今すぐ始めて、実際の出来高データがどのように意思決定を変革するかを体感してください! 1. FX Volume がトレーダーにとって非常に有益な理由 高精度の早期警戒シグナル • 各通貨ペアを売買しているトレーダー数を、他者よりも早く、ほぼリアルタイムで把握できます。 • FX Volume は、複数のリテールブローカーから得られる本物の出来高データを収集し、分かりやすい形式で提供する 唯一 のツールです。 強力なリスク管理 • ロングやショートの大きな偏り(インバランス)を特定し、潜在的なトレンド転換を見逃しません。ストップ
作者のその他のプロダクト
sinus arrows indicator is norepaint arrows indicator. it works all timeframes and all pairs. suitable for experienced traders and beginners. gives red arrows for sell.and gives blue arrows for buy. traders must check the all timeframes.i mean when trading 5m charts also need the check 15m charts and 1m charts. there is cnt number to see the how much bars back bars.
Up Down v6
Guner Koca
4.45 (11)
on demo mode use date to work. on version 13 wave added.13.1 histogram and trigger line can be changeble. wave can be set 200-500. can have different signal on wave 200 up-down indicator is no repaint and works all pairs and lower than weekly time frames charts. it is suitable also 1 m charts for all pairs. and hold long way to signal. dont gives too many signals. when red histogram cross trigger line that is up signal.and price probably will down when blue histogram cross trigger line that is
step divergency indicator is a buy sell divergency indicator.include sinus wave indicator. it work all timeframes and all pairs. red line gives step divergency sell formations. blue line gives step divergency buy formations. suitable for experienced and beginners. when prices is moving up and red lines step down ..this is sell divergecy formation and if prices moving down but blue line moving step up this is buy divergency formation.  increased cnt value show more back side. gold line is sinus w
Sinus wave Tv indicator is a extra ordinary oscillator.to find divergency. For mt4 and Tradingview pine script purchased people, after installed on terminal ,contact me on mql5  to get BONUS  TradingView pinescript. it works all pairs and all timeframes. suitable for experienced and beginner traders.. indicator works on toward of the prices... while sinus wave go up side that means prices will up. and while sinus wave go down that means prices is going down. it gives divegency when trend rever
sinus wave strong buy sell indicator is nonrepaint top bottom point indicator.it work all pairs and all timeframe.suitable for beginners and experienced traders. it depend to sinus wave and vertex base .gives signal sinus wave over zero or below zero on approppirate vertex positions. cnt number has been set to 500 bars for demo mode. it can be increase to 2000 depend to charts has bar numbers. minimum value is 500.  white points on red vertex spikes means sell. white points on blue vertex spikes
on demo mode use date to work. indicator is no repaint trend indicator. when red stars up to line that is probably end of long trades. when blue stars up to line that is probably end of down trades. indicator can use all pairs and lower than weekly charts, to use weekly chart need to at least 500 bars data on back.and lowering processing value 500. it is also suitable for 1m charts. indicator hold long way to go. there is not too many signals.
volatility level indicator is a volatility oscillator to see trend reversal points. price trends has reverese when volatility inreased . this indicator show trend reversal points volatility. mostly same level up and down volatility is reversal points. red colour shows up points of volatilty.and probably trend will down. blue colour oscillator shows deep point of price when increased volatiliyty. on pictures horizontal lines on oscillator has drawed by hand.to see the before level and compare now
Sinus wave  indicator is a extra ordinary oscillator.to find divergency. it works all pairs and all timeframes. suitable for experienced and beginner traders.. indicator works on toward of the prices... while sinus wave go up side that means prices will up. and while sinus wave go down that means prices is going down. it gives divegency when trend reversals. It also gives sell divergency on bear markets there is wave to set default 500. It can be increase depends to charts bars numbers on pictur
up down stars indicator is no repaint indicator. it hold long way to signals. suitable all pairs and all timeframes. it needs at least 1000 bars on charts. 1 is critical level for signals. if red line reach 1 it gives red star to sell.. if blue line reach 1 it gives blue star to buy.. signals comes mostly exact time. sometimes lower timeframes it makes consecutive signals.
up down v6 for mt5 is no repaint all timeframe and all pairs indicator. red histogram cros trigger that is up point,and put a red point on histogram. and blue histogram cros trigger that is deep point.and put blue point on histogram. this indicator need to sometimes zoom out .for thise pres + button. if newly comes signal is too high makes before invisible.red and blue points are there.to see the signals. indicator is no repaint and can use all time frame and all pairs. only need minimum 500 bar
indicator is no repaint trend indicator.for mt5 when white stars up to Red histogram that is probably end of long trades. when White stars up to Blue histogram that is probably end of down trades. indicator can use all pairs and lower than weekly charts, to use weekly chart need to at least 500 bars data on back.and lowering processing value 500. it is also suitable for 1m charts. indicator hold long way to go. there is not too many signals.
Thise indicator is up down v6  comes with tradingwiev pinescript. purchased people, after installed on terminal ,contact me on mql5  to get BONUS  TradingView pinescript. up-down indicator is no repaint and works all pairs and lower than weekly time frames charts. it is suitable also 1 m charts for all pairs. and hold long way to signal. dont gives too many signals. when red histogram cross trigger line that is up signal.and price probably will down when blue histogram cross trigger line that i
up down v7 indicator is a  no repaint trend indicator.this is different version of up down v9.use different algoritm. it works all pairs and and all timeframes. dont use processed value lower than 500 bars.you can increase it acording to chart bar counts.2000-3000 there is  blue histogram gives divergencies and extreme points. when gold points on  histogram it gives extreme sell signal. when aqua points below  histogram it gives extreme buy signal. for to see extreme signals switch timefremes 1m
Arrow line indicator is no repaint trend indicator. it works  on all time frame and all pairs. it is a pi number ( π) trigger based  trend indicator. suitable for experienced traders and beginners. easy to understand. there is a trigger line and 2 histograms. red histogram is ower trigger that is top signal.. blue histogram is over trigger that is bottom signal. minimum bar number is 500. processed value must be setled between 500-3000. max value is depend to chart you are using.
Sinus wave  indicator is a extra ordinary oscillator.to find divergency.for mt5 it works all pairs and all timeframes. suitable for experienced and beginner traders.. indicator works on toward of the prices... while sinus wave go up side that means prices will up. and while sinus wave go down that means prices is going down. it gives divegency when trend reversals. there is wave to set default 500. on pictures divergency lines and letters has been drawn by hand.to explain how it works.
フィルタ:
レビューなし
レビューに返信
バージョン 1.1 2025.04.03
close...-high..low