Advanced Monet tron indicators
- インディケータ
- Aliya Bolek
- バージョン: 1.30
- アップデート済み: 9 4月 2025
- アクティベーション: 5
MONEYTRON – ТВОЙ ЛИЧНЫЙ СИГНАЛ НА УСПЕХ!
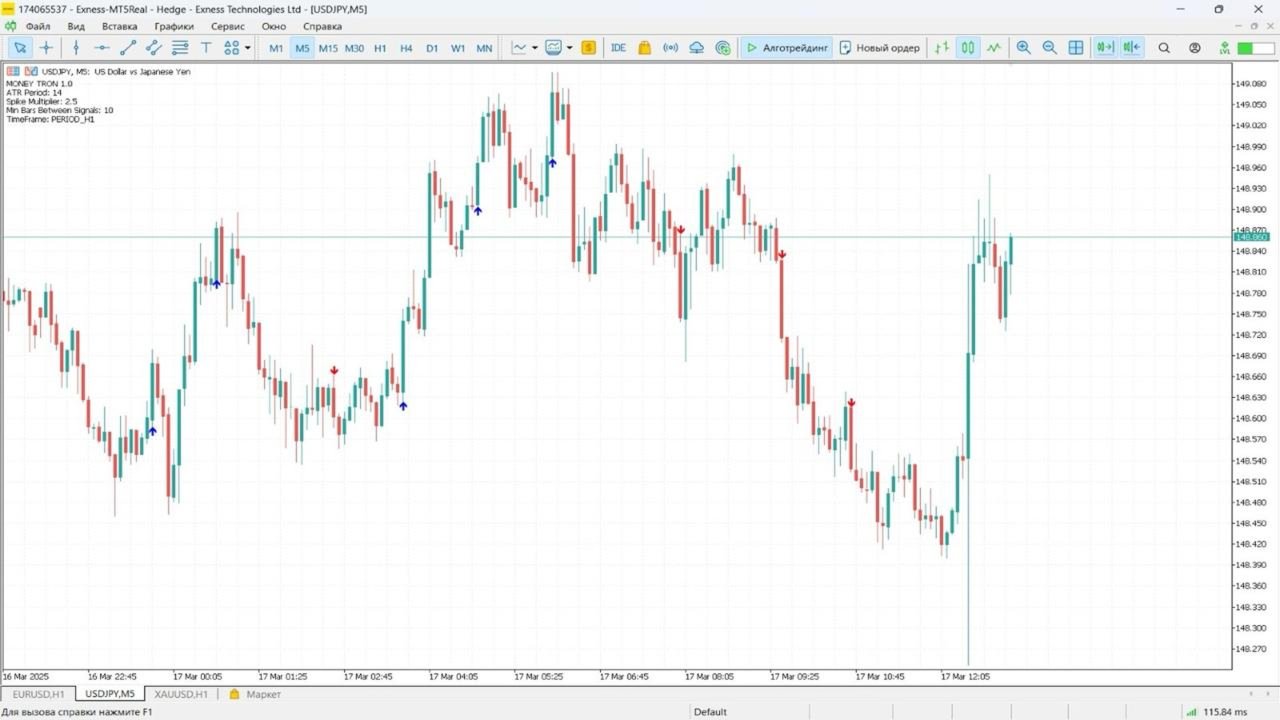
XAUUSD | AUDUSD | USDJPY | BTCUSD
Поддержка таймфреймов: M5, M15, M30, H1
Почему трейдеры выбирают Moneytron?
82% успешных сделок — это не просто цифры, это результат продуманной логики, точного алгоритма и настоящей силы анализа.
- Автоматические сигналы на вход — не нужно гадать: когда покупать, когда продавать.
- 3 уровня Take Profit — ты сам выбираешь свой уровень прибыли: безопасный, уверенный или максимум.
- Четкий Stop Loss — контролируешь риски с первой секунды.
- Работает в реальном времени — без задержек, без перерисовки, без “если”.
Для кого создан Moneytron?
- Для новичков — простая визуализация, всё понятно с первого взгляда.
- Для опытных — идеальный фильтр и усилитель своей стратегии.
- Для тех, кто устал сливать и хочет систему, а не хаос.
Проверенная эффективность:
- 41 из 50 сделок в плюс
- Работает на золоте, долларе, и даже биткоине
- Установил — и сразу в деле!

нас обманули с этим индикатором, в Маркете есть получше варианты в 3-4 раза дешевле