SuperTrend MultiTF
- インディケータ
- Salman Soltaniyan
- バージョン: 1.1
- アクティベーション: 20
A powerful trend-following tool that uses ATR-based volatility to identify market trends across multiple timeframes. This enhanced version allows you to overlay the SuperTrend of a higher timeframe directly on your current chart, helping you align your trades with the dominant trend.
How It Works
The indicator calculates dynamic support and resistance levels using Average True Range (ATR):
-
Upper Band = Source Price + (Multiplier × ATR)
-
Lower Band = Source Price - (Multiplier × ATR)
-
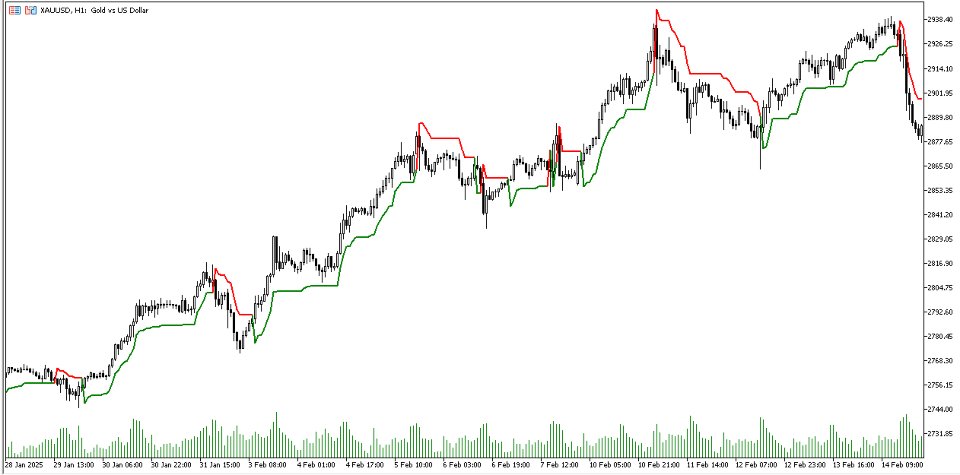
In an uptrend, the SuperTrend line (green) is plotted below the price as support.
-
In a downtrend, the SuperTrend line (red) is plotted above the price as resistance.
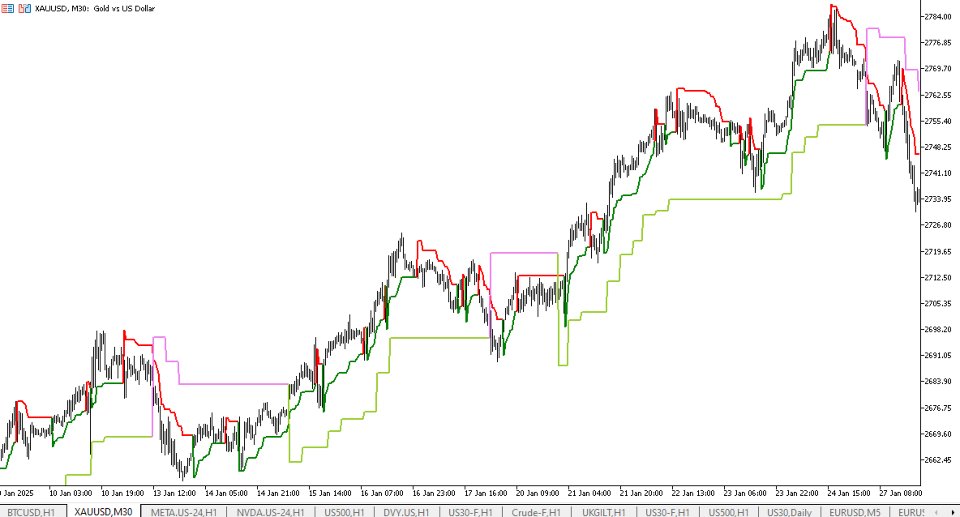
The multi-timeframe functionality lets you view the SuperTrend of a higher timeframe (e.g., H1, H4) on your current chart, providing a clearer picture of the overall trend.
Usage
-
Trend Following: Enter long in uptrends, exit in downtrends.
-
Trailing Stop: Use as a dynamic stop-loss.
-
Multi-Timeframe Analysis: Confirm trends using higher timeframes.
Why Choose It?
-
Versatile: Works for forex, stocks, crypto, and more.
-
Time-Saving: No need to switch charts for multi-timeframe analysis.
Support & Feedback
For reporting any bugs or sharing ideas for improvement, feel free to contact me. Your feedback is highly valued!
