Tipu Parabolic SAR Panel
- インディケータ
- Kaleem Haider
- バージョン: 2.0
- アップデート済み: 28 2月 2018
Tipu Parabolic SAR Panel is the modified version of the original Parabolic SAR indicator published by MetaQuotes here.
Dashboard Panel (multi symbol) version for this indicator is available here.
Features
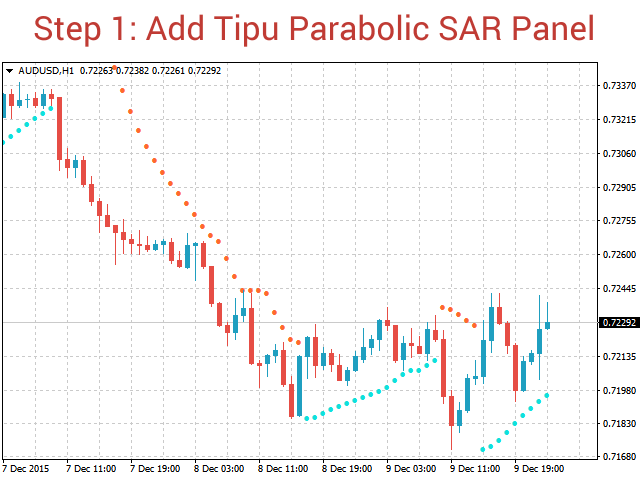
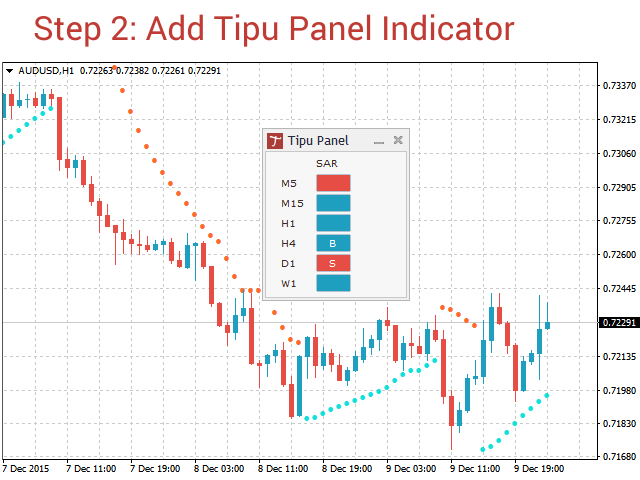
- An easy to use Panel that shows the Parabolic SAR trend and signals of selected timeframe.
- Customizable Buy/Sell alerts, push alerts, email alerts, or visual on-screen alerts.
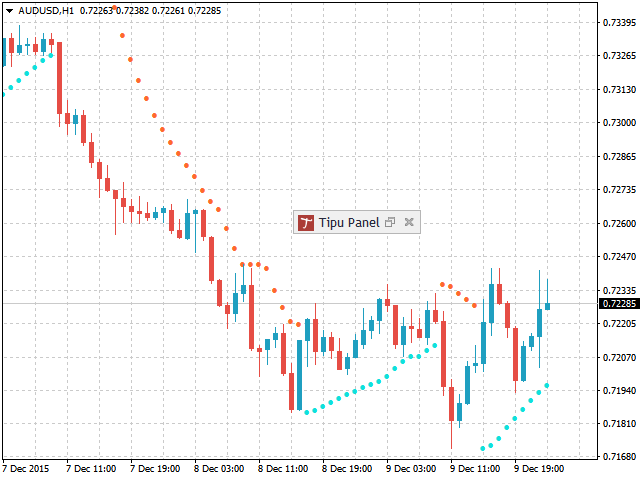
- Customizable Panel. The panel can be moved to any place on the chart or minimized to allow more space.
To enable these features you need Tipu Panel installed, found here.
Parabolic SAR (parabolic stop and reverse) is a method devised by J. Welles Wilder in his famous book New Concepts in Technical Trading Systems. It is a trend-following indicator that can be used for trailing stop. J. Welles recommend using Parabolic SAR to determine trend and different indicator such as Average Directional Index to determine the strength of the trend.
How to Use
The blue dots below the candles mean uptrend, and red dots mean downtrend. These dots may also be used in for stop loss placements for the trade positions and sequentially moved one candle after another. As a best practice, it is recommended to consider signals from other timeframes and/or other indicators before making a trade decision.
Calculation
SAR(i) = SAR(i-1)+ACCELERATION*(EPRICE(i-1)-SAR(i-1))
Where:
SAR(i-1) is the value of the indicator on the previous bar;
ACCELERATION is the acceleration factor;
EPRICE(i-1) is the highest (lowest) price for the previous period (EPRICE=HIGH for long positions and EPRICE=LOW for short positions).
Parameters
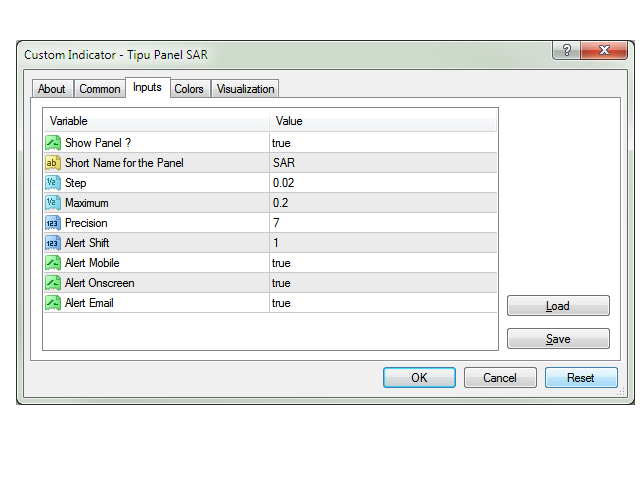
- Show Panel?: visibility settings, select true/false to show panel (need Tipu Panel added to the chart)
- Short Name for the Panel: short name for the panel heading on Tipu Panel
- Step: setting for Parabolic SAR
- Maximum: setting for Parabolic SAR
- Precision: setting for Parabolic SAR
- Alert Shift: candle delay for the signal, enter 1 if you want the alert sent after one candle to be passed
- Alert Mobile: select true/false to get push notification on your device, make sure the device settings are correct here
- Alert onscreen on change: select true/false to get alert on the terminal, this alert shows in a separate window
- Alert email on change: select true/false to get email alerts, make sure email settings are correct here
References
Wilder, J. (1978). The Parabolic System. In New concepts in technical trading systems. Greensboro, N.C.: Trend Research.


Супер.