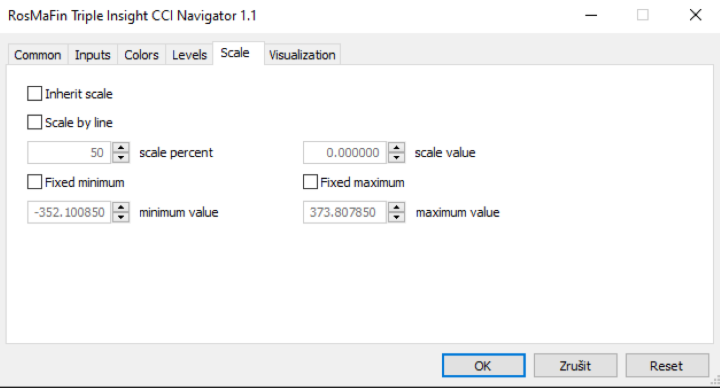
Triple Insight CCI Navigator
- インディケータ
- Rostislav Marek
- バージョン: 1.1
Main Indicator Description:
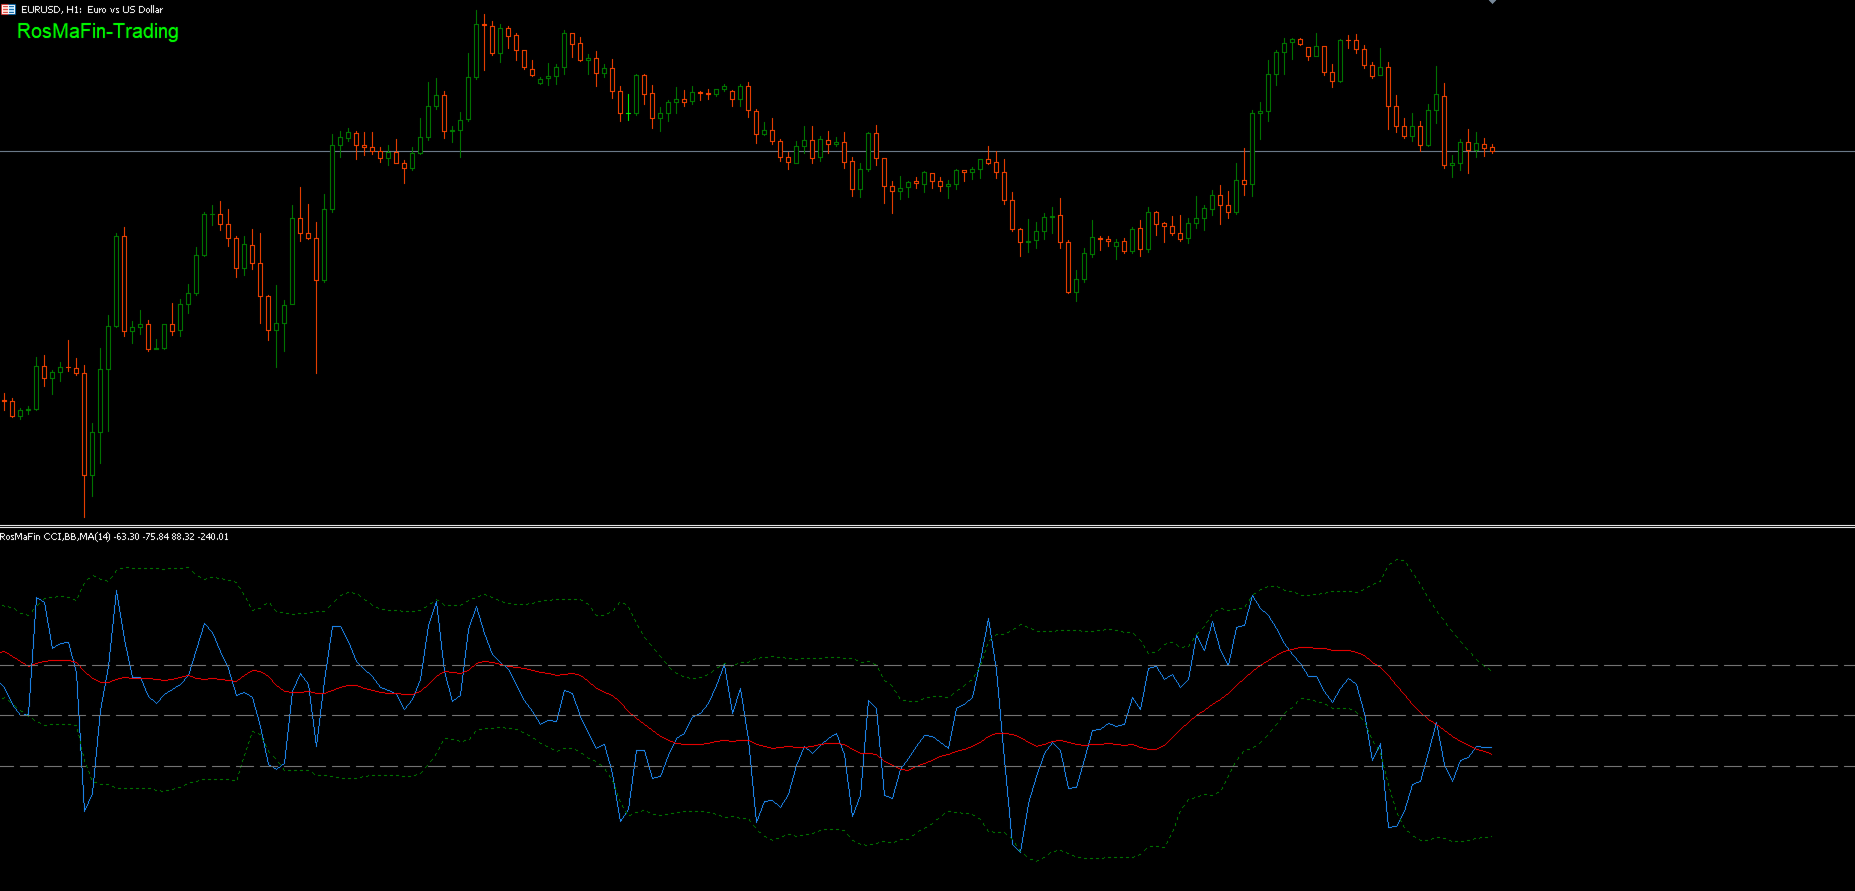
RosMaFin Triple Insight CCI Navigator is an advanced technical indicator that combines the power of three popular indicators - CCI (Commodity Channel Index), Bollinger Bands, and Moving Average - in one comprehensive window. This versatile tool provides traders with a complex view of market conditions and helps identify potential trading opportunities with greater precision.
Key Features:
- Display of all three indicators in one window for efficient analysis
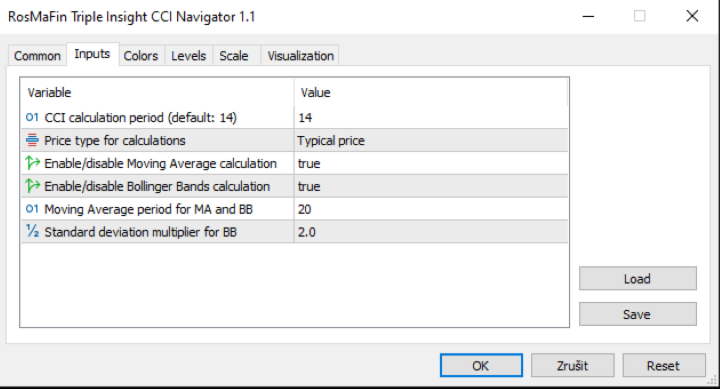
- Fully customizable parameters for each component
- Option to enable/disable MA and BB as needed
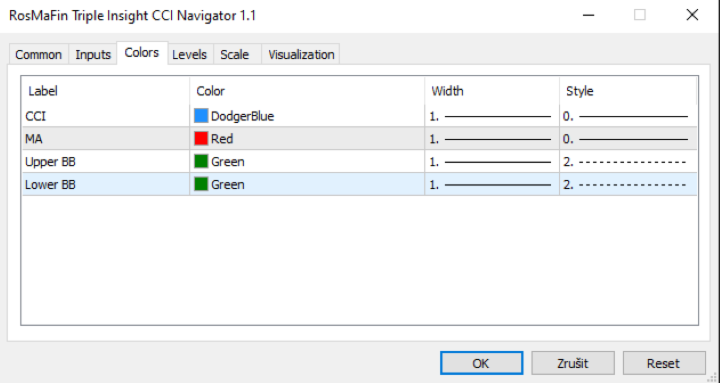
- Clear color distinction between individual curves
- Optimized for all timeframes and trading instruments
Detailed Component Description:
- Commodity Channel Index (CCI)
- Main component displayed in blue color
- Measures price deviation from its average value
- Helps identify overbought and oversold levels
- Standard period of 14 bars with adjustment option
- Reference levels +100 and -100 for easy interpretation
- Moving Average (MA)
- Displayed in red color
- Smooths the CCI curve for better trend readability
- Helps eliminate false signals
- Optional feature with disable option
- Standard period of 20 bars
- Bollinger Bands (BB)
- Displayed in dotted green lines
- Dynamic volatility bands applied to CCI
- Helps identify extreme values and potential reversals
- Standard setting of 2 standard deviations
- Optional feature with disable option
Practical Applications:
The indicator is ideal for:
- Identifying trends and their strength
- Finding market reversal points
- Confirming trading signals
- Analyzing market volatility
- Risk management using dynamic levels
Technical Details:
- Fully optimized for MetaTrader 5
- Minimal system requirements
- Regular updates and support
- Compatible with all trading instruments
This indicator is the result of careful development and testing, designed to provide reliable signals for informed trading decisions.