Volume Volatility Dashboard Multi Analyzer
- ユーティリティ
- Dominik Mandok
- バージョン: 3.1
- アップデート済み: 30 11月 2021
- アクティベーション: 10
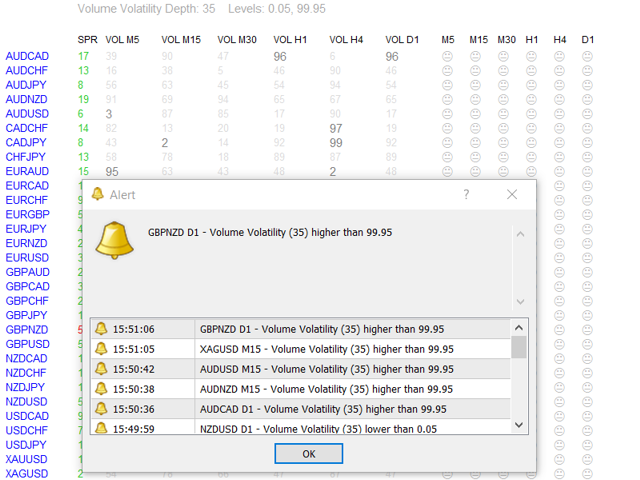
Volume Volatility Dashboard is a great tool for quickest possible analysis of multiple currency pairs in terms of extremely high and extremely low accumulation to distribution ratio in comparison to values from past.
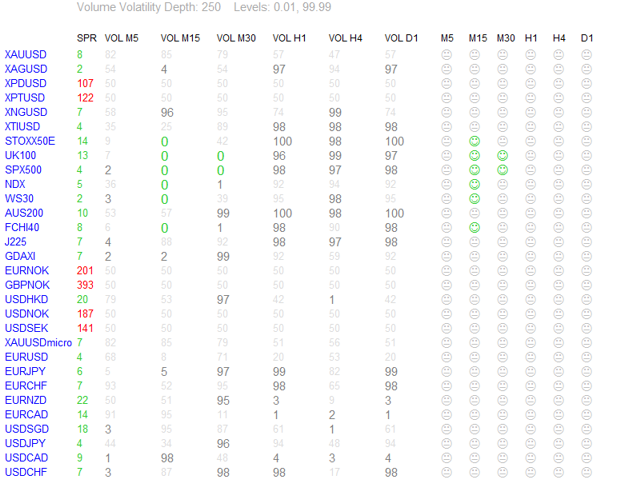
The number of displayed symbols is 30 and the name of each symbol can be edited in the parameters, so we are able to analyze not only predetermined currency pairs, but also other ones, commodities, equities, indices, currency pairs with prefixes and suffixes etc...
This analyzer is perfect for alert notifications through the MetaTrader terminal, push notifications to mobile device and also email alerts, e.g. from a VPS.
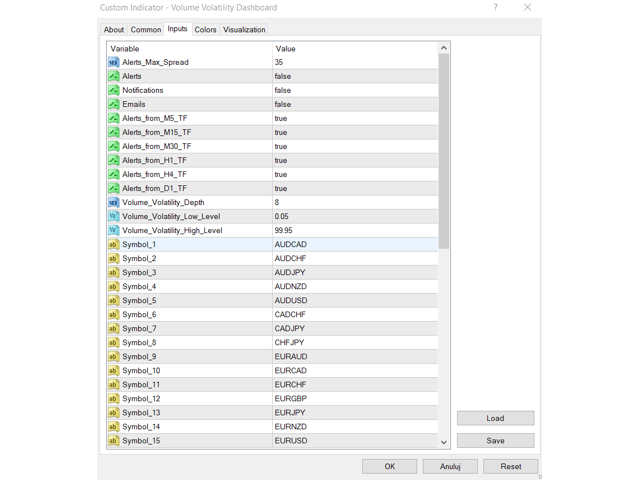
Volume Volatility Dashboard, except that it offers us the ability to set three methods of notifications, also gives us possibility to choose timeframes from which we will receive the alerts:
- a) "Alerts_from_M5_TF",
- b) "Alerts_from_M15_TF",
- c) "Alerts_from_M30_TF",
- d) "Alerts_from_H1_TF",
- e) "Alerts_from_H4_TF",
- f) "Alerts_from_D1_TF".
We can set maximum spread at which the alerts will come by modifying parameter "Alerts_Max_Spread".
The most important parameter is "Volume_Volatility_Depth" - this parameter, in big simplification, determines how distant past is analyzed. So, lower value of the parameter - indicator analyzes less data from the past. I recommend you to set and test different values (for example: 1, 5, 15, 75, 250 etc.) with different timeframes and currency pairs.
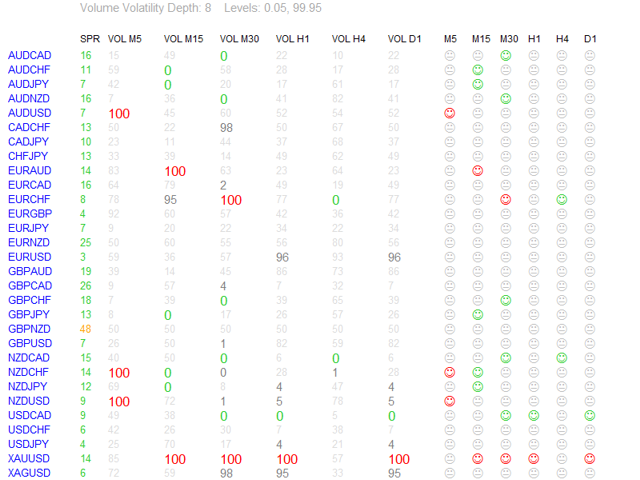
Parameter "Volume_Volatility_Low_Level" determines below which value we will get alerts and "Volume_Volatility_High_Level" - above which value.
For example, if we set "Volume_Volatility_Low_Level" to 1 and "Volume_Volatility_High_Level" to 99 we will get alerts, notifications or/and emails only when values will be lower than 1 or higher than 99. "Volume_Volatility_Low_Level" set to 0 and "Volume_Volatility_High_Level" set to 100 give alerts only in extreme conditions - when the indicator reaches a value of 0 or 100. Displayed values are rounded to the nearest integer, e.g. when appears "0" it does not mean that indicator reaches exactly value 0 only that it is approximation to the nearest integer number which is 0, but value could be 0.001 or other. In this case we waiting till indicator reaches 0 and then sends alert/notification/email.
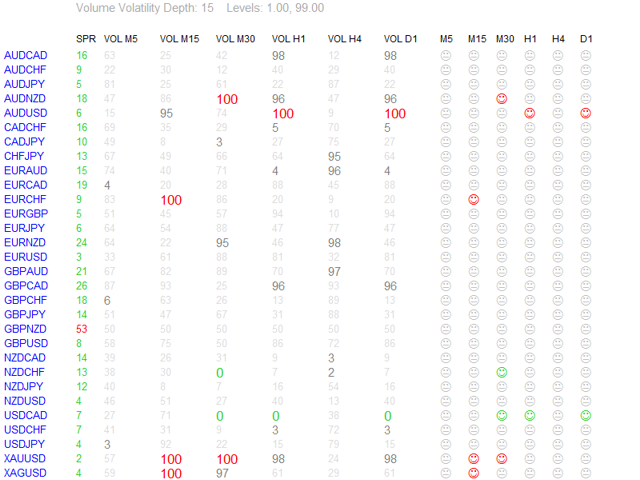
Green color of value means that value is below "Volume_Volatility_Low_Level" (suggestion to buy), red color means that value is above "Volume_Volatility_High_Level" (suggestion to sell). And default, gray color is when value is maximal value of "Near_Level_Percent" (which we can set) points above "Volume_Volatility_Low_Level" or below "Volume_Volatility_High_Level".
Spread values also can have different colors:
- a) when value is lower or equal to "Alerts_Max_Spread",
- b) between 1 and 1.5 times higher than this parameter,
- c) above 1.5 times higher than this parameter.
In header of dashboard are displayed 3 actual parameters: Volume Volatility Depth and 2 Volume Volatility Levels.
Every color of Volume Volatility Dashboard is modifiable.
I suggest you to make in new chart window new template with only "Volume Volatility Dashboard" indicator and scheme without colors ("None"), only Background and Foreground set to "White".
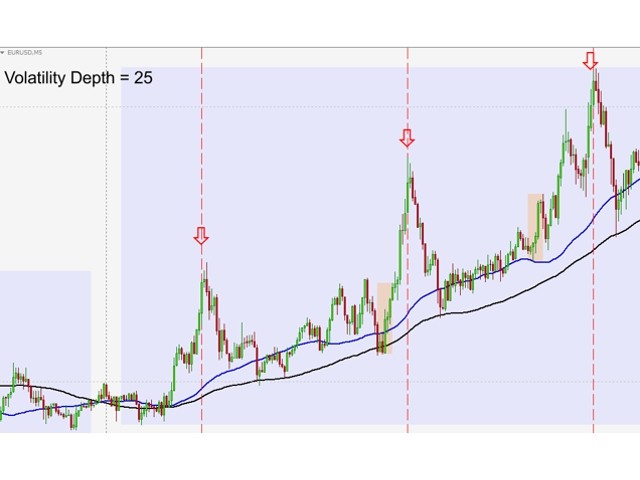
Volume Volatility Dashboard is very helpful in recognition market conditions, recognizes volume extremes which lead to changes of trend or retracements, but remember to be always careful when important political and macro-economic messages are published, when price oscillates around important support and resistance levels, pivots or round numbers and obviously always pay special attention to price action. It is also very important to check trend on a higher timeframe before enter the market.
Dashboard analyzes and calculates many bars (it depends on parameter "Volume_Volatility_Depth") of many currency pairs in highest/lowest volume conditions and makes it at the same time, so first time after putting this indicator in chart window you must wait a few seconds until everything is loaded and ready to work.
Remember, no one except yourself is responsible for any investment decision made by you. You are responsible for your own investment research and investment decisions.
Good luck!
























The best Dashboard I ever use. Win win win