Multi Moving Average MT5
- インディケータ
- Stefanus Wardoyo
- バージョン: 1.2
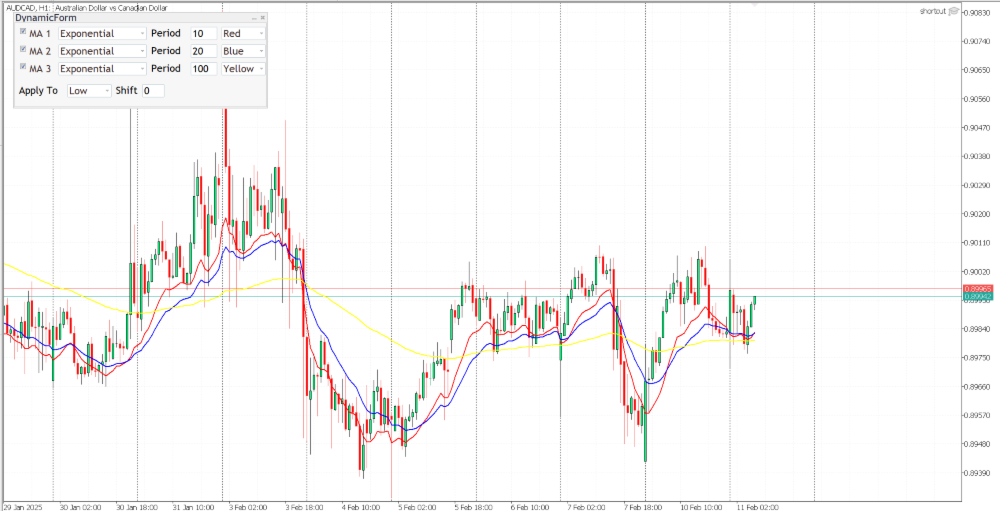
This is simple indicator for displaying Multi Moving Average line in chart, with one single Indicator.
Just place the indicator in your chart, select how many MAs you want to display. And you are ready to go.
Parameters can be changed on the fly by the control panel provided by the Indicator.
And you can show/hide the Moving Average line just with check/unchecked in the Panel.
This indicator are still in development, if you have any further feature request, please let me know in the comment.